Low Carbon Society: A Green Roadmap for India
|
|
|
- Nathan Rodgers
- 5 years ago
- Views:
Transcription
1 Low Carbon Society: A Green Roadmap for India Aashish Deshpande National Institute of Environmental Studies, Tsukuba, Japan Maulana Azad National Institute of Technology, Bhopal, India P.R. Shukla Indian Institute of Management, Ahmedabad, India Low Carbon Society Model Capacity Building Workshop AIM (Asia Pacific Integrated Model) November 19, 21, Bangkok
2 Outline India s Commitments, Actions and Drivers Developing National LCS Roadmap Developing Regional LCS Roadmaps Case Study: Ahmedabad, India Case Study: Bhopal, India Building Sector Studies Actions and Barriers for LCS Pathways
3 India: Commitments, Actions and Drivers Commitments and Actions Copenhagen Commitments 2 to 25% Emissions Intensity Reduction from 25 to 22 Per Capita Emissions Below OECD Average (through 21) National Climate Change Action Plan - 8 National Missions 1.Solar Energy (2 GW by 222; 2 GW off-grid; 2 m sq. m collectors) 2.Enhanced energy efficiency (Avoided capacity of 19 MW by ) 3.Sustainable habitat 4.Water Sector (2% water use efficiency improvement) 5.Sustaining the Himalayan eco-system 6.A Green India (2 Mil. Hectare afforestation by 22; Forest cover from 23 to 33%) 7.Sustainable agriculture (micro irrigation promotion in 4 m ha) 8.Strategic knowledge for climate change Domestic Actions Carbon tax on coal to fund clean energy US $1/ton on domestic & imported coal; funds to be use for Clean Energy Enhanced Energy Efficiency measures National Solar mission (2 GW by 222; 2 GW off grid; 2 m sq. m collectors) Mass Distribution of CFLs Potential reduction of 6 GW of electricity demand Base Year 25=1 Drivers of Economy Population (Million) % % Growth Rate 2.15% % 1.1% GDP Annual Growth Rate 25-5: 7.3% Annual Growth Rate 25-32: 8%
4 BAU Projections: Analysis with ANSWER MARKAL Model Assumptions From 25-25: Annual Economic Growth: 7.34 % Annual Population Growth:.8 % Absolute Growth in 25 over 25 Economy 24 times Population 1.43 times Mtoe Biomass Other Renewables Wind Solar Nuclear Hydro Gas Oil Coal Energy Million Ton CO2 8, 7, 6, 5, 4, 3, 2, Carbon Emissions 5 1, Annual Improvement From 25-25: Energy Intensity: 3. (%) Carbon Intensity: 3.6 (%) Decarbonization of Energy: -.6 (%) Results: Energy and Carbon Intensity Ratios: 25 over 25 Final Energy Demand: 6.27 Energy Intensity:.26 Carbon Intensity:.19
5 Mitigation Options: Perspectives Million Ton CO2 8, 6, 4, 2, Fossil Switch Baseline Emissions Emissions (for 2 O Target) Carbon Price ($) Other CCS Device Efficiency Nuclear Renewable Conventional Approach: transition with conventional path and carbon price High Carbon Price Climate Focused Technology Push Top down/supply side actions Technology Co operation Areas Energy Efficiency Wind/Solar/Biomass/Small Hydro Nuclear/CCS Sustainability Approach: aligning climate and sustainable development actions Low Carbon Price Bottom up/demand side actions Behavioural change Diverse Technology portfolio Technology Co operation Areas Transport Infrastructure Technologies 3R, Material Substitutes, Renewable Energy Process Technologies Urban Planning, Behavioral Changes Million Ton CO2 8, 6, 4, 2, Fossil Switch Emissions (for 2 O Target) Carbon Price ($) CCS Transport Reduced Consumption Recycling Material Substitutions Device Efficiency Renewable Energy Building

6 Low Carbon Society Case Study: Ahmedabad, India
7 Co benefits in City Planning: Ahmedabad Ahmedabad (29) Pop 5.5 Mil Mitigation Potential Vehcile Efficiency Industrial Efficiency AMC (New boundary AMC ) (Old boundary ) Mt CO Building Efficiency Fuel Switch Energy Intensity of service demand Emissions BaU 235 LCS 25 BaU 25 LCS 1% 8% 6% 4% 2% % 25 BaU 25 LCS Transport Modal Shares Ktoe Walk+ Cycle 2W Train Bus Car & 3 W Sustainable Low Carbon Infrastructures Water Energy Nexus Sewage treatment Municipal Industrial Household BAU 25 LCS Per Capita Emissions BAU 235 LCS 25 BaU 25 LCS Per Capita Emissions ( t CO2) Analysis with AIM/EXSS Model

8 Low Carbon Society Case Study: Bhopal, India


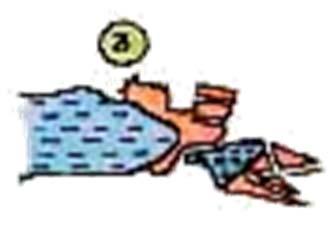

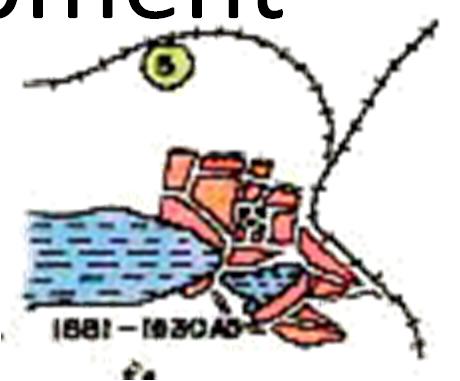
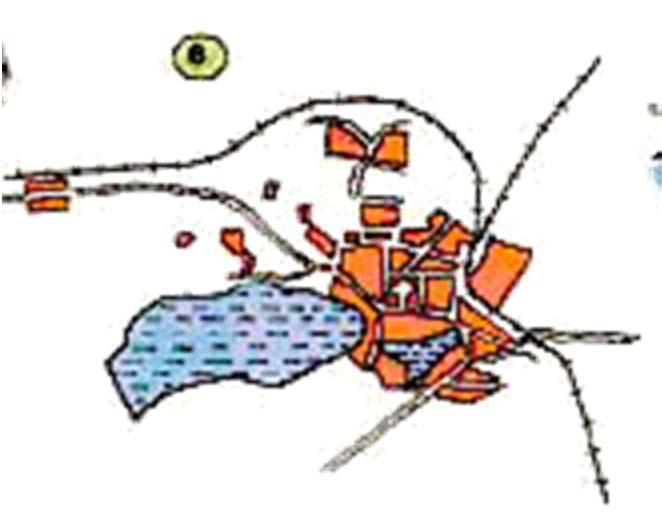
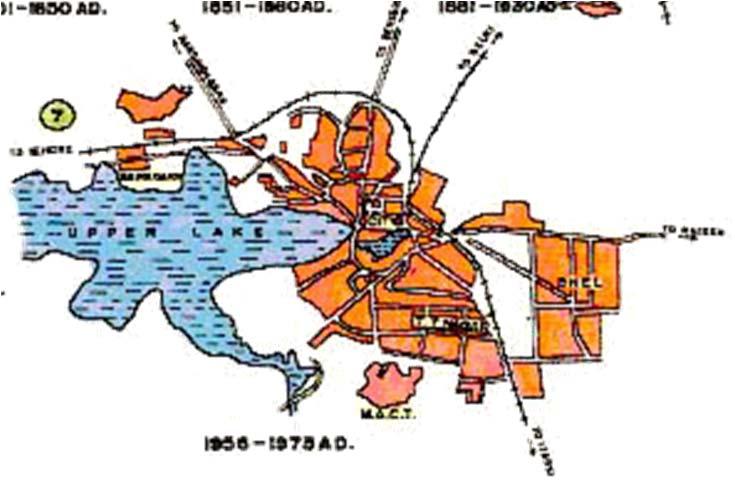
9 Bhopal: Chronological Development AD AD AD AD AD AD AD AD

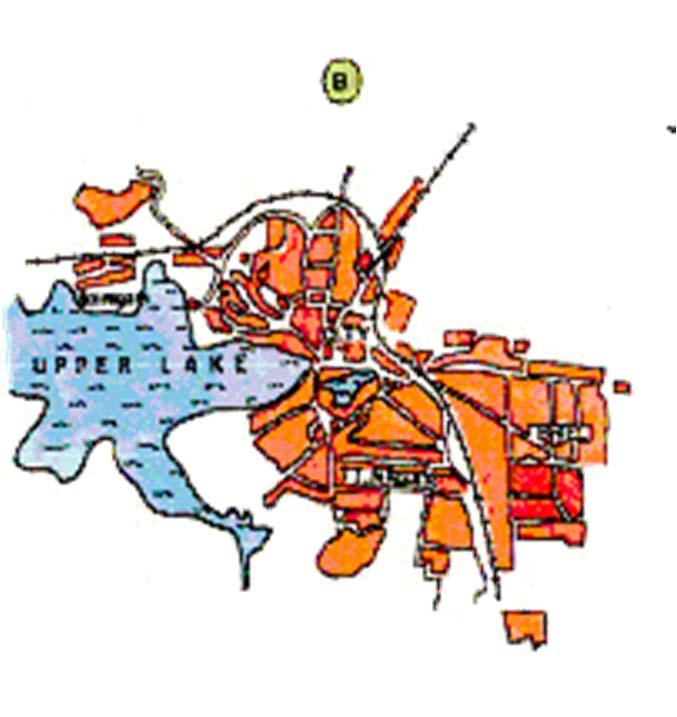
10 Landuse 221


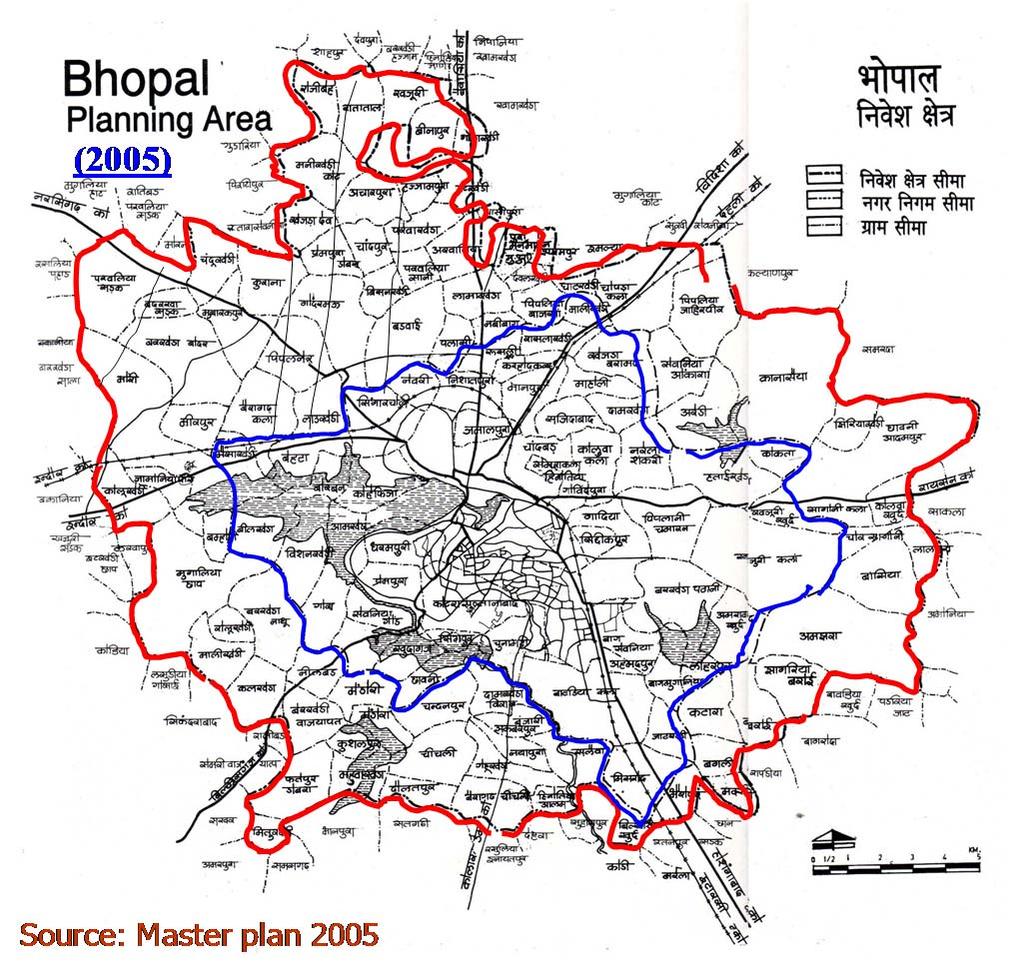
11 Bhopal, India The city is centrally located. The climate is composite climate representing a large part of the country. The city has physical features like large water body, Hills and forests for analysis of local variations. A million plus city, it can represent the majority of Indian cities. Amongst the 21 fastest growing cities in India.
12 Developing Bhopal LCS Scenario 235 The Methodology: Phase I Quantification of scenario estimates for Bhopal district Creation of narrative storylines of likely future Description of sector wise details of likely future Quantification of the macro economic considerations and social aspects Identification of possible effective policy measures Develop action plan for policy measures Phase II Design of policy roadmaps toward the Low Carbon Society To carry feasibility study of the roadmaps considering uncertainties involved in each policy option To analyze robustness of the roadmap with social, economic and institutional acceptability and uncertainties

13 Drivers of Change Bhopal (Distt.) PoP in Millions BPL Dist 25 BPL Dist (p) 235 BPL Dist (est) No of House Hold 1.8 HH in Millions 千 Two wheelers Autos/ Tempo Cars/Taxi Buses Goods Carriages Tractors/ Others Population trends DGDP on Current Prices (Mn INR) Bhopal PCDGDP at Current Prices 72% Transport (New Registration) trends 2% 4% % % 2% 8% 1% 2% Agriculture Sector Forestry Sector Fishing Sector District GDP distribution for base year 25 6 Mining and Quarrying Sector Manufacturing Sector Construction Sector Electricity,Gas,Water Supply Rest Of tertiary Sector Banking and Insurance Sector Economic trends and sectoral distribution of District GDP
14 Bhopal (Distt.) Socio Economic Indicators Average Number of people/household 5.4 on population of 21 Million (25) Demographic composition -14 [35%], [61%], 65+ [4%] Economic Characteristics Primary Sector (6.19%) DGDP (INR 7.4 billion) Secondary Sector ( 19.98%) Tertiary Sector (73.84%) Growth Rate of District % increase ( 2.59%) Domestic Product Decadal Growth Rate % increase (14%) ( )
15 The Scenarios Business As Usual (BAU) scenario The present trend in Bhopal has been considered with existing technology and prevailing economic and demographic trends. The BAU scenario for future energy consumption and emissions projection in Bhopal envisages the continuum of present government policies, and capture forecast for various economic, demographic, land use and energy use indicators. Low Carbon Society (LCS) scenario For analysing the possibilities of reducing the GHG emissions in future a sustainable development future scenario is drawn here for Bhopal that is expected to take it towards Low Carbon Society. The energy consumption trajectory / emissions trajectory in all the sectors of Bhopal that would result from aggressive policies to promote demand side management, energy efficiency, development of renewable energy, and other policies to promote sustainable development.

16 Bhopal (Distt.) LCS Scenario Development Preliminary Results with Transport and Energy Sector Intervention GHG Emission Scenario Passenger Transport Sector Mt CO Value in 25 = Passanger Transport Demand Energy Demand GHG Emissions _BaU 235_LCS BaU 235 LCS Residential Commercial Industry Passenger Transport Freight Transport GHG Emission Reduction (MtCO BaU 235 LCS Mitigation Contributions Reductuction in Energy service demand (T) Fuel Switch Efficiency Improvement (Transport) Emissions Analysis with AIM/EXSS Model
17 Building Sector Studies
18 Building Sector Studies Assumptions The energy consumption in built environment is primarily a function of Cooling and Heating needs Case Study Approach provides opportunity to study local variations and developing suitable actions Building Design: Form (shape), Orientation, Materials and Technology play an important role Temperature change and electricity demand Temperature data of the city analyzed for one year period Seasonal variations in electricity consumption identified Hourly temperature data and electricity consumption compared and analyzed Simulation Double storey building considered with select parameters Six alternate configurations analyzed. Software used for simulating the building.
19 Emerging Findings: Temperature Effect Electricity consumption in buildings is dependent on many factors. It is necessary to eliminate the effects of other influences to bring out the effect of temperature. Marked seasonality and periodicity in electricity demand Electricity consumption is well correlated with temperature change The correlation is more prominent during night hours CDD and HDD analysis are more useful Electrical Consumption KwH Electrical Consumption KwH Electrical Consumption KwH November July 27 3 March 28 July August Sept Oct at Zero hours 3 July August September 27 Date Series2 Electricity Consumption Series1 Temperature Nov Dec Jan Feb at Zero hours 16 November 27 3 November December 27 2 January 28 3 January 28 Date Series2 Electricity Consumption Mar Apr May Jun at Zero hours 17 March 28 1 April April May 28 Date Series2 Electricity Consumption 1 October February 28 Series1 Temperature 29 May 28 Series1 Temperature 28 February 31 October Temperature Degree Centigrades Temperature Degree Centigrades Temperature Degree Centigrades July-Aug- Sept-Oct Nov-Dec- Jan-Feb March-Apr- May-June
20 Emerging Findings: Simulation Building with longer axis northsouth consumes the highest energy The most efficient orientation is obtained when longer axis is northeast to south west Energy consumption well correlated with temperature change Highest energy consumption in summer months Space cooling requires maximum amount of energy Suitable construction material or provision of adequate insulating material may further reduce energy consumption Electric Consumption (kwh) Electric Consumption (kwh) Jan Feb Mar Apr May Jun Jul Aug Sep Oct Nov Dec Space Cool Heat Reject. Refrigeration Space Heat HP Supp. Hot Water Vent. Fans Pumps & Aux. Ext. Usage Misc. Equip. Task Lights Area Lights Longer axis north-south Jan Feb Mar Apr May Jun Jul Aug Sep Oct Nov Dec Space Cool Heat Reject. Refrigeration Space Heat HP Supp. Hot Water Vent. Fans Pumps & Aux. Ext. Usage Misc. Equip. Task Lights Area Lights Longer axis north-east to south-west
21 Low Carbon Society Actions & Barriers
22 Bhopal LCS Scenario Seven Actions Action 1: Walkable/Liveable/Green City Action 2: Integrated Transportation System Action 3: Land Use Planning Action 4: Energy efficient buildings Action 5: A Green Environment/nature conservation Action 6: Low Carbon Lifestyle Action 7: A Green Economy
23 Actions: Residential Sector Energy audit programmes Conducting energy audits to evaluate the most cost effective improvements. Fiscal Incentives Loan, grants and incentives programmes for energy conservation measures Energy code for New buildings Encourage or require increased installation of efficient lighting systems Requirement of more efficient cooling systems Increase window insulating values and requirement of shading devices Harnessingrenewable energy Use of renewable energy sources to meet rapid growth of energy demand, supporting economic development without increasing atmospheric greenhouse gas concentrations.
24 Actions: Transport Sector The cost effectiveness of technology specific policies: to be carefully considered like banning certain vehicles or prohibiting traffic in certain areas. Use of alternative fuels: vehicles using LPG/CNG emit considerably less particulate matter than conventional diesel. Traffic management measures: such as coordination of traffic lights, zebra crossings, side paths, left turns which yields significant economic benefits because it decreases congestion and improves mobility. Demand management: through provision of public transport, fiscal measures, area wide licensing, pricing instruments such as differential pricing for access and preferential treatment of high occupancy vehicles. Public transport dedicated bus. Use of non motorized transport (NMT) mechanism: to be promoted by curtailing motorization and elimination of impediments to NMT. Government intervention, like introducing stringent parking restrictions and constructing safe bicycle routes. Inspection and maintenance of vehicles and retirement and scrapping; retirement and scrapping of old vehicles and improved maintenance.
25 Actions: Transport Sector Fiscal measures: Higher taxation on purchase of new vehicles and for polluting fuels providing indirect incentive for penetration of cleaner fuels and technologies. Equitable allocation of road space: Reserving lanes and corridors exclusively for public transport and non motorized modes of travel Parking in city centres and commercial areas: Provision of planned parking spaces away from busy commercial areas with park and ride facilities Freight traffic management: Staggered freight and passenger traffic By enforcing the use off peak passenger travel times to move freight. By using and developing by passes for the through traffic. Private sector participation: for activities like the operation and maintenance of parking facilities, certification facilities, repair facilities, construction and management of terminal facilities, etc. Public awareness and cooperation: To organise awareness campaigns on the ill effects of the growing transport problems in urban areas with aim at encouraging individuals, families and communities to adopt Green Travel Habits.
26 Barriers to LCS Pathways No common generalized policies can be developed, Individual solutions are needed each of the city Success depends on the participation of local government / people Almost no awareness in smaller cities Capacity building is slow and time taking Good quality infrastructure and services are almost always necessary that are already stressed Development priorities may not be in line with LCS objectives Economic implications are not easy to anticipate
27 Thanks for your attention!