Rapid Sand Filtration: Laboratory Analysis and Profiling
|
|
|
- Brandon Richardson
- 5 years ago
- Views:
Transcription

1 Rapid Sand Filtration: Laboratory Analysis and Profiling Rachel Easter & Rachael Osborne Water Bacteriologist-Chemist Division of Water Supply & Treatment City of Dayton
2 Background Water Bacteriologist-Chemist Water Quality Laboratory The City of Dayton Water Department serves 400,000 people City of Dayton Montgomery County Pump MGD Two water treatment plants Lime softening and Cl disinfectant Ground water under the influence of surface water Lime Reclamation Facility
3 Overview Plants Filters- Types and Purpose Rapid Sand Filters- Materials Filter Rebuilding Filter maintenance and washing Filter Profiling Filter Analysis Profile results

4 Miami WTP Built in Rapid sand filters 8 filters added in: 1983 Filters last replaced: 2016 Each filter: 44 x 36-8 Upflow clarifier

5 Ottawa WTP Built in Rapid sand filters Filters last replaced: 2009 Each filter: 44 x 36-8 Rectangular sedimentation basins

6 Water Filtration Types of Filtration Purpose Process Media

7 Types of Filters Gravity vs Pressure Convetional vs Direct Rapid vs Slow Dayton s Filters: Gravity-Conventional-Rapid

8 Purpose Remove suspended matter Remove turbidity Process Straining Adsorption
9 Filter Components Filter walls Troughs Gullet Media Underdrain Piping

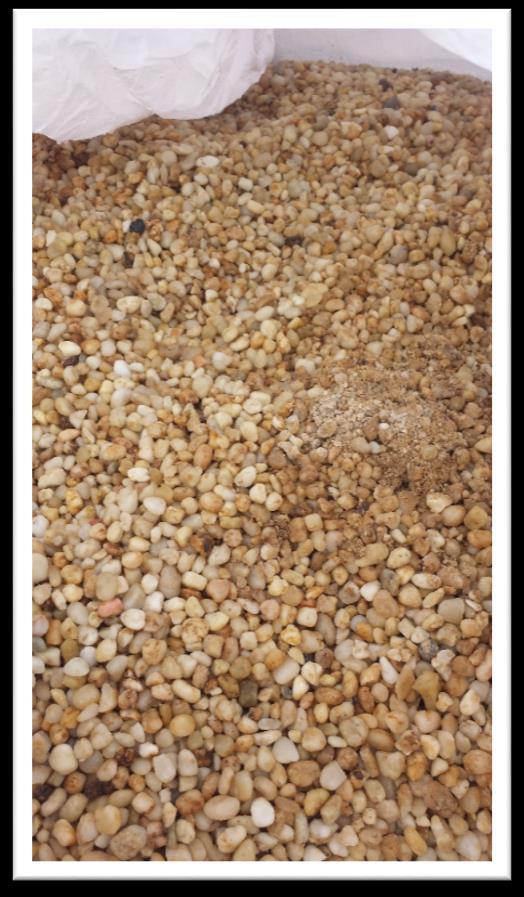
10 Media Sand Gravel Anthracite

 Sand 1/16 x")

11 Miami WTP s Media Comprised of 7 sections of media: mm Filter Sand mm Torpedo (Pilot) Sand 1/16 x 1/8 Gravel 1/8 x ¼ Gravel ¼ x ½ Gravel ½ x ¾ Gravel Clay Tiles Historically: Anthracite


12 Ottawa WTP s Filter Media Comprised of 7 sections of media: mm Filter Sand mm Torpedo (Pilot) Sand 3/32 x 3/16 Gravel 3/16 x ½ Gravel ½ x ¾ Gravel ¾ x 1-1/2 Gravel Clay Tiles
13 Filter Media Quality Gradation Specific Gravity Effective Size Uniformity Coefficient Hardness Acid Solubility


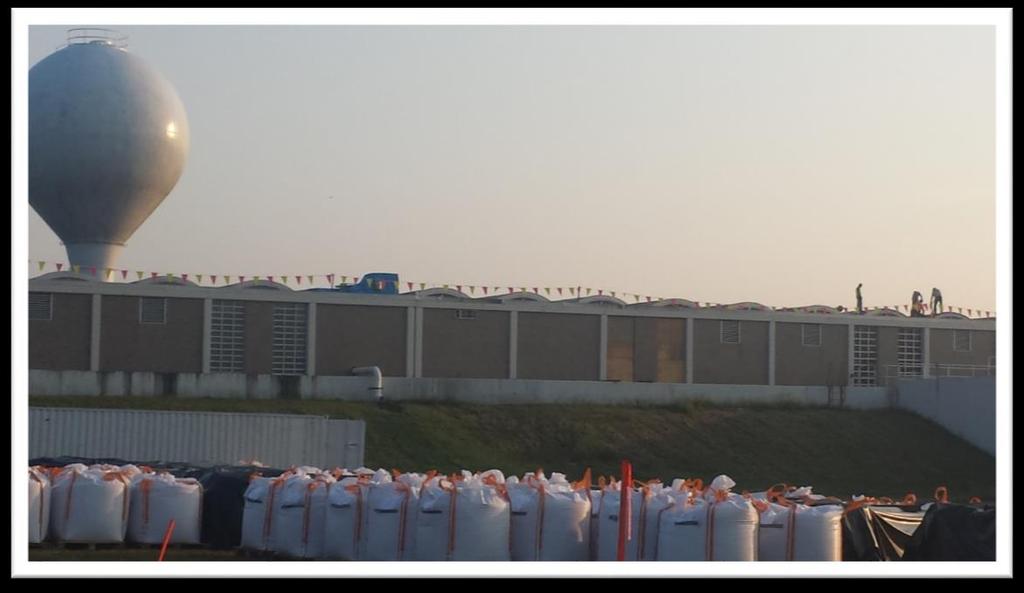
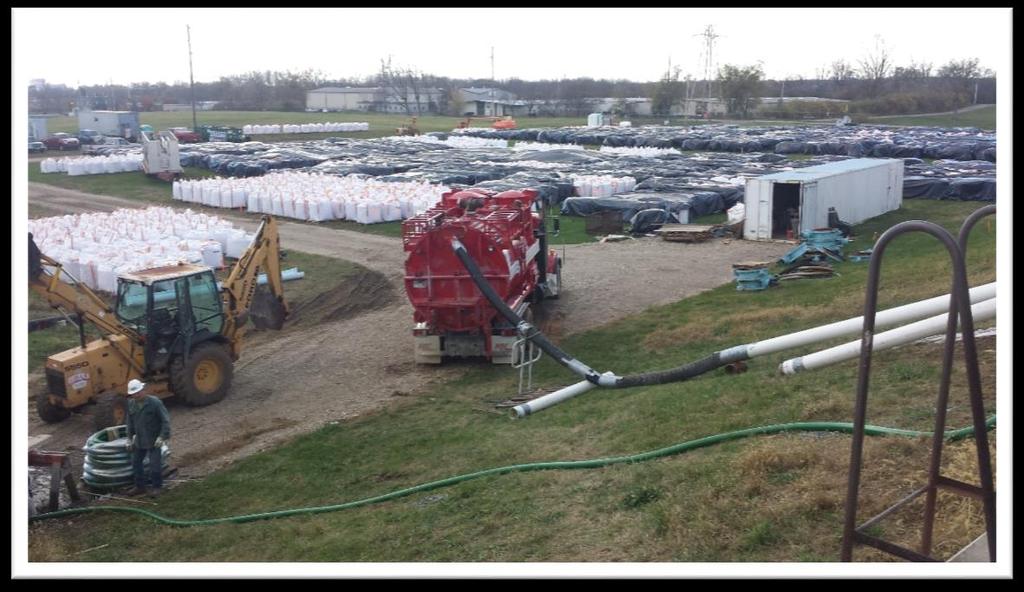
14 Miami WTP Filter Rebuild Clean Repair Replace
15
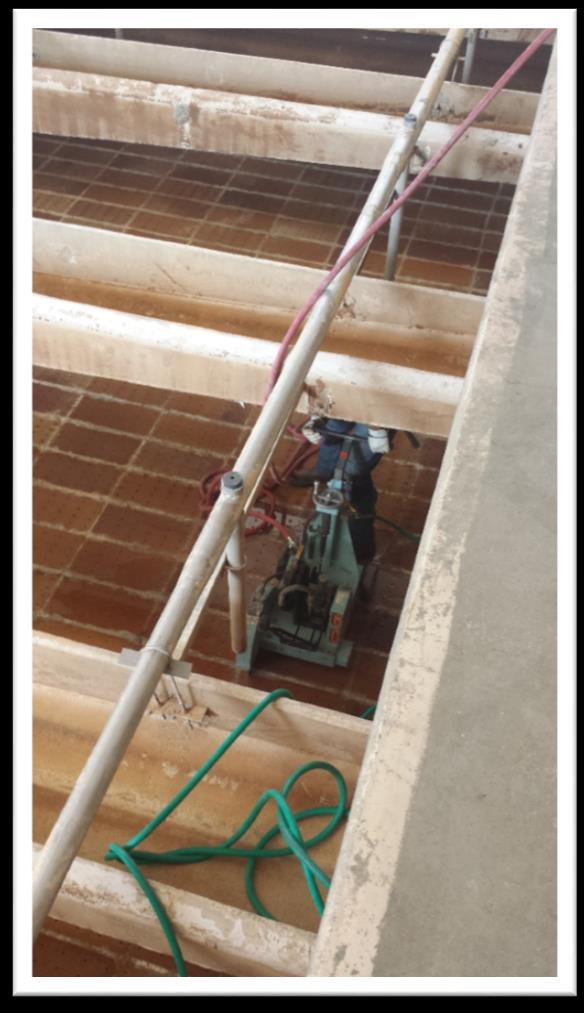
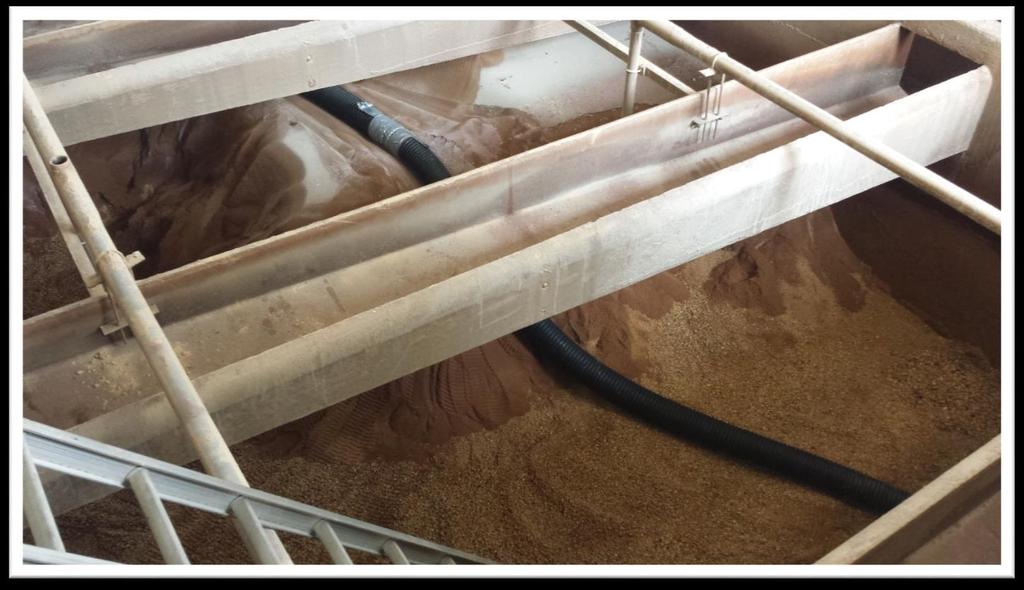
16

17 Filter Maintenance & Upkeep Miami WTP Washed every 40 hours Inline Turbidimeters: Hach 1720E Monthly: photocell cleaned, instrument calibrated Quarterly: lens and Aperture plate cleaned Annually: body cleaned, bulb changed
 Calibrated monthly Less")
18 Filter Maintenance & Upkeep Ottawa WTP Washed every 60 hours Inline Turbidimeters: Hach TU5300 (Laser) Calibrated monthly Less upkeep

19 Filter Wash Purpose Clean filter Reduce Loss of Head Lime Air Binding Prevent Break through Reduce Turbidity

20 Filter Wash Procedure Close Valve Open Drain Drawdown Open wash valve Low wash Surface sweeps High wash Close Drain Refill

21 Filter Wash Facts Wash water usage Wash water tanks Water returned to process
22 IESWTR Filter Profile Method Filter Regulations IESWTR requires: Combined Filter Effluent Turbidity 0.3 & 1 NTU Individual Filter Turbidity Standards- 0.5, 1.0, 2.0 NTU Individual Filter Monitoring Filter profiling Filter Assessment Sanitary Surveys * The IESWTR requires PWS monitor individual filter effluent turbidity at 15 minutes intervals on a continuous basis using on-line turbidimeter. If a filter effluent turbidity is >1.0 NTU two consecutive 15 min. intervals at any time (and there is no obvious reason for the abnormal reading) then the PWS must perform a filter profile. This is a filter event. If a filter effluent turbidity is >0.5 NTU two consecutive 15 min. intervals after the first four hours of service (and there is no obvious reason for the abnormal reading) then the PWS must perform a filter profile. This is a filter event. The filter profile must be completed within seven days following a filter event. A filter profile is done after a backwash cycle. Failure to perform a filter profile within the seven days will result in a monitoring violation and will require public notification. Equipment clean screw capped Nalgene sample bottles Sample bottles are located in the Stock room (and at the water plants). 2. Stopwatch, timer, or watch with a second hand 3. Bench top turbidimeter, Hach 2100AN Method 1. Label each sample bottle. 2. Locate the filter effluent sample tap in the pipe galley. 3. Flush the sample line of any debris for one minute. 4. Collect samples at one-minute intervals for the first 15 minutes. 5. Next collect samples at five-minute intervals for the next 30 minutes. 6. Finally collect samples at 10-minute intervals for the next 20 minutes. 7. Read the turbidity of each sample on a bench top turbidimeter and record the result. 8. Finally plot the filter effluent turbidity as NTU versus time.

23 City of Dayton Filter Turbidity Meter failures & Grab Sample Data PWS # Filter Regulations (cont.) IESWTR Turbidity analyzer fail- grab samples Individual filter effluent <0.5 NTU for consecutive measurements during first four hours Filter effluent <1 NTU for consecutive measurements during operation >0.5 NTU requires Filter Profiling To be used for recording turbidity data every 4 hours when there is a failure in continuous filter turbidity monitoring. Grab sampling can only be performed for up to 5 days. After that, the filter must be removed from service until the turbidity meter is repaired. Water Plant STU # Filter # Date/Time meter was out of service & back in service TIME Filter No. Filter No. Filter No. Filter No. MGD NTU MGD NTU MGD NTU MGD NTU Filter # Date/Time meter was out of service & back in service Filter No. Filter No. Filter No. Filter No. TIME MGD NTU MGD NTU MGD NTU MGD NTU Operator Name Operator Name

24 IESWTR Filter Preventative Measures Minimize fluctuations in flow Backwashes Feeding properly settled water from basins Maintain proper ph Open valves slowly Maintain good equipment

25 Let s start the profile!!!

26 Filter Profile Pre-wash Core Samples Backwash Filter Sand Expansion (Stick of Cups) Filter Wash Turbidity Post-Wash Core Samples Sand Depth Acid Solubility Mechanical Analysis Microbiological Profile

27 Filter Backwashing Effective Backwashing depends upon: Backwash rate Filter wash length


28 Core Samples Examines the layers of media for: Floc Retention Profile Tests preformed on samples: Turbidity
29 Core Samples Floc Retention analyzed using turbidity. Floc retention Specifications: Pre-wash: Less than 150 NTU/100 grams below the midpoint depth in a filter. Post-wash: About 30 NTU/100 grams to 60 NTU/100 grams
30 Core Samples - Before Wash Miami #10 East Bay 1/25/2018 Floc Retention Before Backwash Sand Depth NTU/100 Grams 0-2" " " " " 96 Miami #6 - West Bay 2/1/2018 Floc Retention Before Backwash Sand Depth NTU/100 Grams 0-2" 2, " " " " 51
31 Core Samples After Wash Miami #10 East Bay 1/25/2018 Floc Retention After Backwash Sand Depth NTU/100 Grams 0-2" " " " " 69 Miami #6 West Bay 2/1/2018 Floc Retention After Backwash Sand Depth NTU/100 Grams 0-2" " " " " 30


32 Sand Expansion (Stick of Cups) Examine the media expansion during a filter wash. Goal: 30% percent bed expansion < 30%: abundance of floc, shorter run times, breakthrough > 30%: media loss, uses excess amounts of washwater, strips away solids
33 Sand Expansion (Stick of Cups) Cup # Miami #3, 2/8/2018 Height (inches) Grams of Material % Material Rising % % % % % % % % % % % % Total


34 Filter Wash Turbidity AWWA recommends that the backwash cycle be stopped once the washwater turbidity falls below 10 NTU
35 Filter Wash Turbidity Turbidity falls under 10 NTU by minutes. Miami #6, 2/1/2018 Sample # Time (Minutes) Turbidity (NTU)

36 Mechanical Analysis Analysis the sand size in the different depths of the filter bed. Specifications for Miami WTP: Effective Size: mm Uniformity Coefficient: <1.50

37 Mechanical Analysis Miami # 2 1/18/2018 Sieve Number Sieve Size (mm) East Bay West Bay Retained % Passing Retained % Passing East Bay Effective Size (mm) Uniformity Coefficient 1.26 West Bay Effective Size (mm) Uniformity Coefficient 1.24 Pan Total

38 Acid Solubility AWWA Specification: Acid solubility of 5% per year or less. Too much deposition: alter the ES and UC of the media rendering it ineffective for removing turbidity.
39 Acid Solubility


40 Sand Depth Analyze sand depths after the filter wash. Original Specifications: Depth of 24 of sand

41 Sand Depths West Bay Back East Bay West Bay Sand Depths Minimum Sand Depth 28.5 inches Maximum Sand Depth 34 inches Average Sand Depth inches East Bay Sand Depths Minimum Sand Depth 28.5 inches Maximum Sand Depth 33 inches Average Sand Depth inches Front

 Luminultra")
42 Microbiological Profile Turbidity HPC (Heterotrophic Plate Count) Luminultra Membrane Filter Method
 Luminultra")

43 Heterotrophic Plate Count (HPC) Luminultra Method Measures ATP Indicator of living microorganisms
 Membrane Filter Method")

44 Heterotrophic Plate Count (HPC) Membrane Filter Method Plated on R2A media Incubated for 48 hours at 35.0 ⁰C ± 0.5 ⁰C
45