Indian Institute of Technology Gandhinagar, India DPF
|
|
|
- Caren Matthews
- 5 years ago
- Views:
Transcription


1 Indian Institute of Technology Gandhinagar, India Integration of Distributed S olar PV Generations into S econdary Distribution Grid Dr. N M Pindoriya Assistant Professor Electrical Engineering IIT Gandhinagar, Gujarat naran@iitgn.ac.in Cable Modeling Load Modeling Load Pattern SPV Data Loggers Data DPF Intermittent SPVs Compensation Load variation Unbalancing Voltage/Current Profile Losses Energy statistics SPV Impact Results


2 Electricity Market Operation in India NHPC NTPC NPCIL DISCOMS IPPs Open access CPPs Reliance TATA consumers Adani DISCOMs DISCOMS Traders Retails/large consumers CPPs Open access consumers State Gens. Long Term Market Medium Term Market Bilateral Transaction Short Term Open Access Collective Transaction Day Ahead Transaction Contingency Transaction Yr 3months -3 Years 3 month ahead Day Ahead ahead After Clearance of PX On the day of operation System DISC operation Injections/drawals adjustment OMS Balancing Market ( UI ) ( Real Time Operation ) 1
3 Motivation: ABT Capacity Charges Fixed costs comprising of interest on loan and working capital, return on equity, O&M expenses, insurance, taxes and depreciation Dependent on the availability of the plant Variable Charges Energy charge charged as per the fuel consumption Dependent on the schedule of the day and not on the actual generation Charges of Deviation (COD) Payment for deviations from schedule Dependent on system frequency Generators declare capability Distributors submit requisition Participants can revise schedules New schedule comes into application 1: am 11: am 3: pm 5: pm 1: pm 11: pm 12: am RLDCs communicate RLDCs prepare RLDCs issue respective shares to schedules final schedules the distributors 2
4 Motivation: UI/Charges of Deviation Known as Unscheduled Interchange (UI) Charges till 17 th Feb 214 Varies inversely with system frequency No over drawl is allowed Rs / KWh i.e. 1% additional charge of Freq 49.7 Hz Frequency range Rate in Rs per KWh Under drawl / over injection 1.78 per KWh 3


5 Power Scenario in India All India Power Installed Capacity (as on 31 st July 214) Nuclear; 478; 2% Hydro; 4799; 16% Waste to Power, 17, % Solar Power, 2753, 9% Bio Power, 446, 12% Thermal; ; 69% RES; 32424; 13% Small Hydro Power, 3826, 12% Wind Power, 21693, 67%


6 Power from Renewable Energy Sources RE based power generation : ~ 2% growth in last 5 years Wind energy (21,132 MW) continues to dominate - 67 % of total RE Solar power : 2,647 MW As on 31 st March 214


7 Wind and Solar Energy Sources Projection: ~ 5 GW at 2% land availability Goal of 2 GW by 222
8 Cumulative capacity (MW) Cumulative Capacity Addition of Solar Power NSM Phase I, Batch 1, Projects under Gujarat Solar Policy NSM Phase I, Batch 2, Solar REC based Projects (up to 23rd April 214) Installed Sr. States Capacity No. (MW) 1 Andhra Pradesh Arunachal Pradesh.25 3 Chhattisgarh Delhi Goa & UT Gujarat Haryana Jharkhand 16 9 Karnataka 31 1 Kerela Madhya Pradesh Maharashtra Odisha Punjab Rajasthan Tamil Nadu Uttarakhand Uttar Pradesh West Bengal 7.5 Total
9 Promoting the adoption of RE resources by encouraging private sector investment and mandating the use of RE generation Ample opportunities for the establishment of landbased RE generation as well as for offshore wind farms Government support Vast untapped potential Energy security concerns Key drivers of renewable energy in India India ranks 4 th and 6 th globally as the largest importer of oil, and of petroleum products and LNG, respectively. The increased use of indigenous renewable resources is expected to reduce India s dependence on expensive imported fossil fuels. Climate change Increasing cost competitive ness of RE technology NAPCC promoting the understanding, adaption and mitigation of climate change, energy efficiency and resource conservation Distributed electricity demand RE is distributed and scalable resource, making it well suited to meet the need for power in remote areas, which lack grid and road infrastructure
10 Power Distribution Network of IITGN-VGEC Campus 1 kw Multi-crystalline PV plant, 25 kva x 4 inverters, ABB 1 kw Multi-crystalline Installed by GEDA, Gandhinagar 1 kw Thinfilm Installed by NTT Facilities, Inc., Japan


 PV module Manufacturer Type")
 Installation conditions Inclined angle : 25")
")
11 1 kw p Solar PV (Thin-film, CIS) System Pyranometer and Irradiance sensors with module temperature sensor Pyranometer Ambient temperature sensor Installed by NTT Facilities, Inc., Japan Total 64 PV modules (Thin-film, CIS) Thermocouple PV Inverter (REFUsol 1K) PV module Manufacturer Type Nominal value ( Installation conditions Inclined angle : 25 Orientation : South : Solar Frontier, Japan : CIS (SF15-L) : 15 W p Inverter & Data logger Data logger (Solar-Log 2) V, 1.9 A Installed in January 212 String junction box with surge protection 11

12 Electricity Generation (kwh) Capacity Factor (%) 1 kw p Solar PV (Thin-film, CIS) System Solar PV system performance from January to May & June to December in Energy (kwh) CUF
13 7:: 8:: 9:: 1:: 11:: 12:: 13:: 14:: 15:: 16:: 17:: 18:: PV Output Power (W) (AC) Ambient Temperature (C), Module Temperature (C) 7:: 8:: 9:: 1:: 11:: 12:: 13:: 14:: 15:: 16:: 17:: 18:: PV Outut Power (W) (AC) Ambient Tmp (C), Module Tmp (C) 1 kw p Solar PV (Thin-film, CIS) System th Feb 213 PV Power 7 6 Solar PV Profile over a day 7 Module Temperature Time rd March 214 Ambient Temperature Solar Irradiance (W/m2) PV Power Module Temperature Date Time Pac (W) Energy (Wh) Pdc (W) Vdc (V) Vac (Vph) SolIrr (W/m2) Tmp Mod Tmp Amb DaySumIrr (Wh/m2) :35: :3: :25: :2: :15: :1: :5: :: :55: :5: :45: :4: :35: :3: :25: :2: :15: :1: Ambient Temperature Solar Irradiance (W/m2) 1 Time
14 :: 8:: 9:: 1:: 11:: 12:: 13:: 14:: 15:: 16:: 17:: 18:: PV Outut Power (W) (AC) Ambient Temperature (C), Module Temperature (C) 1 kw p Solar PV (Thin-film, CIS) System th May 214 Module Temperature PV Power Ambient Temperature Statistical (Average) performance (so far in 214) 2 1 Solar Irradiance 1 Energy: 54 kwh/day Sun Energy: 5.5 kwh/m 2 /day Time CUF: Energy (kwh) CUF Sun Energy kwh/m Sun Energy (kwh/m2)
15 Generation (kwh) 1 kw p Solar PV (Thin-film, CIS) System Rain started in June month in 213 whereas it was started in July in Jan Feb Mar Apr May Jun Jul Aug Sep Oct Nov Dec It has been observed that winter season is most favorable weather condition for solar PV power generation Energy generation in March month is the highest across the year The performance in rainy season (July-Sept) is so much intermittent which essentially drops the total power generation in this season
 System")
 PV module Manufacturer Type")

 Installed in February 212 Anemometer (Madgetech, 11A) P max V mpp I")
16 PV Inverter (REFUsol 1K) Pyranometer and Irradiance sensors with module temperature sensor 1 kw p Solar PV (Multicrystalline Silicon) System Installed by Gujarat Energy Development Agency (GEDA), Gandhinagar Total 44 PV modules (Multicrystalline Silicon) PV module Manufacturer Type Nominal value Installation conditions Inclined angle : 21 Orientation : South : Jain Photovoltaic : JJ M66 : 23 W p ( els%2-%21%2to%223%2watt.htm) Installed in February 212 Anemometer (Madgetech, 11A) P max V mpp I mpp 23 W p 3.26 V 7.55 A V oc I sc 8.15


17 Electricity Generation (kwh) Capacity Factor (%) 1 kw p Solar PV (Multicrystalline Silicon) Rooftop System Solar PV system performance from May to December in Maintenance for first 2 days & then mal operation of Inverter (Total 8 days) Energy (kwh) CUF /1/212 : 6/1/212 : 7/1/212 : 8/1/212 : 9/1/212 : 1/1/212 : 11/1/212 : 12/1/212 : Operational failure sometimes happened because of unstable distribution grid conditions
18 Generation (kwh) 1 kw p Solar PV (Multicrystalline Silicon) System Jan Feb March April May June July Aug Sept Oct Nov Dec Energy generation in March month is the highest across the year The performance in rainy season (July-Sept) is so much intermittent which essentially drops the total power generation in this season
19 Steady state operational analysis SOLAR PV INTEGRATION Anti-islanding protection and risk assessment Impact investigation

, Berlin,")
20 The Impact Investigation Exercise Cable Modeling Load Modeling Load Pattern SPV Data Loggers Data DPF Intermittent SPVs Compensation Load variation Unbalancing Voltage/Current Profile Losses Energy statistics SPV Impact Results Node Lighting Loads Air Conditioners Single Phase Motors Electronic Loads 3 4% 82% 9% 5% 7 5% 86% 6% 3% 9 6% 78% 4% 11% 13 12% 65% 1% 13% 14 25% 57% 8% 1% 15 8% 72% 7% 12% 17 5% 88% 6% 1% 18 9% 78% 8% 5% 2 6% 74% 5% 15% 21 25% 54% 11% 1% Kalpesh Joshi and N.M. Pindoriya, Impact Investigation of Rooftop Solar PV System: A Case Study in India, 212 3rd IEEE PES Innovative Smart Grid Technologies Europe (ISGT Europe), Berlin, October 14-17, 212, pp. 1-8.


21 Seasonal performance The Impact Investigation Exercise Case 1 Base case study Balance load, without capacitor compensation and solar PV generation Case 2 With capacitor compensation Balance load, without solar PV generation Case 3 With solar PV generation Balance load, without capacitor compensation Case 4 With capacitor compensation & solar PV generation Balance load Case 5 Unbalance load With capacitor compensation & solar PV generation kw 15 kw Winter peak Summer peak Winter off-peak 28 kw Summer off-peak Winter off-peak Summer off-peak Winter peak Summer peak 45 kw Source Current Profile in pu Case 1 Case 2 Case 3 case 4 -.4
22 The Impact Investigation Exercise


23 Technical issues in solar PV integration with utility distribution grid Power Quality Voltage Flicker Protection Islanding protection Waveform Distortion Nuisance Tripping THD Reconnect after disturbance Frequency and Power Factor Correction Grounding IEEE Recommended Practice for Utility Interface of PV systems, IEEE Standard 929-2

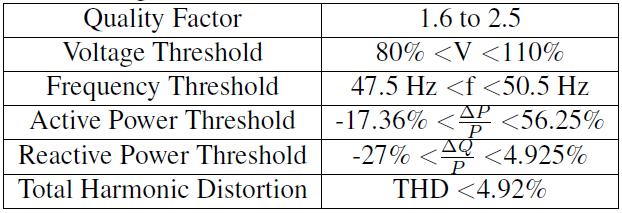
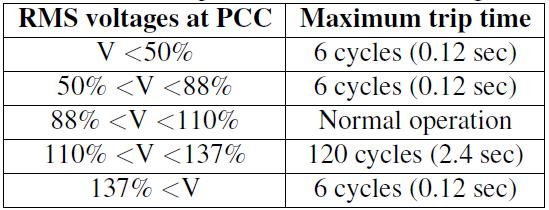
24 Power Quality Constraints Islanding Condition

 for")
25 Risk Assessment of Unintentional Islanding Exercise What is Unintentional Islanding??? Winter - Nonworking days Process of elimination and identification of probable scenarios for unintended islanding Allowable mismatch in powers Power balance check with DPF Permissible deviations in V & f Time of Day Offpeak - Nonworking days Most Probable Days and Time of Day (ToD) for formation of island Time of Day
26 Goals for successful grid integration Detection of islanding and disconnection of the PV system from the utility, regardless of the initial state of the system, perturbations, composition of the load Detection of islanding which is sufficiently fast to guarantee safety and safeguard the reliability and integrity of the utility and PV systems Disconnection of the PV system only when islanding is actually occurring (no nuisance trips)
27 Anti-Islanding Protection P > Under voltage relay P < Over voltage relay Q > Over frequency relay Q < Under frequency relay Non-detection Zone
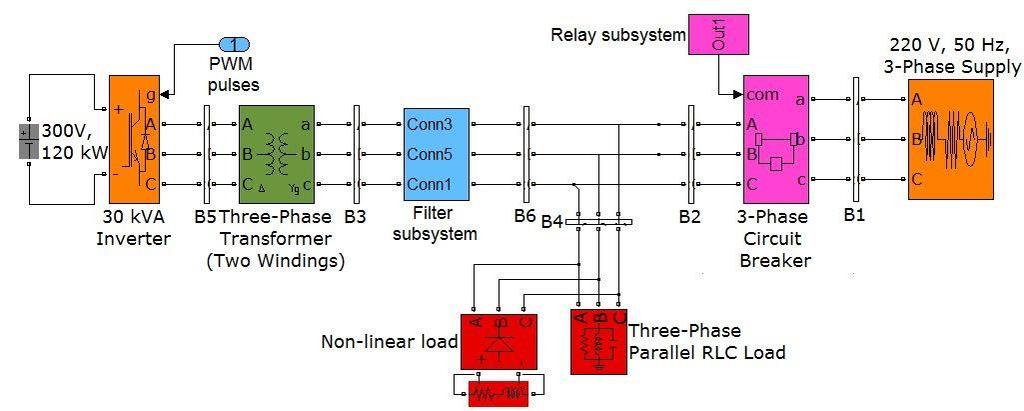
28 Anti-Islanding Protection
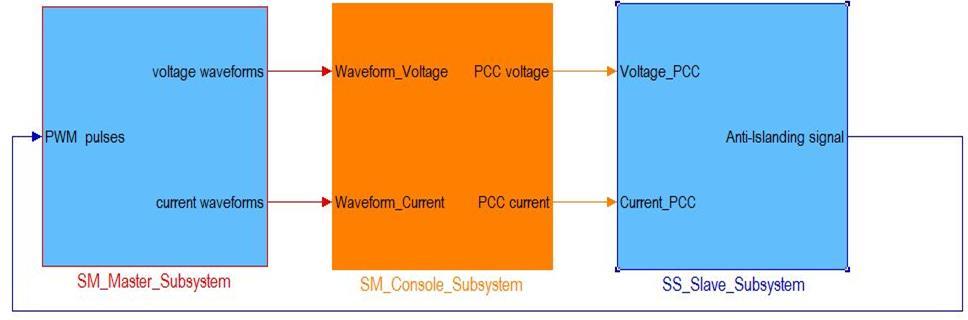
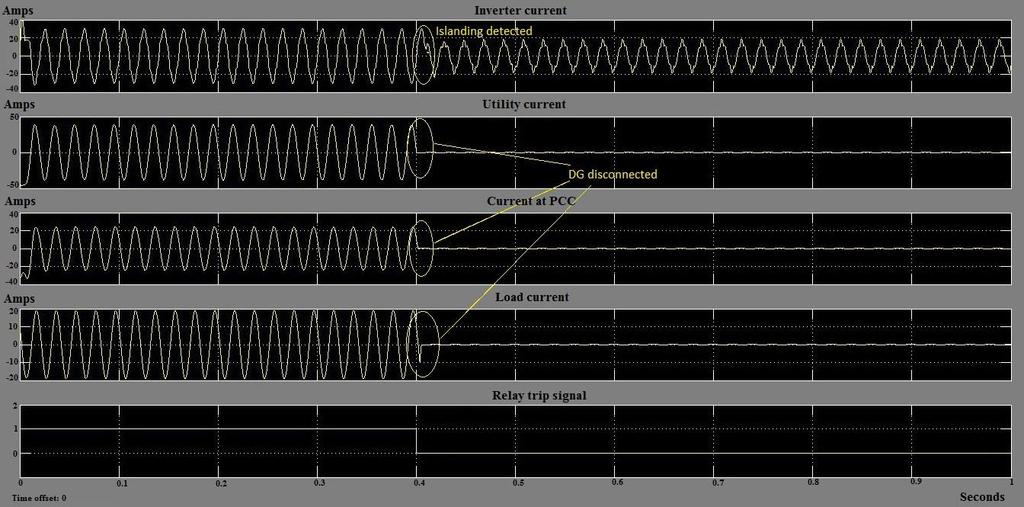
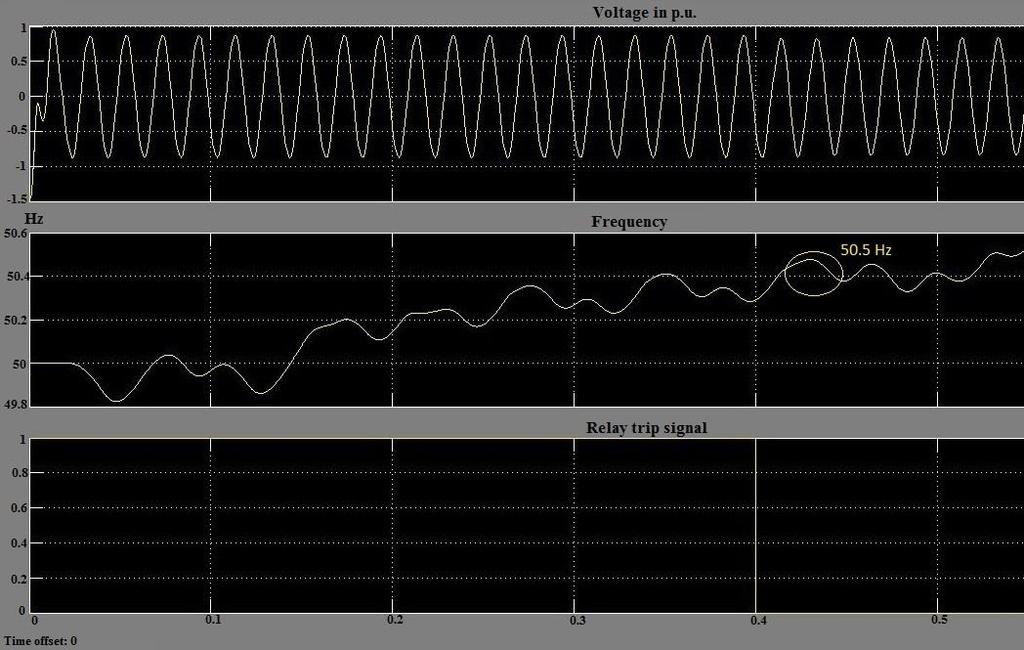
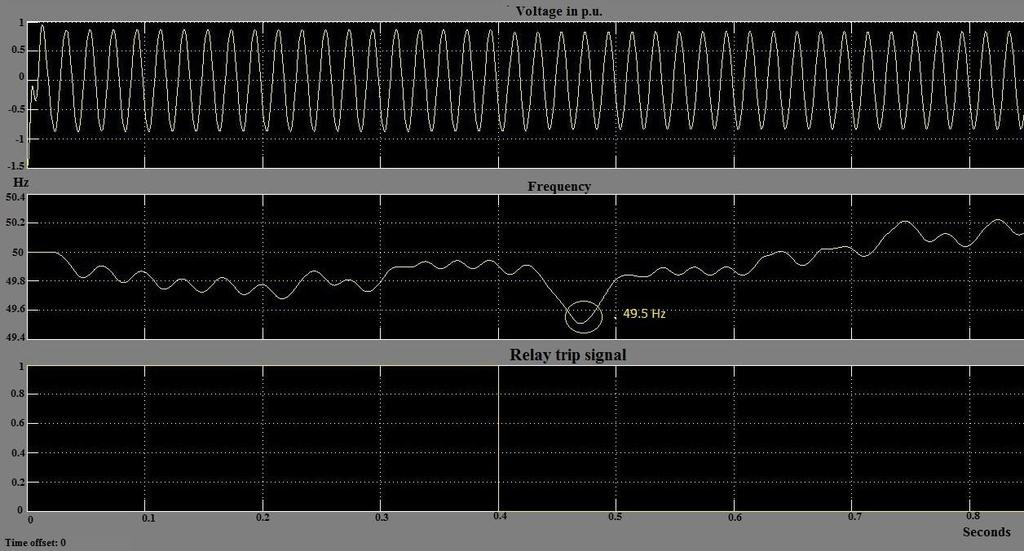
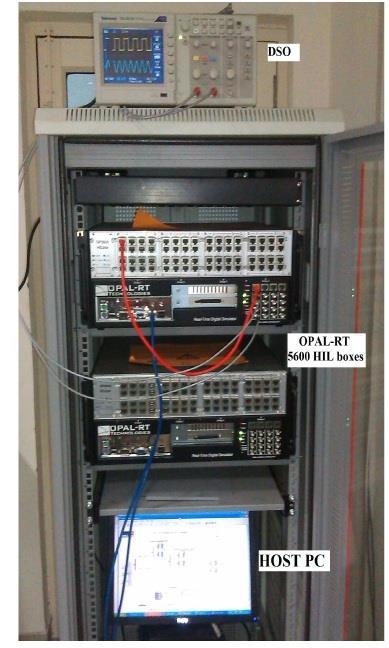
29 Anti-Islanding Protection Real time digital simulation


30 An underground cable-fed actual spot network in India with 3 roof-top PV plants 21 Node Network, 4 V, small & spot network

31 (IITGN-VGEC) Daily peak demand with and without PV generation maximum reduction in peak demand occurs in the months of February and March. However, the year-round net reduction in peak demand is found to be kw.
32 Demand (kw or kvar) Power factor (IITGN-VGEC) average power factor consistently stays below.9 (lagging) during the months of February, March and partly April in the year The drop in average power factor is shown expanded for a typical day (February 27, 212) The real power demand sinks during sunshine hours due to real power injection from RPVs. Inverters of all RPVs are set to operate at unity power factor Time of Day (Hour).4.2 Demand W/o PV Net Demand Reactive Power PF


 at")
33 Renewable Energy Trading Cost of electricity through RE generation Cost equivalent to conventional resources Cost for GREEN Attributes Unbundling of REC from electrical energy REC Option Solar PV Solar Thermal Wind Rs/kWh for first 12 years 3-5 Rs/kWh for next 13 years 9-11 Rs/kWh for first 12 years 3-4 Rs/kWh for next 13 years 3-5 Rs/kWh Feed-in-Tariff (FiT) Electricity Green attributes Electricity sale at market price Sale of electricity to obligated entities at price average price REC (Solar and non-solar) Sale of REC at PXs Sale of electricity to obligated entities (DISCOMs, CPPs, OA consumers) at preferential tariff

34 Operational Framework for REC Source: MNRE

 Forbearance Price")
35 No. of REC (Non-solar) traded MCP (Rs/REC) Non-solar REC Trading 7, 6, , Floor price 15 4, 15 3, 1 2, 1, 5 Non-Solar REC (Rs/REC) Forbearance Price Floor Price 33 15
 Forbearance Price Floor Price 13,4")
36 No. of REC (Solar) traded MCP (Rs/REC) Solar REC Trading 12 1 MCV@PXIL MCV@IEX MCP@IEX MCP@PXIL Floor price Solar REC (Rs/REC) Forbearance Price Floor Price 13,4 93

37 Thank You!