Drought Early Warning for the Apalachicola- Chattahoochee-Flint River Basin 30 May 2017
|
|
|
- Kimberly Palmer
- 5 years ago
- Views:
Transcription
1 National Integrated Drought Information System Drought Early Warning for the Apalachicola- Chattahoochee-Flint River Basin 30 May 2017 If you are new to the webinar: For audio: Dial in: Enter code: then # Please put your phone on mute to avoid interfering with presenters We welcome comments, questions and discussion at the end of the webinar Welcome to the webinar!
2 National Integrated Drought Information System Drought Early Warning for the Apalachicola- Chattahoochee-Flint River Basin 30 May 2017
3 Outline Welcome Eric Reutebuch, AU Water Resources Center Current drought status, seasonal forecasts & outlooks David Zierden, Florida Climate Center, FSU Streamflows and groundwater Paul Ankcorn, USGS Streamflow forecasts Todd Hamill, SERFC GriDSSAT Crop Model Update Cameron Handyside, Earth System Science Center, UAH Alabama Drought Declaration Tom Littlepage, AL Office of Water Resources ACF reservoir conditions Cynthia Donald, United States Army Corps of Engineers Summary and Discussion


4 Current drought status Only 4.52% of the U.S. currently in drought (D1 or greater)


5 Keetch Byram Drought Index

6 Rainfall Last 14 Days

7 Rainfall Last 5 days

8 Rainfall Deficits Last 90 Days

9 7-Day Precipitation Forecast


10 Neutral Conditions Nino 3.4 Index hovering around the threshold

11 El Nino Forecast Neutral and El Nino now equally likely through remainder of 2017 Less than 50% chance of El Nino Large spread in the prediction models Lack of recent westerly wind episodes or subsurface anomalies

12
13 Official NOAA 3-Month Outlook Precipitation Temperature

14 South Florida Temperature Forecast

15 Precipitation Climatology May June
16
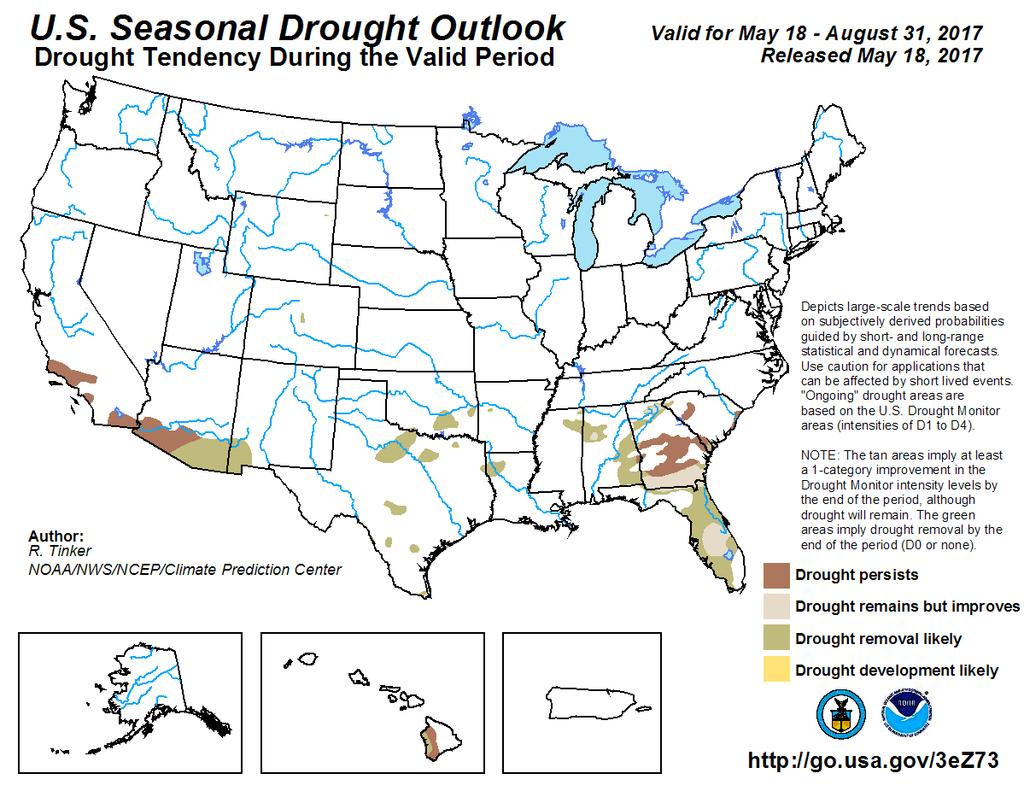
17 Take Home Messages Drought improves in the ACF basin, only 23% in D1 or greater Active wildfire season continues in Central Florida 3 to 6 inches of rainfall over the upper and middle ACF basin in the past two weeks There is now a rainfall surplus over the upper and middle ACF basin at 90 days, lower ACF still running a deficit 7-day forecast favors 2-3 inches over the upper ACF, lesser amounts for the middle and lower basin. Neutral Conditions persist in the tropical Pacific, hovering near the +0.5 C threshold. Neutral now equally likely, El Nino chances drop to under 50% NOAA seasonal forecast favors warm spring/summer and equal chances for rainfall Florida s rainy season has begun by some measures
18 Streamflows and Groundwater Paul Ankcorn

19 Realtime stream flow compared with historical monthly averages Previous Brief: Current:
20 Below Normal 7-day Average Streamflows Previous brief: Below normal 7-day average streamflow as compared with historical streamflow for day shown Current:

21 Lake Lanier Inflows Chattahoochee near Cornelia ( ) Chestatee near Dahlonega ( )

22 Current Streamflows Chattahoochee at Atlanta ( ) Chattahoochee near Whitesburg ( )
 Current Streamflows")

23 Chattahoochee at West Point ( ) Current Streamflows Chattahoochee at Columbus( )
")

24 Current Streamflows Flint River near Griffin ( ) Flint River near Carsonville ( )
")

25 Current Streamflows Flint River at Albany ( ) Flint at Bainbridge ( )
 http://waterwatch.")
26 Current Streamflows Apalachicola at Chattahoochee ( )

27 Groundwater Conditions Previous brief Current brief

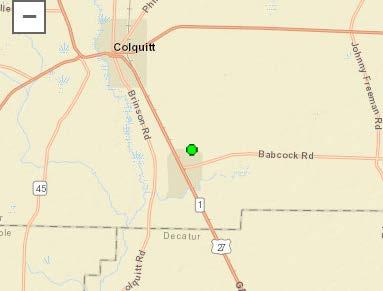
28 Groundwater Status Miller County 08G001 (Upper Floridan Aquifer)


29 Groundwater Status Dougherty County 11K003 (Upper Floridan Aquifer)
30 Summary-USGS Real-time streamflows in the ACF basin range from much above normal to much below normal. 28-day average streamflow at Chattahoochee River at Cornelia, and Chestatee River at Dahlonega are currently at the below normal range. 28-day average streamflows for the Chattahoochee River below Lake Lanier are in the below normal, to much below normal range. 28-day average streamflows for the Flint River currently range from normal, to below normal range. Groundwater levels range from low to normal across the ACF Basin.

31 Todd Hamill


32 1-Month Mean Daily Streamflow Forecasts Apalachicola Watershed Southeast River Forecast Center Lake Lanier Inflows Whitesburg Lovejoy Above Normal Near Normal Below Normal West Point Columbus Carsonville WF George Albany Columbus Woodruff Blountstown

33
34 Summary-SERFC 1 Month Streamflow forecast - Slightly Below Normal Chattahoochee and Apalachicola, Near Normal Flint 3 Month Streamflow forecast Slightly Below Normal Chattahoochee and Apalachicola, Near Normal Flint Pie Charts do not directly include any adjustments to the ESP forecast based on ENSO, CPC or other. Based on soil conditions relative to normal in concert with historical precipitation.
35 GriDSSAT Crop Model Update for the ACF University of Alabama in Huntsville Earth System Science Center Cameron Handyside
36 1-Day (May 26 th ) Stress map shows no short-term crop stress across the ACF

37 7-Day Cumulative Stress maps shows reduced long-term crop stress across the ACF
38 30-Day Cumulative Stress results shows continued (but reduced) stress in the mid to lower ACF
39 Summary - UAH Significant rain across the ACF region has reduced the short-term stress significantly Mid-term stress is also reduced by the recent rainfall. Long-term stress is still significant.


40 Alabama: NIDIS ACF DEWS Input Tom Littlepage Alabama Office of Water Resources

41 41
42 Alabama Drought Status Record setting drought condition of last fall have been largely eliminated due to sustained and above average rainfall including record setting May events Some streamflows are below normal levels Monitoring groundwater levels to assess recharge impacts All reservoir levels at normal levels (except Lanier) Most significant remaining impacts are to agricultural sector forest pine beetle infestation and cover crop/hay planting (minimal in ACF)

")
43 Alabama Drought Monitor Percentages (Jan 2000 May 2017) (Top Chart D2)

44 Current Alabama Drought Declaration May 24, : 10 Declarations issued 2017: 6 Declarations issued to date 44
45 Next Alabama Monitoring and Impact Group (MIG) Meeting: June 20, 1 pm CST

46 Cynthia Donald

47

48

49
50

51
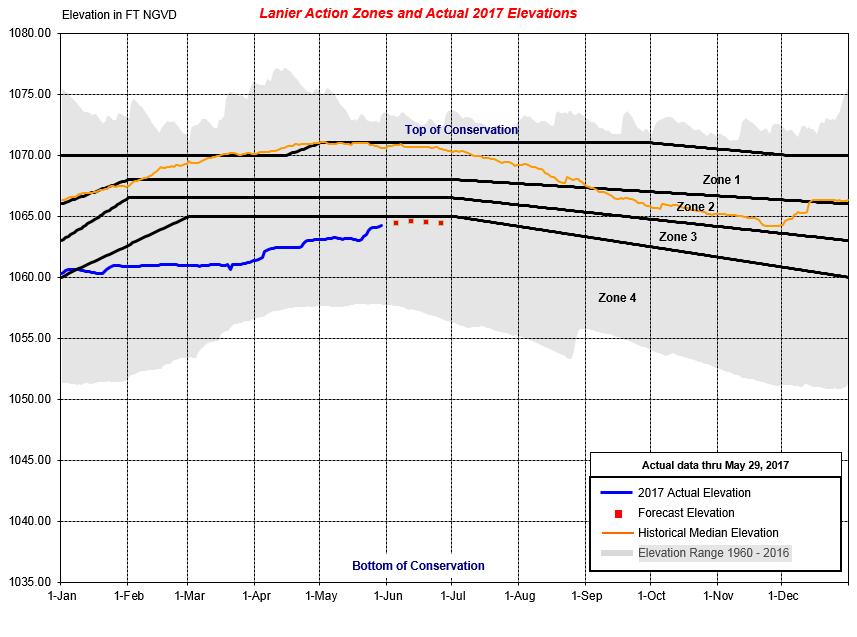
52 Summary-ACE West Point and Walter F. George are above guide curve. Buford still remains in Zone 4 and is forecasted to rise slightly over the next few weeks. Continuing to meet downstream minimum flow requirements. The ACF system conservation storage is in Zone 1 and is forecasted to remain there over the next few weeks.
53 Questions, Comments, Discussion
54 References Speakers David Zierden, FSU Paul Ankcorn, USGS Todd Hamill, SERFC Cameron Handyside, UAH Tom Littlepage, AL OWR Cynthia Donald, US ACE Moderator Eric Reutebuch, AU WRC Additional information General drought information General climate and El Niño information Streamflow monitoring & forecasting Groundwater monitoring

55 Thank you! Next briefing Tuesday, June 13, 2017, 1:00 pm EDT Moderator: Eric Reutebuch Slides from this briefing will be posted at Please send comments and suggestions to: