Table Criteria of EIA for Port Development Project
|
|
|
- Stephany Horn
- 5 years ago
- Views:
Transcription
1 23. INITIAL ENVIRONMENTAL EXAMINATION (IEE) 23.1 General (1) Objectives of Initial Environmental Examination Initial Environmental Examination (IEE) has the following two objectives: 1) To evaluate whether Environmental Impact Assessment (EIA) is necessary for the project and, if so, to define its scope. 2) To examine, from an environmental viewpoint, measures to mitigate the impact of the project which requires environmental consideration but not a full-scale Environmental Impact Assessment. (2) EIA Criteria of port development project in Indonesia EIA is required for a development projects larger than a certain scale by the environmental laws of Indonesia and the method and regulations are stipulated in EIA Guideline of Indonesia (1999) shown in Table Table Criteria of EIA for Port Development Project Project type Project description Criteria of development project requires EIA Berthing facility Facility more than 200m in length or 6,000m 2 in area Port development Breakwater More than length 200m in length project Development are More than 5 ha in area Mooring buoy More than 10,000DWT Dredging Initial dredging Dredged soil volume more than 250,000m 3 Maintenance dredging Dredged soil volume more than 500,000m 3 Reclamation More than 25 ha in area or soil volume 500,000m 3 * Soil dumping Dumped soil volume more than 250,000m 3 Source: Revised Environmental Impact Assessment Procedure in Indonesia (3) Method of IEE The IEE procedure has two steps as follows: 1) Screening: To evaluate whether it is necessary to include the environmental consideration in a development project or not. 2) Scoping: To identify the important environmental impacts by the implementation of a development project, and to define the survey items for EIA based on the findings Components of the Development Plan Main components of the development plan are shown in Table for Talang Duku Terminal and Table for Muara Sabak Terminal. 23-1
2 Table Development plan for Talang Duku Facility Dimension Environmental aspect Berths 2 pontoons: 125 m Total length of 2 pontoons 250m is longer than the EIA criteria, 200m. Container terminal Total Terminal area Ground slots CFS General cargo terminal Shed Open storage Container handling equipment capacity 3 ha 540 TEU 1,600 m 2 1,350 m 2 2,500 m 2 80,000 TEU/year Smaller scale than the criteria 5ha Berths Table Development plan for Muara Sabak Facility Dimension Environmental Aspect Base case High public case 3 x125m/berth, 4 x 125 m/berth, Total length of the berths is Design depth 6 m Design depth 6 m longer than the EIA criteria 200m. Container terminal Total terminal area Ground slots CFS 7.5 ha 753TEU 2,880 m 2 10 ha 1,152 TEU 4,480 m 2 Container handling capacity 128,000TEU/year 224,000TEU/year General cargo berth 1: 125 m General cargo terminal Mobile crane Forklift Shed Open storage Dredging Initial dredging Maintenance dredging Soil dumping Initial dredging Maintenance dredging ,600 m 2 6,600 m 2 5,300,000m 3 1,200,000m 3 /year 5.300,000 m 3 1,200,000 m 3 /year Larger than the EIA criteria scale 5ha in area. Initial and maintenance dredging volumes are more than EIA Criteria. Dumping soil volumes are more than EIA Criteria Examination of the project plan with the EIA criteria showed necessity of EIA for the projects Environmental Scoping of Development Sites Scoping of environmental impact was carried out by using scooping checklist as shown in Tables and
3 Table Environmental Scoping for Development Plan (Talang Duku) No. Environmental Items Evaluation Description Social Environment 1 Resettlement D Land area of both project sites is owned by IPC2. 2 Economic Activities B Positive impact is expected by construction work increase. 3 Traffic/Public Facilities B The number of coal transport trucks may increase with the new coal terminal operation in Talang Duku. 4 Split of Communities D No impact is expected. 5 Cultural Property D No cultural property is seen around the development sites. 6 Water Right and Right Unknown (further examination is needed in next phase) C of Common 7 Public Health Condition D No impact is expected. 8 Waste B Industrial waste generated from the construction work and is expected in the construction phase. 9 Hazards (Risk) D No impact is expected. Natural Environment 10 Topography and No impact is expected. D Geology 11 Soil Erosion D No impact is expected. 12 Groundwater C Unknown (further examination is needed in next phase) 13 Hydrological Situation D No impact is expected. 14 Coastal Zone D No impact is expected. 15 Fauna and Flora B Some impact is expected to aquatic biology during the construction and operational phase. 16 Meteorology D No impact is expected. 17 Landscape D No impact is expected. Pollution 18 Air Pollution B The exhaust gas generated by the vehicles and heavy equipments in the construction and operation phase is expected since the traffic volume may increase by port development. 19 Water Pollution B The water pollution is expected in the construction phase. Decrease of water quality by domestic waste and shipping activities is expected in the operation phase. 20 Soil Contamination B The soil contamination by oil, grease, and other materials is expected in the construction phase. Ship operation activities may generate heavy metals that may accumulate in sediment. 21 Noise and Vibration B The noise and vibration are expected by operation of various construction equipments during the construction phase. Also traffic increase in operation phase may cause traffic noise. 22 Land Subsidence C Unknown (further examination is needed in next phase) 23 Offensive Odor D No impact is expected. Note : Evaluation categories : A: Serious impact is expected. B: Some impact is expected. C: Extent of impact is unknown. (Examination is needed. Impact may become clear as study progress). D: No impact is expected. IEE/EIA is not required. 23-3
4 Table Environmental Scoping for Development Plan (Muara Sabak) No. Environmental Items Evaluation Description Social Environment 1 Resettlement D Land area of both project sites is owned by IPC2. 2 Economic Activities B Positive impact is expected by construction work increase. 3 Traffic/Public Facilities B Road Traffic volume may increase with the new port development in Muara Sabak. 4 Split of Communities D No serious impact is expected. 5 Cultural Property D No cultural property is seen around the development sites. 6 Water Right and Right No serious impact is expected. D of Common 7 Public Health Condition D No serious impact is expected. 8 Waste B Industrial waste generated from the construction work and operation phase is expected in the construction phase. 9 Hazards (Risk) D No serious impact is expected. Natural Environment 10 Topography and No serious impact is expected. D Geology 11 Soil Erosion D No serious impact is expected. 12 Groundwater C Unknown (further examination is needed in next phase) 13 Hydrological Situation D No serious impact is expected. 14 Coastal Zone D No serious impact is expected. 15 Fauna and Flora B Some impact is expected to aquatic biology during the construction and operational phase. 16 Meteorology D No serious impact is expected. 17 Landscape B Tall cargo handling equipments may not be in harmony with the landscape around. Pollution 18 Air Pollution B The exhaust gas generated by the vehicles and heavy equipments in the construction and operation phase is expected since the traffic volume may increase by port development. 19 Water Pollution B Decrease of water quality by domestic waste and shipping activities is expected in the operation phase. 20 Soil Contamination B The soil contamination by oil, grease, and other materials is expected in the construction phase. Ship operation activities may generate heavy metals that may accumulate in sediment. 21 Noise and Vibration B The noise and vibration are expected by operation of various construction equipments during the construction phase. Also traffic increase in operation phase may cause traffic noise. 22 Land Subsidence C Unknown (further examination is needed in next phase) 23 Offensive Odor D No serious impact is expected. Note : Evaluation categories : A: Serious impact is expected. B: Some impact is expected. C: Extent of impact is unknown. (Examination is needed. Impact may become clear as study progress). D: No impact is expected. IEE/EIA is not required. 23-4
5 23.4 Results of the IEE The Environmental Impact Assessment (EIA) is required for the development activities of Talang Duku and Muara Sabak. The reasons for the requirement of EIA are as follows: 1) Total length of the new berths is longer than the EIA criteria 200m. 2) The construction area of Muara Sabak terminal 7.5 ha in base case and 10ha in high public case exceed the EIA requirement criteria of 5 ha. 3) The dredging soil volume (initial dredging volume 5.3 million m 3, maintenance dredging volume 1.2 million m 3 ) in Batanghari river exceeds the EIA requirement criteria (initial dredging volume 0.25 million m 3, maintenance dredging volume 0.5 million m 3 ). Also, dumping soil volumes exceed the EIA criteria. 4) The number of vehicles in traffic volume is anticipated to increase on the access roads of both Talang Duku and Muara Sabak. 5) Water pollution generated from the coal terminal in Talang Duku is anticipated. Soil erosion, air pollution, soil contamination, noise and vibration are expected in construction and operation phases. Regarding Resettlement at Talang Duku and Muara Sabak, since the proposed project sites are owned by IPC2, no negative environmental impact of the resettlement of people is expected. Environmental impacts expected particularly in the construction phase (such as air pollution, water pollution, noise and vibration ) can be handled by adopting proper construction methods. Such environmental conscious work methods are considered not to need additional construction cost. Category B and C items will be further clarified as to their impacts and magnitude in the next stage of the study and survey. The Environmental Management Plan (RKL) and the Environmental Monitoring Plan (RPL) will be formulated as one of the procedures of Environmental Impact Assessment (EIA). The appropriate environmental management, implementation of continuous observation and monitoring of the environmental change will be recommended by RKL and RPL (refer to Supporting Report: Parts I and J). 23-5
6 23.5 Environmental Consideration for the Development Sites Environmental conservation for the river basin of Batanghari Jambi Province has developed along Batanghari River. By 1932, people were settled along most of the river and its tributaries. The large coastal and freshwater swamp areas around Muara Sabak, Kuala Tungkal, and right side of Batanghari river mouth were developed during the 15 years from 1982 to Forest exploitation was especially dramatic during the 15-year period with massive commercial logging and conversion from forest to cultivated areas, especially to oil palm plantations. Soil erosion is one severe damage caused by forest exploitation. By removing the vegetation ground cover from the forest floor, rainfall carries surface soil to rivers and the river transports the soils to the riverbed, estuary, and offshore. Ground cover with grasses and trees is a well-known prevention method against soil erosion. To prevent soil erosion, the bare land should be covered with vegetation. When farmers develop and cultivate oil palm plantations, they first remove the surface soil layer and then plant oil palm seedlings. The bare areas between the seedlings should be covered with grass in order to prevent soil erosion Environmental consideration for a coal terminal in Talang Duku A water treatment facility should be prepared specifically for the pollution from coal dust and the contaminated water generated from the coal terminals (see Figure ). Table Water treatment facility for the coal terminal Facility Capacity Note Coal stock yard 20 ha for 1.0 million ton/yr. Settling basin 1 ha x 2m depth 1/20 for stock yard area Water treatment basin Filter facility Filtration system Drainage system Drainage network in stock yard Source : PT.Indonesia Power, Sularaya Power Plant Measures against traffic accident along the access roads to port areas The number of vehicles is anticipated to increase during construction and operation phases, especially carrier vehicles like container trailers, coal transport trucks. This indicates the risk of traffic accident for the people living along the access roads for both Talang Duku and Muara Sabak. Following countermeasures are suggested to avoid the risks. 1) Public meetings should be held for safety enlightening education by IPC. The meetings will be held for the peoples living along the access roads by community 23-6
7 basis. 2) Some publication for doing safety manners in the roads, like a brochure issued by IPC. 3) The traffic enforcers or the helpers should be arranged for the pedestrians crossing the roads at the public facilities like schools and hospitals. Measures for Other Environmental Parameters are described in the section of Environmental Management Plan (refer to Supporting Report: Part I). Coal Stock Area:20ha Capacity:1mill.ton Dyke Settling Basin area : 1ha Depth : 2m Drainage System Settling Basin Coal Terminal Discharge Water Treatment Facility Figure Schematic diagram of water treatment system for coal terminal 23-7
8 24. SHORT-TERM PLAN OF JAMBI 24.1 Project Description The Study Team identified a short-term plan based on the master plan (See section 22.8) and its phasing plan (See section 22.11). This short-term plan is made up of the projects urgently needed in Port of Jambi in response to the needs of the regional economy. The master plan proposes that a major part of the port activity be transferred from Talang Duku to Muara Sabak after Muara Sabak becomes fully operational. Accordingly, urgent projects are proposed only in Muara Sabak. (1) Project Profiles The layout plan for the short-term plan is shown in Figure Main components of the plan are shown in Table One berth for container and another berth for general cargo need to be created. The next phase of development will become necessary in Muara Sabak will start the operation with the access channel of 4.5m draft. The time of deepening the channel to 6m will be determined taking account of the development of the private industries around Muara Sabak. Table Short-term Plan for Muara Sabak (2007) Facility Base Case High Public Case Additional Container Berths 1: 125m/Berth, Draft 6m, Container Terminal Total Terminal Area Ground Slots CFS Container Handling Equipment Gantry Crane RTG Yard Tractor Reach Stacker 2.5 ha 257 TEU 320 m 2 Container Handling Capacity 47,000 TEU/year Additional General Cargo Berths 1 General Cargo Terminal Mobile Crane 3 Forklift 10 Shed 1,200 m 2 Open Storage 2,200 m 2 Access Channel Width = 80m, Depth = 4.5m Total Cost Rp. 242 billion ha 371 TEU 640 m
9
10 (2) Milestone Table Milestone for Base Case Year Milestone Procurement Construction 1 Gantry, RTG, 1 Container Wharf, 4 yard Tractors, CFS 2 Mobile Cranes, 5 Forklifts Container Wharf becomes operational, The Existing Jetty dedicated to General Cargo 1 General Cargo Wharf becomes operational 1 Mobile Cranes, 5 Forklifts 1 General Cargo Wharf, Shed Table Milestone for High Public Case Year Milestone Procurement Construction 1 Gantry, RTG, 1 Container Wharf, 4 Tractors, CFS 2 Mobile Cranes, 5 Forklifts 1 Container Wharf becomes operational, The Existing Jetty dedicated to General Cargo 1 General Cargo Wharf becomes operational (2) Container Terminal 1) Design vessel 1 Mobile Cranes, 5 Forklifts 1 General Cargo Wharf, Shed Design vessel for the short-term plan is the same as the master plan, 6m of draft and 110m of LOA. Hence, the proposed quay length is 125m as is the case with the master plan. 2) Terminal The area for the proposed container terminals can be estimated with the following formulas. Container Terminal Area = (Container yard area) / (Yard area ratio) = 1.6 ha (Base case), 2.3 ha (High public case) Container Yard Area = (Ground slots) / (Land use ratio) = 1 ha (Base case) 1.4 ha (High public case) Ground Slots = (Container volume) x (Dwelling time) / (Yard operation ratio) / 365 / 24-3
11 (Stacking height) = 257 TEUs (Base case), 351 TEUs (High public case) where: Yard area ratio: 0.6 (CFS within the terminal) Land use ratio: 260 TEU / ha (RTG system) Dwelling time: 5 days Yard operation ratio: 0.6 Stacking height: 4 Container volume: 18,000 TEU/year (Base case), 26,000 TEU/year (High public case) However, a terminal with a RTG system needs to have a depth of at least 200m. Accordingly, the Team proposes a terminal area of 2.5ha for both cases. 3) CFS Some portion of import/export container will be LCL requiring CFS. The area for the proposed container terminals can be estimated with the following formulas. In order to efficiently carry out the stuffing and stripping of containers, CFS should be located on dock. S = (W x D x p) / (w x r x T) where: W: cargo volume for CFS (ton) = (container cargo volume) x (CFS cargo ratio) D: average dwelling time (days) p: peak ratio w: average stacking weight in CFS (ton/m 2 ) r = effective use ratio of floor area in CFS T: annual operating days (days/year) These parameters are assumed as follows: W = 9,000t (Base case in 2007), 13,000t (High public case in 2007) D = 5 days, p = 1.5, w=1.0, r = 0.6, T = 300 days, CFS cargo ratio = 0.05 On the above assumptions, S is calculated as follows: S = 380 m 2 (Base case in 2007), 540 m 2 (High public case in 2007) Assuming the depth of CFS as 40m and the width of a bay as 8m, the actual area will be as follows: S = 320 m 2 (Base case in 2007), 640 m 2 (High public case in 2007) 4) Handling Equipment Taking into account the following factors, a RTG system is recommended for the yard operation. a. Large available area b. Reliability of equipment c. The terminal will be open to multiple users d. The terminal requires high stowing capacity to maximize the operational income 24-4
12 In order to provide a quay-side productivity of 20 TEU/hour/berth, the berth needs to have a gantry crane. A gantry requires two RTG and four yard tractors. 5) Gate The Study Team carried out a simplified calculation with the following formula to identify traffic volume of container cargo: (Traffic volume) = (Annual cargo handling volume) x (20ft container + 40 ft container)/ (20ft container + 2 x 40ft container) x /12 x /30 x /12 = 6 vehicles/hour/each way (Base case), 9 vehicles/hour/each way (High public case) where: (Annual cargo handling volume)=18,000 TEU (Base case), 26,000 TEU(High public case) (20ft container + 40 ft container)/ (20ft container + 2 x 40ft container) = 2/3 : Monthly variation = (cargo volume in the peak month) / (average monthly cargo volume) = 1.2 : Daily variation = (cargo volume in the peak day) / (average daily cargo volume) = 1.5 : Hourly variation = (vehicle traffic volume during the peak hour) / (daily traffic volume) = 1.2 (In-gate capacity) = 60 minutes / (gate processing time) x (working ratio) = 21.6 vehicle / hour where: (gate processing time) = 2.5 minutes / vehicle (working ratio) = 0.9 (Out-gate capacity) = 60 minutes / (gate processing time) x (working ratio) = 43.2 vehicle / hour where: (gate processing time) = 1.25 minutes / vehicle (working ratio) = 0.9 According to the above scenario, the gate to have one lane for each way. (3) General Cargo Terminal Assuming that a quarter of the cargo will go through sheds and another quarter will use open storage area, the following storage facilities are needed in the long-term. Shed area = (cargo volume) x (stored cargo ratio) x (dwelling time) / 365 days / (cargo volume per unit area) / (shed occupancy ratio) / (net area ratio)= 76,000 x 0.25 x 14 / 365 / 2 / 0.5 / 0.6 = 1,200 m 2 Open Storage Area = (cargo volume) x (stored cargo ratio) x (dwelling time) / 365 days / (cargo volume per unit area) / (yard occupancy ratio) = 76,000 x 0.25 x 30 / 365 / 1 / 0.7 = 2,200 m 2 In order to cater for the cargo with four gangs, the general cargo terminal requires the following handling equipment: 3 Mobile Cranes 24-5
13 10 Forklifts (4) Access Channel Since the number of calling vessels at Muara Sabak will be relatively small at an early stage, the Team proposes the following provisional design condition of the access channel: Width: 80m Depth: 4.5m The Study Team examined the economic impacts of different types of vessels on the transportation costs. Assuming the ship costs given in Section 22.5 and the project costs, shallow draft vessels requiring the depth of 6m turned out the most economical alternative for the short-term (Table ). Table Economic Implication of Ship Types Ordinary Vessel Ordinary Vessel requiring 6m Draft requiring 4.5m Draft Per TEU Transportation Cost (1,000 Rp.) Container Throughput in 2007 (Base Case) (TEU) Container Throughput in 2007 (High Case) (TEU) Total Transportation Cost in 2007 (Base Case) Total Transportation Cost in 2007 (High Case) Annual Maintenance Dredging Cost (1,000 Rp.) Shallow Draft Vessel requiring 4.5m Draft 1,306 2,100 1,677 18,000 18,000 18,000 26,000 26,000 26,000 23,508,000 37,800,000 30,186,000 33,956,000 54,600,000 43,602,000 14,300,000 5,005,000 5,005,000 Total Annual Cost (Base Case) Total Annual Cost (High Case) 37,808,000 42,805,000 35,191,000 48,256,000 59,605,000 48,607,000 Annual Benefits over the Scenario developing Ordinary Vessels requiring 4.5m Depth Base Case (1,000 Rp./year) 4,997, ,614,000 High Case 1,000 Rp./year) 11,349, ,998,000 Annual Benefits over the Scenario developing Ordinary Vessels requiring 4.5m Depth Base Case (1,000 Rp./TEU) High Case (1,000 Rp./TEU)
14 24.2 Engineering Design and Cost Estimate for Short-term Plan of Jambi Design Conditions (1) Proposed Vessel The proposed maximum capacity of the vessel is determined to have following dimensions: Container Ship: 5,000DWT, Length Overall: 110m Breadth of Ship: 15.7m, Full loaded Draft: 5.5m Required depth of the berth: 6.0m (2) Design Codes and Standard The design criteria of the marine and civil works are based on the following design standards and references: - Standard Design Criteria for Ports in Indonesia, Technical Standards for Port and Harbour Facilities in Japan, 1999 (3) Design Criteria The particulars of major design criteria for Short Term Development Plan are summarized in Table Table General Design Criteria Description Muara Sabak Container Berth General Cargo Berth Seismic coefficient Load on berth 3t/m 2 3t/m 2 Load on yard 4t/m 2 4t/m 2 Truck T-20 T-20 RTG on yard Max.32t/wheel - Gantry Crane on berth Max 45t/wheel - Berth top elevation Berthing velocity of ship 15cm/sec 15cm/sec Subsoil condition Sandy silt Sandy silt Assuming depth of hard strata -20m -20m (4) Tide Condition The change of the water surface level due to astronomical tide and water quantity of the river is determined as follows: Muara Sabak: HWL = +3.8m, LWL = +0.2m Layout of Short Term Development Plan The new container berth and general cargo terminal are planned to be developed at both sides of the existing concrete pier in Muara Sabak. This development is divided into two scenarios: Base case and High public case. In the short term development plan, one (1) container berth and one (1) general cargo berth having 125m length respectively with these related facilities are constructed in the 24-7
15 both scenarios. Since the difference of the water level between HWL and LWL is approximately 4.0m, these berths are planned to be constructed at about 50m detached from riverbank and two access bridges connecting the berth and yard are also planned. The container berth is planned to have 28m width in order to secure 12 m rail span of the gantry crane with additional space for the hatch covers of container ship at the back of the gantry crane. For the general cargo berth, a 17 m width berth is determined as sufficient space for the general cargo handling operation on the berth. The container yard and the general cargo yard are determined to be almost the same length of the berth with width 200 m to secure the required space for the related facilities with open space. The general layout of the short development plan for Jambi is shown in Figure Design of Port Facilities (1) Berthing Facilities The container berth and the general cargo berth are planned with detached pier type RC deck structure supported by the steel pipe piles. Based on the soil investigations for the site, a sand stone layer (N value >50) is encountered at about DL 20m. Thus, the steel pipe piles are to be driven into DL 20m to secure the bearing force. For the horizontal force of the berth such as vessel berthing, mooring force and seismic force of the berth, the coupled batter piles are to be used at the line of second pile alignment from the berth face. Based on the alignment of the piles and load on the berth, the adopted diameters of the piles are 600 mm for the container berth, 500mm for general cargo berth and 500mm for access bridges. All of the piles are planned to be protected against the corrosion loss due to brackish water for the area under the deck to D.L 1.0m. The RC deck for the berth is consists of RC pile cap, RC beam on the piles and RC slab. The scale of the RC deck structure for general cargo berth is generally smaller than the container berth. However, the heavy truck crane is planned to operate on the general cargo berth in this project. Therefore, the basic scale of the deck structure (except beams under the gantry crane rail) is planned to be the same as the container berth. Based on the design vessel size, berth accessories such as bollard and fender are determined. The capacity of the accessories are planned 35 ton bollard for both berth, cellular type 800 H fenders for the container berth and V type 600 H fenders for the general cargo berth. These accessories installed on the quay face are planned at 10 m intervals for the general cargo berth and 12 m intervals for the container berth. The typical section is shown in Figure for the general cargo terminal and Figure for the Container Terminal. 24-8
16
17
18
19 (2) Dredging and Reclamation Structural dredging work will be done by using clamshell buckets on barges up to DL 6.0 m along the berth line where precise dredging work is required, and different from those for turning basin and navigation channel. The dredging for the basin and the channel is explained as Channel Dredging Scheme. This dredging work is a rather small quantity (about 100m 3 ), mainly leveling work for the riverbed along the quay line. The reclamation work is adopted to fill the terminal yard up to DL +5.6 m (same elevation of the berth). The existing grand surface covered by the organic materials will be removed and filled up to required elevation by the suitable materials from quarry near the site. Based on the soil data, it was revealed that the soil consolidation is rather moderate at around 20 to 25 cm for 7-year duration with 2 tons/m 2 additional load. An additional reclamation fill will enable adjustment of the yard settlement. (3) Shore Protection and Stone Bank The riverbank of the terminal and the shore area underneath of the access bridges are planned to be protected with a stone layer from shoulder of the yard to DL 1.0 m. After filling work, the yard boundary of the river shall be made with slope 1:2, then the armor stones will be installed on the filter sheet with filter stone. The other perimeter face of the yard is planned to be protected by clay topsoil installation. (4) Pavement (Road, Container yard and General cargo open storage) Roads and paved areas are identified by their types, as follows: 1) Container storage areas and general cargo open storage 2) RTG runway beam (RTG Lane) 3) Container Sleeper 4) Roads and other areas of Container Terminal The following pavement types will be considered: 1) Container storage areas and general cargo open storage The structure of the pavement for the container storage area except for the RTG lanes and the container sleepers is planned and recommended as follows. Interlocking Concrete Block Sand and bedding Cement Stabilized base course (30kgf/cm 2, 7days) Crushed run sub-base course (CBR > 30) Sub-grade (CBR > 8% ) 80 mm 50 mm 200 mm 300 mm 24-12
20 2) RTG Runway Beams Rubber Tired Gantry Crane (RTG) is required the long span passage with 1.5 m width in order to stand a loading force of more than 38 tons per wheel. The lanes are generally required to be made of reinforcing concrete slab (RC slab) or PC slab. Section of the recommended structure is as follows: 1.5m 250 RC or P.C Slab Binding Concrete 100 Base Course (Crusher run, CBR>30) Sub-grade: CBR 8% 3) Container Sleeper The basement sitting for the containers is planned to be the heavy structure Container Sleeper having 1.5 m width and the same structure as RTG lane. The containers should be stacked and arranged at fixed positions in the yard for identification of the container. 4) Roads and other areas of Container Terminal The vehicle traffic lanes adjacent and parallel to the container stacking areas and access road to the terminal are planned and recommended in the following section. Portland Cement Concrete Surface 250 mm Base Course ( 20kgf/cm 3 ) 300 mm (Crashed stone for mechanical stabilization) Sub-grade (CBR > 8%) (5) Buildings The basic design concept of architecture zoning will be adopted to ensure efficient space utilization of the buildings. Design for the buildings and structures shall consider the future port development. The proposed buildings to be established in this project are summarized in Table ) Terminal Office Building The building is planned as two stories having 15 m width and 20 m length supported by RC pile foundation. The horizontal zoning concept is that each floor is broadly divided into two parts with a common area, which is allocated at the middle of the building, staircase and void space, in order to provide each area with natural ventilation. The space for this building is vertically and horizontally divided into two 24-13
21 floor zones to be utilized by different divisions and common spaces 2) CFS One container freight station (CFS) in the terminal is recommended. CFS shed has dimension of 40 m width and 56 m length, with 6m deep canopy on the both sides, supported by RC pile foundation. The shed has 300 m 2 for damaged cargo storage and 150 m 2 for operator s room. One side of the CFS shed has a platform which is 3 m width, 1.3 m height from the ground elevation in order to facilitate cargo handling from/to container on chassis and the other side of the CFS shed has a slope way for in-coming and out-going containers directly from trucks. The building will be designed to utilize natural environment resources for lighting and ventilation. Thus, the building will be provided with skylight at the top of the roof and movable high-side windows. 3) Maintenance Shop The building is planned to have 15 m width and 20 m length supported by RC pile foundation. The routine works of this facility are inspections and repair works for the container handling equipment. Annual and monthly inspections required for vehicles, RTG and other handling equipment utilized in the container terminal are expected to be performed. One overhead hoist crane shall be installed inside for the aid of repair works. The building will also be provided with skylight at the top of the roof and movable high-side windows. 4) Main Gate Three lanes for incoming, two lanes for outgoing and one oversize lane for both traffics are planned at the main gate. The gatehouse is designated to process and inspect vehicle and container as they leave or enter the terminal. The checking booths with computer communication lines in the gatehouse are installed at side of the lanes respectively. The gate is a one roof structure having 20 m width and 26 m length supported RC columns. Columns are installed at both sides of the checking booths located between the lanes. In addition, one track scale with 40 tons capacity will be installed at incoming lanes in the gatehouse in order to check the weight of container. Table Summary of Buildings Building Floor Number of Foundation Column Area (m2) Peoples Structure Structure Stories Office Building R.C Piles R.C 2 Maintenance Shop R.C Piles R.C 1 Main Gate House 6 Lanes 10 R.C Base R.C 1 CFS R.C Piles R.C 1 Warehouse R.C Piles R.C 1 Canteen & R.C Base R.C 1 Workers Room Remarks 24-14
22 (6) Utilities 1) Drainage System The drainage system (storm water drainage) is based on rainfall intensity and catchment area. The catchment area of the storm water is the only new reclamation area, since the reclamation area is an independent area in the site connected to the existing access road. The main drainage lines are designed to divide into two main drainage lines with underground RC pipes. Storm water is collected into main drainage lines by the concrete trenches installed in the area of the terminal. 2) Power Supply System Since, there is no available electricity power supply by PLN (National Electric Company) at Muara Sabak site, the power shall be provided by generators installed at site. To meet the electrical demand, it is required to supply about 600 kva for a gantry crane and 300 kva for other related facilities in the terminal. In addition to the electrical demand for normal operation, emergency power supply is considered for the site. Thus, one 1000 kva generator and one 600 kva generator is planned to be installed for the power sources. The lighting system for the facilities such as yard, buildings and road for container and general cargo terminal and electrical power for equipment are provided from main generator through sub-power stations. 3) Water Supply Since fresh water for the terminal operation is not available through existing public services, the fresh water will be provided by deep wells. However, it is difficult to take the fresh water from deep wells around the site due to seawater mixed into the well water. Thus, the water source is assumed to be located minimum 10 km from the site. A pipeline for water provided 15 km from the reservoir tank at the deep well site to the general cargo terminal is planned. The water supply system is arranged for the buildings, berth for supplying ship, green belt and fire hydrant system. The main water pipeline (6 ) from the deep well and distribution pipe (4 ) in terminal are to be installed underground. The water demands are assumed 35 tons/day for the buildings and 80 tons/day for ships. 4) Sewerage System and Other Utilities Waste water from buildings, canteen, and those toilets are to be discharged to a septic-tank and treated naturally. Therefore, septic-tanks are to be installed for individual facilities around the buildings. Other utilities such as communication system and navigation aids will be provided in this project Scope of Works The scope of works for the general cargo terminal and the container terminal is summarized in Table
23 Table Cost Estimate Scope of Works for Short Term Development in Jambi The project cost for the short term development in Jambi is estimated based on the following basic assumptions. (1) Unit Cost and Exchange Rate The project cost are estimated based on the unit price as of 2001 and the foreign currency exchange rate of US$ 1 = 9,500 Rupiah (Rp) = 118 Yen. (2) Construction Cost The direct construction cost is estimated based on the results of the quantities and the unit price for the construction works. The unit price was obtained by accumulating labor cost with income tax and indirect expense, materials cost and construction equipment cost for operation of the work. In addition to the direct construction works, 8% of the direct 24-16
24 construction cost for the common temporary works, 15% of the direct construction cost for site expenses and 8% of the direct construction cost for overhead are added for the construction cost. These percentages are based on reference to other similar projects in Indonesia. (3) Procurement Cost The procurement unit price are determined based on the imported CIF Jakarta price including installation costs of the individual unit price of items and costs of spare parts for two years. (4) Initial Dredging for Channel and Basin Initial dredging for the approach channel and basin in Batanghari River is required. The incremental volume of the initial dredging is estimated about 570,000 m 3, its initial cost is as follows. Dredging Inner Channel: 570,000 m 3 x Rp 25,000/m 3 = Rp 14,250 million (B= 80m, Depth = -4.5m) Engineering Fee: 2.5% of dredging fee = Rp 356 million VAT : 10% of dredging fee and Engineering fee = Rp 1,461 million (5) Currency Component The each unit price was split into foreign currency and local currency portions, both indicated in Rupiah, estimated in the following classifications. 1) The foreign currency component consists of : - Imported Construction materials - Foreign components of depreciation and operation/maintenance cost for construction equipment and plant - Foreign component of domestic materials - Salaries and costs of foreign personnel 2) The local currency component consists of : - Local construction materials - Local components of depreciation and operation /maintenance cost for construction equipment and plant - Salaries and costs of local personnel - Import duty on imported materials - Indonesian taxes (6) Depreciation Period For the economic analysis, the depreciation period of the constructed facilities and the procured equipment are determined as shown in Table
25 Table Depreciation Period of the Facilities and Equipment Facility Depreciation Period Remarks Berth, Retaining Wall 50 years Warehouse, CFS 50 years Yard Pavement 35 years Road Pavement 35 years Buildings 40 years Equipment Depreciation Period Remarks Quay gantry Crane 25 years RTG 20 years Mobile Crane 15 years Reach Stacker 15 years Tractor & Chassis 10 years Forklift 10 years (7) Maintenance Cost (Facility, Equipment, Dredging) The maintenance cost for facilities is set out as 2% of the construction cost of the facility based on the annual maintenance fee of the facilities. Also, the maintenance cost for the equipment is adopted as 3% of the equipment cost. The maintenance dredging cost is determined as annual maintenance dredging cost of the river done by RUKINDO. Maintenance dredging cost = Rp13,000/m 3. The incremental maintenance dredging volume is estimated as 160,000m 3 /year. Thus the cost of maintenance dredging is as follows. Maintenance Dredging : 160,000m 3 /yr x Rp 13,000/m 3 = Rp 2,080 million Engineering Fee : None VAT : 10% of dredging fee = Rp 208 million (8) Project Cost In addition to the construction cost, equipment cost, and the initial dredging cost, the engineering fee of 12% for the construction and 3% for the equipment, the physical contingency of 8% for the construction and VAT of 10% for the whole cost are considered in the project cost. The project cost for the short term development in Jambi is shown in Table The equipment cost for Jambi is shown in Table The construction cost for Jambi is shown in Table for the container terminal and Table for the general cargo terminal
26 Table Project Cost for the Short Term Development in Jambi (Unit in Million Rp.) Civil Work Equipment Total Foreign Local Foreign Local Foreign Local Total Muara Sabak - Base Case 93,194 51,375 72,109 9, ,303 60, ,748 Muara Sabak - High Case 93,194 51,375 72,109 9, ,303 60, ,748 Initial Dredging 9,494 6,573 9,494 6,573 16,067 Total - Base Case 102,686 57,948 72,109 9, ,795 67, ,813 Total - High Case 102,686 57,948 72,109 9, ,795 67, ,813 Table Equipment Cost for Jambi Phase Unit Price Amount Description Quantity (Million (Million I 1 Gantry Crane 1 32,000 32,000 Container 2 RTG 2 11,200 22,400 Berth 3 Tractor & Trailer 4 1,100 4,400 4 Mobile Crane (25t) 2 1,900 3,800 5 Reach Stacker 1 3,650 3,650 6 Forklift (3T) ,750 7 Engineering Fee 3% 2,040 8 VAT 10% 7,004 Total 77,044 II 1 Mobile Crane (25t) 1 1,900 1,900 General Cargo 2 Forklift (3T) ,750 Berth Engineering Fee 3% 110 VAT 10% 376 4,
27 Table Construction Cost of Container Terminal for Jambi (Phase I) Description Unit Quantity Unit Price (Rp) Amount (Million Rp) 1 Direct Construction Cost (1) Mobilization and Demobilization L.S 1 16,000,000,000 4,000 (2) Dredging & Reclamation 1) Dredging m , ) Reclamation m 3 50,000 32,200 1,610 (3) Berth Construction 1) Steel Pipe Piling Work (D=600) m 4,800 1,899,052 9,115 2) Concrete Deck Concrete Placing m 3 2, ,900 1,580 Re-bar Work ton 289 5,099,050 1,472 3) Trestle (2 sets) Steel Pipe Piling Work (D=500) m 1,750 1,198,546 2,097 Concrete Deck m , Re-bar Work ton 88 5,099, ) Retaining Stone Bank m 3 2, , ) Wharf Fittings Fender & Bollard set ,000,000 1,584 Crane Rail Fittings m 250 1,315, ) Corrosion Protection m 2 1,800 1,280,000 2,304 (4) Yard Pavement 1) Block Paving m 2 3, , ) RTG Lane m 2 1, , ) Container Sleeper m 2 1, , ) Concrete Paving m 2 19, ,370 3,307 (5) Access Road 1) Filling & Grading m 3 14,285 32, ) Concrete Paving m 2 2, , ) Utilities L.S 1 250,000, (6) Buildings 1) CFS (1 Units) m 2 2,240 1,420,000 3,195 2) Gate m ,150, ) Terminal Office Building m ,150,000 1,290 4) Work Shop m 2 1,200 1,420,000 1,704 5) Canteen m ,420, (7) Yard Fence m , (8) Drainage System L.S 1 2,536,800, (9) Power Supply & Yard Lighting L.S 1 7,583,333,333 3,250 (10) Water Supply System L.S 1 3,700,000,000 1,850 (11) Sewerage System L.S 1 1,487,500, (12) Other Utilities L.S 1 600,000, Total Direct Cost 45,596 3 Indirect Construction Cost (1) Common Temporary Work % 8 D.C 3,648 (2) Site Expenses % 15 D.C 6,839 (3) Overhead % 8 D.C 3,648 Total Indirect Cost 14,135 Total Construction Cost 59,730 Physical Contingency % 8 T.C 4,778 Engineering Fee % 12 T.C 7,168 VAT % 10 T.C, P.C, E.F 7,168 Total Project Cost 78,
28 Table Construction Cost of General Cargo Terminal in Jambi Description Unit Quantity Unit Price(Rp) Amount (Million Rp) (Phase II) 1 Direct Construction Cost for General Cargo Terminal (1) Mobilization and Demobilization L.S 1 3,800,000,000 3,800 (2) Dredging & Reclamation 1) Dredging m , ) Reclamation m3 55,000 32,200 1,771 (3) Berth Construction 1) Steel Pipe Piling Work (D=500) m 3,125 1,198,546 3,745 2) Concrete Deck Concrete Placing m3 1, , Re-bar Work ton 164 5,099, ) Trestle (2 sets) Steel Pipe Piling Work (D=500) m 2,050 1,198,546 2,457 Concrete Deck m , Re-bar Work m3 92 5,099, ) Retaining Stone Bank m3 2, , ) Wharf Fittings Fender & Bollard set ,000,000 1,872 6) Corrosion Protection m2 1,495 1,280,000 2,220 (4) Yard Pavement 1) Block Paving m2 21, ,727 3,515 (5) Access Road 1) Filling & Grading m , ) Concrete Paving m , ) Utilities L.S 1 100,000, (6) Buildings 2) Warehouse ( 1 Units) m2 3,600 1,420,000 5,112 3) Gate m2 80 2,150, ) Terminal Office Building m ,150, ) Work Shop m ,420, ) Canteen m ,420, (7) Yard Fence m , (8) Drainage System L.S 1 706,000, (9) Power Supply & Yard Lighting L.S 1 1,250,000,000 1,250 (10) Water Supply System L.S 1 1,850,000,000 1,850 (11) Sewerage System L.S 1 450,000, (12) Other Utilities L.S 1 100,000, (13) Water Resources L.S 1 3,432,000,000 3,432 Total Direct Cost 37,695 3 Indirect Construction Cost (1) Common Temporary Work % 8 D.C 3,016 (2) Site Expenses % 15 D.C 5,654 (3) Overhead % 8 D.C 3,016 Total Indirect Cost 11,686 Total Construction Cost 49,381 Physical Contingency % 8 T.C 3,950 Engineering Fee % 13 T.C 6,419 VAT % 10 T.C,P.C,E.F 5,975 Total Project Cost 65,
29 24.3 Implementation Plan for Short-term Development of Jambi Construction Presumption (1) Working days for construction The working days considered in the construction schedule are basically every day except Sunday, National holidays and heavy rain days. The number of working days per month is determined as follows Civil Works: Building Works: (2) Productivity of the Works 23 days/month 25 days/month The following productivities of the works are applied for the construction schedule. Fabrication and Transportation of Steel Piles: 3 months from order Structural Dredging: 300 m 3 /day (Clam-shell mounted on barge) Reclamation: 300 m 3 /day (reclaimed by dump truck & bulldozer) Driving of Steel Pipe Pile: 2 piles/day x parties Concrete Work: 25 m 3 /day Pavement (Concrete Block): 120 m 2 /day Pavement (Concrete): 170 m 2 /day Building Construction (RC Office): 10 m 2 /day Building Construction (RC Shed): 20 m 2 /day Project Implementation Schedule The project implementation schedule includes consulting services for detailed design stage, tendering stage and construction supervision and construction stage of the project. The consulting services before construction are assumed to be for one year. Based on these assumptions for construction, the prospective implementation schedule is prepared as shown in Table for the Container Terminal and Table for the General Cargo Terminal
30 Table Implementation Schedule for Container Terminal 24-23
31 Table Implementation Schedule for Gene ral Cargo Terminal 24-24
32 24.4 Operation and Management Scheme In the short-term plan for 2007, following measures are needed. (1) Development of Port Facilities Port facilities have not sufficiently developed due to a lack of funds. Development of port facilities in Muara Sabak is needed in the short-term. Jambi ADPEL and the other port-related offices are still operating in the old Jambi port. They need to be relocated to Talang Duku to better coordinate with the IPC II Jambi branch office. (2) Review of Port Working Area and Port Interest Area It is necessary to review Port Working Area (land area and water area) and Port Interest Area (water area) of Jambi Port. They should be reviewed in accordance with the new port regulation (Government Regulation No.69/2001). The cost-sharing scheme of the maintenance dredging should be taken into account in reviewing those areas. (3) Simplification of Port Procedures IPC Jambi branch office provides various port services such as ship service, cargo service and terminal service as a port authority. On the other hand, Jambi ADPEL is managing port and channel navigation safety as a harbor master in Jambi Port. It takes a long time for port users to receive permission from the port office, particularly for port entry and berth assignment. Port-related procedures need to be simplified by introducing an EDI system. They should be processed in a fair and prompt manner. Introduction of a processing manual, unification of the application forms, delegation of the authority to local offices and application of standard processing time are among the measures to be considered. (4) Maintenance Dredging Maintenance dredging of the access channel is carried out by Ministry of Communications and IPC II. They make an agreement on this matter every year. The provincial government of Jambi is expected to bear a part of the cost after decentralization. Therefore, it is necessary to establish a cost-sharing scheme, which is acceptable for the parties concerned. (5) Improvement of Navigational Safety Jambi ADPEL is responsible for the navigation safety in the Jambi port and Batang Hari River, while Kuala Tungkal ADPEL is responsible for that in Tungkal River. It is necessary to increase light buoys to secure safety for night navigation
33 24.5 Economic Analysis of Short-term Port Development at Jambi General Introduction to Economic Evaluation The purpose of economic evaluation is to provide a view of the feasibility of investment from the national, resource viewpoint. It differs from financial analysis, which provides information on the direct financial implications of investment including profitability. Economic evaluation, therefore, considers only resource costs and excludes transfers such as taxes. It also takes into account the price of local (non-traded) inputs which may be overpriced or underpriced relative to market conditions. Minimum wages may overprice labour relative to its market value and subsidies, say for fuel or water, may underprice inputs. Shadow pricing is the mechanism to overcome these market defects. Economic evaluation also differs from financial analysis as it is based on with and without project scenarios and the costs and benefits quantified are the incremental costs and benefits (i.e., the difference between the two scenarios). In this project, the without scenario is defined as the existing port at Jambi having minimal development and very little change occurring in infrastructure, equipment and operational procedures. In this project, under the without case, the existing port facilities will be used to their maximum capacity with an increasing degree of congestion and delay at the berths and in the terminals. This would result in increased waiting time, lower port efficiency and increased transport costs. Container traffic would also be handled at the existing general cargo berths at lower handling rates than would be anticipated at specialized berths. Ultimately, traffic would be increasingly diverted to other ports such as Palembang and this is already happening and sometimes to ports even further distant. Under the with project scenario the specialized and additional facilities will enable cargo to be handled more efficiently and cost effectively with ships experiencing less queuing and faster on berth turnaround times Methodology (1) General Economic analysis is carried out by means of well-developed techniques and the EIRR (Economic Internal Rate of Return) and NPV (Net Present Value) are the two most often used. Both use discounting or discount rates (i.e., money has a time value and the same amount of money is worth more today than in any future year). EIRR calculates the discount rate internally, hence its name and is the most widely used for the reason that one does not need to input a discount rate. The rate estimated within this procedure provides a proxy for the economic return on investment and is then 24-26
34 compared to the target discount rate (15 % in Indonesia). To calculate the NPV of a project, the discount rate is input and a discounted project value i.e. the value of the project in today s values is the output. If the output is greater than zero, the project is economically feasible. In Indonesia, in recent years, the minimum rate required for projects has been 15 percent for non-social projects and 12 percent for social projects such as housing. In undertaking the economic analysis, the project period is determined, and the costs and benefits of the investment, in each year of disbursement or receipt, are calculated. Both local costs and all benefits are shadow priced. The foreign portion is regarded as already at market prices so no adjustment is made for imported (traded) inputs. All costs and benefits are expressed in real terms (i.e., there is no allowance for inflation although costs and benefits may be increased if there is expected to be an increase in real terms i.e. above the general level of inflation). Costs and benefits are expressed in real or constant values in the base year of study which for this project is The exchange rate used throughout is US$1.0=Rp.9,500. Clearly, economic analysis depends on quantification of costs and benefits. All projects have clearly quantifiable elements but also elements that are difficult or impossible to quantify. (2) Specific Aspects of Jambi Development At this stage of the project, the ToR specify that the Master Plan as a whole is to be evaluated i.e. the total costs and benefits of all the Jambi port sub-projects are to be compared together to assess in broad terms the feasibility of the Master Plan. This section relates to the economic evaluation of the Master Plan. The short term project, which forms the first set of sub-projects, for implementation within the master plan framework, is evaluated in section This section deals with both the Base and High development scenarios as defined above. Usually, the principal quantified benefits of each such project are reduction in ship time in port and/or queuing and avoided land transport and /or transshipment costs between the without and with scenarios. In this case, one existing small port and a proposed port are both complementary and competitive. Unlike Samarinda, the existing port is very small and is not handling many containers per year Project Period As with the Master Plan, thirty years has been chosen for short-term evaluation
35 However, discounting means that costs and benefits after about 20 years usually have relatively small impacts on the economic feasibility Project Costs For the short-term plan, the project represents the first package for implementation. However, the determination of costs is the same as for the Master Plan but only for the first period, together with all replacement of equipment needed over the project lifetime. Costs for each short term scenario are divided into capital costs and annual costs. Capital costs are incurred both for the initial investment, and any subsequent, phase and for replacement of fully depreciated assets within the 30 year period (usually equipment has an economic life of less than 30 years). Dredging at Jambi will be required on capital and annual basis. The economic costs of implementing the projects have been estimated based on the financial cost including physical contingency. Price contingency, interest during construction and taxes and duties are then all excluded from the financial cost. In order to shadow price the projects costs and benefits, a standard conversion factor (SCF) of has been generally applied to non-traded (local portion) costs and benefits and a specific factor of 0.75 has been applied to unskilled labour. These factors are currently being applied in other Indonesian project evaluations. Annual costs (i.e., operating and maintenance costs) are assumed to have a reasonably high local content and a SCF of 0.9 has been applied. All traded costs (foreign portion) have been valued at their border price (i.e., the SCF is assumed as 1.0). 1) Capital Costs and Maintenance Costs These have been specified by year in section and the assumptions made detailed therein. The without scenario envisages minimal development and so the capital and maintenance costs are the incremental costs, but only related to the short-term investment. Current maintenance expenditure is minimal. 2) Operating Costs These have been projected originally for the Jambi port branch based on 1999 and 2000 data and then converted to incremental costs for the project, based on incremental cargo volumes for each scenario. These have been projected originally for the branch based on 1999 and 2000 data and then converted to incremental costs based on incremental cargo volumes for each scenario. The estimates involve a two-stage process. First a realistic assessment of the base year data is needed to establish the reliability of the data and then the future year costs must be 24-28
36 estimated taking into account that some costs will directly vary with cargo growth and other costs are fixed or semi-fixed. Base year costs were reviewed in relation to other Indonesian ports including on an IPCwide basis for the 4 IPCs. Secondly, cost data was disaggregated and an estimate made of the likely proportion of fixed sub-costs and variable sub-costs. Based upon a weighted average of these two, an estimate could be made of the link between cargo growth and operating cost growth. In the feasibility study, operating costs are kept constant from the year short term capacity is reached as indicated in Section Table shows the incremental operating costs. 3) Dredging Costs Dredging costs are subsidised in the RUKINDO contracts and a substantially increased price has been allowed. However, it is unclear whether any subsidy still remains in our estimates. Hence, dredging costs are not shadow priced Benefits-Quantifiable (1) Ship Queuing and Savings to Ships Ship waiting time with and without the project are estimated with a simulation model and this was described in Section The resulting time savings are then costed by applying the daily cost of the average vessel in key years. Vessel cost per day was established by surveys with ship operators and charterers. These costs are increased in real terms in line with the increased size of vessel projected over time. There is considerable competition in shipping rates at present with the economic recession in Indonesia and elsewhere, but the possible increase in real costs is difficult to estimate. The three types of vessels handled at Jambi public port are container, general cargo and bulk/cpo vessels. Passenger vessels are not handled at Talang Duku nor proposed at Muara Sabak. Table Ship Costs per day interpolated between 2007 and 2025 Type of Vessel GRT, Tonne (t) or TEU Year Cost per Day (Million Rp.) Container 75 teu In teu By General Cargo 300 t In t By Bulk CPO Cargo 927 grt In grt By Notes: Conversion of tonnes to GRT or v.v. based on Indonesian fleet data and load factors Sources: Research in Indonesia with shipping companies and charterers
37 (2) Ship Service Time on Berth and Savings to Ships Benefits are also generated by faster turnaround of vessels. The simulation model gives time on berth with and without project and annual savings are calculated and costed as in a) above. Other benefits, albeit small in total, are generated because ships can save up to 36 hours per round trip by calling at Muara Sabak rather than Talang Duku. The saved time is valued as in (2) above. (3) Avoided Transport Costs At the point at which the without project capacity is reached, overflow cargo is assumed to be handled elsewhere. In accordance with the likely situation, it is assumed 100% will be handled at Palembang about 265 km from Jambi. The avoided costs (benefits) are based on the economic cost of truck transport based on data used in Indonesia for highway planning. While these rates could vary from actual freight rates they represent a more realistic resource cost. Road transport costs are based on cost models currently in use in Indonesia. These models are based on the World Bank Highway Development Manual and adapted over many years to Indonesian conditions. The main inputs are vehicle type, speed and road surface. It is assumed that these conditions will not be as favourable as in East Kalimantan (a new road or toll road is planned to link Samarinda the capital with Balikpapan the oil centre) and therefore, truck costs are somewhat more expensive in Sumatra than Kalimantan. Heavy truck costs are estimated to amount to Rp 3,688 per truck/km assuming that each truck will carry 10 tonnes payload. As traffic will be imbalanced a load factor of 80% is assumed within that figure bearing in mind probable overloads. It is quite possible that in a regional port study, there would be justification of including some additional capital costs for overflow ports and other infrastructure. In this study, since a specific Master Plan is being assessed, the regional infrastructure requirements are not considered in detail. Therefore, as this benefit is quite substantial and there could be justification for assessing the impact of not including all of this benefit assessed in the sensitivity analysis. (4) Transport Disbenefits Muara Sabak is about 105 km from the existing Jambi port and there will be some disbenefit from the additional distance. However, companies are likely to move in the longer term nearer the port and industrial development areas are already planned in the Muara Sabak area at Parit Culum. Further, Jambi city will become increasingly congested and impose penalties on port users
38 The disbenefit is assumed to be on the same cost basis as the avoided costs above. However, for the reasons above, it is assumed that in year 1 of operation the disbenefit will be 100 % of the maximum. By 2025 this percentage is assumed to fall to 10 % with relocation of businesses. (5) Benefit Cut-Off Just as costs are kept constant once the capacity year is reached, so benefits are capped in the same way. Further, as the short term project at Jambi relates only to Muara Sabak, so benefits related to Talang Duku are excluded. (6) Shadow Pricing of Benefits The net benefits are shadow priced at a SCF of Conventionally, only benefits to Indonesian shippers and other Indonesian parties are included. In Jambi, as in most river ports, this is made complex by the fact that say plywood is exported from Indonesia in foreign ships but is barged to the sea in Indonesian vessels. Container exports often travel in Indonesian ships to the export port where they are exported in foreign ships. This is further complicated by the fact that Indonesia is taking steps to carry more goods in Indonesian ships so that by 2025 the situation could be different. In this case, unlike Samarinda, therefore, it is assumed no benefits accrue directly to foreign entities Unquantified Costs and Benefits Environmental and social impacts are usually impossible or very difficult to quantify in monetary terms. The loss of mangrove areas and the destruction of landscapes and cultures cannot be measured in these terms. Project screening at an early stage attempts to sieve out the most sensitive areas. Similarly, the generation of employment and employment opportunities, development of the economy and the facilitation of agriculture, trade and industry are all aspects which this project will help develop in a very important manner. However, their quantification is rarely attempted. This is because either no data exists to help quantify the impact of improved transport and even where some data does exist, its further translation into monetary terms depends on often-speculative assumptions. However, this is not to say that the economic development aspects are not important. On the contrary, while benefits are attempted to be quantified through cost savings, the goal is expansion of the regional economy, more and better quality employment opportunities and economic and social development in its wider sense
39 The basis of the provincial economy and its maritime transport constraints were discussed in Chapter 9, on demand forecasts. However, it is worth emphasizing again, albeit briefly, that Jambi province is poorly served by river/sea transport with Talang Duku a long way upstream and providing public services through only small vessels on a semi-scheduled basis. The current difficulties and limitations of the existing services are described above. Conversely, as described in sections 8 and 9, Jambi province is resource rich and, while possibly not on the same level as Riau or East Kalimantan, requires improved river/sea transport to provide much needed support to exploit these resources. The Jambi Port Master plan sets out to significantly support economic development through the phased implementation of infrastructure and equipment, together with associated operational and related improvements. The short term plan is the first step along the route to the implementation of the Master Plan Residual Values Land values have not been included as no expenditure has been made on land in the cost estimates. Infrastructure implemented after 2020 has been valued at 50 percent of its initial cost and all equipment is assumed fully depreciated by After 30 years the impact of residual values is very small
40 Results of the Economic Evaluation The EIRR for the proposed Master Plan was estimated as shown in Table which also shows the sensitivity analysis. Table EIRR Analysis for Jambi Short-Term Plan-Base Option JAMBI Port Short-Term Plan Base Scenario Cost Plus 10% Benefits Minus 10% Combining (2) and (3) (1) (2) (3) (4) EIRR (%) The EIRR analysis shows that the Short Term Plan is economically viable at nearly 20 percent. If either benefits or costs change by 10 percent, the EIRR remains around 18 percent. With two unfavourable factors combined the EIRR remains above 17 percent. At 15 % discount rate, the Net Present Value (NPV) is Rp. 80,638 million. Any positive value of NPV means the project is viable. Table EIRR Analysis for Jambi Port Short Term Plan-High Scenario JAMBI Port Short-Term Plan High Scenario Cost Plus 10% Benefits Minus 10% Combining (2) and (3) (1) (2) (3) (4) EIRR (%) The EIRR analysis shows that the Short Term Plan is economically viable. If either costs or benefits change, the EIRR remains about 17 percent. With two unfavourable factors combined the EIRR remains viable at over15 percent. At 15 % discount rate, the Net Present Value (NPV) is Rp. 53,243 million. Any positive value of NPV means the project is viable
41 Table Results of the Economic Evaluation of Jambi Ports Short Term Plan / /Base Scenario Year NET BENEFIT Capital Costs Maintenance incl dredging NET COST BENEFITS ,447 0 (3,447) ,635 0 (35,635) , ,605 0 (132,039) ,364-32,447-3,837 (18,920) , ,852 16, , ,023 21, , ,215 25, , ,416 31, , ,623 36, , ,839 43, , ,063 50, , ,297 57, ,758-6,070-8,297 59, ,651-1,727-8,794 72, , ,059 83, , ,334 93, , , , ,812-7,354-9, , ,755-1,875-10, , , , , , , , , , , ,796-28,181-10, , ,796-1,727-10, , , , , , , , , , , ,796-31,586-10, , , , , , , , , , , , , , ,796-13,424-10, ,537 3,433, ,893 42,074 Residual Value Land Infrastructure 84,147 42,074 EIRR= 19.8% NPV= 80,638 Total costs= 586,893 Million Rp 24-34
42 Table Results of the Economic Evaluation of Jambi Ports Short Term Plan / High Scenario NET BENEFIT Capital Costs Maintenance incl dredging NET COST BENEFITS ,454 0 (3,454) ,091 0 (34,091) ,598 0 (102,598) ,287-41,580-5,564 (36,857) ,205-31,418-5,959 (19,172) , ,414 17, , ,631 21, , ,872 26, , ,125 32, , ,388 38, , ,663 44, , ,950 50, ,932-6,070-9,250 51, , ,565 65, ,248-1,727-9,894 71, , ,238 82, , ,599 92, ,968-7,354-10,978 95, , , , ,945-1,875-11, , , , , , , , ,987-28,181-12, , , , , ,987-1,727-12, , , , , , , , ,987-31,586-12, , , , , , , , , , , , , , ,987-13,424-12, ,952 3,285, ,773 42,074 Residual Value Land 0 Bought - Balance in Infrastructure Spent after ,147 Remaining Value 42,074 EIRR= 18.2% NPV= 53,243 Total Costs = 621,773 Million Rp 24-35
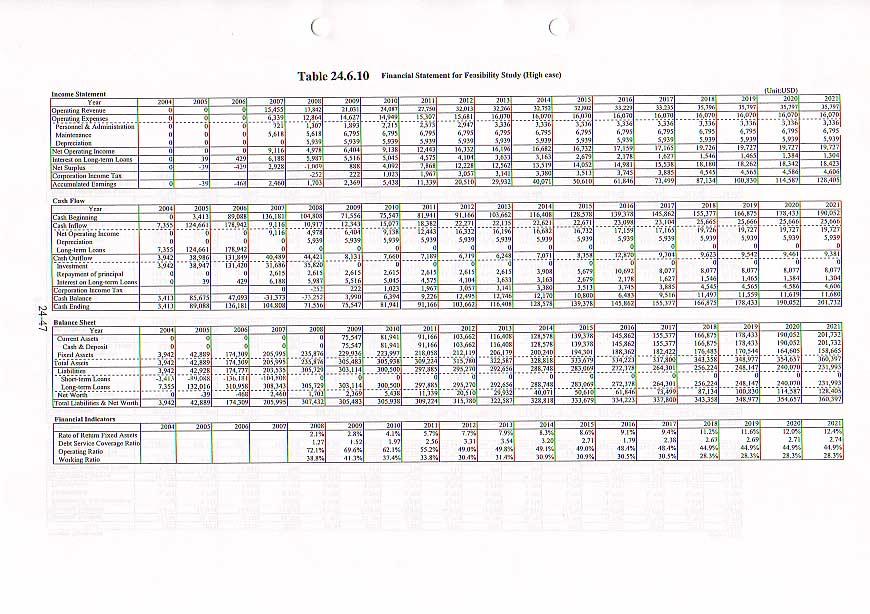
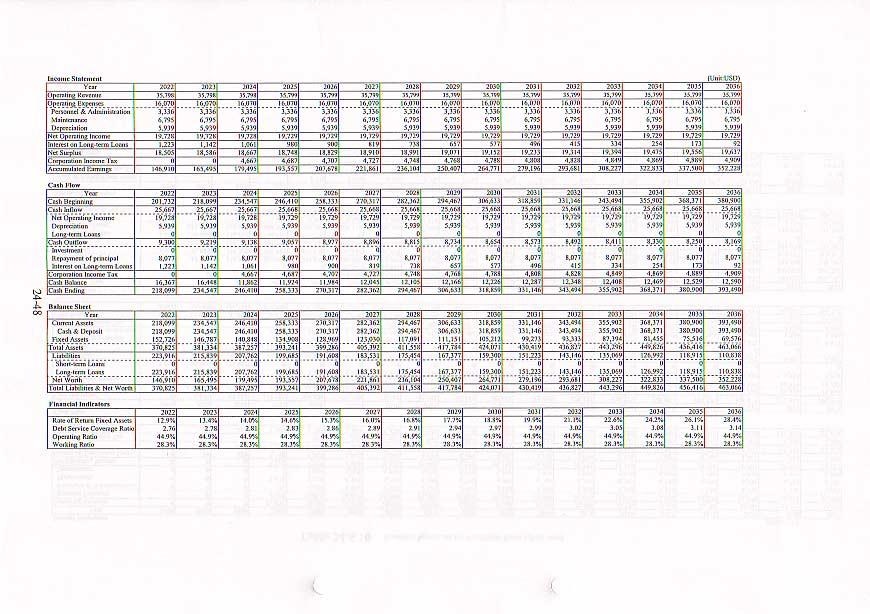
43 24.6 Financial Analysis Methodology (1) Viability of the Project The viability of the project is analyzed using the Discount Cash Flow Method and appraised by the Financial Internal Rate of Return (FIRR). The FIRR is the discount rate that makes the discounted costs and revenues over the project life equal, i.e., the rate "r" that satisfies the following formula: n i=1 Bi Ci ( 1 + r ) i 1 = 0 Where, n : Project life, Bi : Revenue in the i-th year : the first year is the base year, Ci : Cost in the i-th year r : Discount rate. The revenues and costs which are taken into account for the FIRR calculation are summarized in Table The revenue and cost items excluded from the FIRR calculation are also summarized in Table When the calculated FIRR exceeds the weighted average interest rate of the total funds for the investments of the project, that project is regarded as financially feasible. Table Revenues and Costs Employed in the FIRR Calculation Revenues Costs 1) Operating Revenues by the Project 1) Investment for the Project (including reinvestment for the project, installation of handling equipment and replacement/overhaul of equipment) 2) Operating Expenses such as Maintenance, Repair, Rental, Personnel and Administration Costs Table Revenues and Costs Exempted from the FIRR Calculation Revenues Costs 1) Fund Management Income 1) Depreciation Cost 2) Repayment of the Loan Principal 3) Interest on Loans (2) Financial Soundness of the Executing Agency The financial soundness of the executing agency of the project is appraised based on its projected financial statements (Profit and Loss Statement, Cash Flow Statement and Balance Sheet). The appraisal is generally made from the viewpoint of profitability, loan repayment capacity and operational efficiency, 24-36
44 using the following formula: 1) Profitability Rate of Return on Net Fixed Asset : Net Operating Income Total Fixed Assets This indicator shows the profitability of the investments in terms of Net Fixed Assets. It is necessary to keep the rate higher than the average interest rate of various funds for investments, which have different interest rates. 2) Loan Repayment Capacity Debt Service Coverage Ratio: Net Operating Income + Depreciation Cost Repayment and Interest on Long-term Loans This indicator shows whether the operating income can cover the repayment of both the principal and the interest on long-term loans. The ratio should be higher than 1.0 and is desirable to be higher than 1.75 (World Bank recommendation). 3) Operating Efficiency (i) Operating Ratio : (ii) Working Ratio : Operating Expenses Operating revenues Operating Expenses Depreciation Expenses Operating Revenues The Operating Ratio shows the operational efficiency of the organization as an enterprise, while the Working Ratio shows the efficiency of the routine operations. When the Operating Ratio is less than 70-75% and the Working Ratio is less than 50-60%, the operation of the organization is assessed to be efficient Assumption for Financial Analysis (1) Scope of Analysis The viability of the project is assessed using the revenues and costs related to the project. It is also assumed that IPC2 Jambi Branch Office will construct the new terminal at Muara Sabak and that it 24-37
45 will operate and manage the terminal. Thus, the investment by IPC2 will be confined to the following: - All infrastructure construction work of the new terminal. - Procurement of cargo handling equipment for the new terminal.. (2) Base Year Price as of year 2001 is used in this financial analysis. Price escalation due to inflation for the future is not considered. (3) Project Life Taking account of conditions of the long-term loans and service lives of port facilities, the project life for the financial analysis is determined as 33 years including 3-year design and construction period. (4) Cargo Handling Volume To estimate the revenues to be generated from cargo handling and marine charge relative to the new terminal, cargo volume was assumed as shown in Table (5) Revenues and Port Tariff The Study Team took the following assumptions for the container wharves of Jambi Port. 1) Talang Duku will remain a conventional terminal throughout the study period. 2) Talang Duku will raise the tariff by 20 % in 2005 to become on a par with other conventional terminals. The tariff in Talang Duku will be raised in 2018 again to pay for the new investment. 3) Muara Sabak will be declared as a container terminal in 2007/2008. Most of the containers handled at Muara Sabak will be destined for Singapore. Accordingly, Muara Sabak will charge the tariff 4) As for a general FCT. cargo handling and marine charge, the existing tariff will be applied. 5) To avoid a drastic increase of the container tariff, an exchange rate of US$1= Rp.6,000 is applied (This rate of convenience is adopted at Palembang)

46
47 Terminal Talang Duku Muara Sabak Table Future Container Tariff at Jambi Port Type of a container FCL Rp.94,800 (20 ) Rp.120,000 (20 ) Rp.200,000 (20 ) Rp.142,200 (40 ) Rp.180,000 (40 ) Rp.300,000 (40 ) LCL Rp.195,600 (20 ) Rp.240,000 (20 ) Rp.400,000 (20 ) Rp.293,400 (40 ) Rp.360,000 (40 ) Rp.600,000 (40 ) Empty Rp.85,320 (20 ) Rp.110,000 (20 ) Rp.180,000 (20 ) Rp.127,980 (40 ) Rp.165,000 (40 ) Rp.270,000 (40 ) FCL - US$ 81 (20 ) US$ 81 (20 ) US$121 (40 ) US$121 (40 ) LCL - US$135 (20 ) US$135 (20 ) US$ 203 (40 ) US$ 203 (40 ) Empty - US$ 73 (20 ) US$ 73 (20 ) US$109 (40 ) US$109 (40 ) (6) Fund Raising It is assumed that 85 % of the total project cost is financed by foreign funds. The remaining 15 % of the total cost is assumed to be raised by domestic funds. The following conditions are employed for each fund in this financial analysis. 1) Foreign Fund The foreign loan conditions are assumed as follows: 2) Domestic Fund - Loan period : 30 years - Grace period : 10 years - Interest rate : 1.0 % per annum - Repayment : Fixed amount repayment of principal - Ratio of investment : Less than 85 % of the project cost The domestic loan conditions are assumed as follows: - Loan period : 10 years - Interest rate : % per annum ( The real interest rate excluding inflation rate ) - Repayment : Fixed amount repayment of principal 3) Weighted Average Interest Rate The weighted average interest rate of the funds for investments is 3.55 % per annum under the loan conditions stated above. (1.0 x x 0.15 = 3.55) (7) Expenditure 24-40
48

49
50 Capital cost and annual cost for the project are summarized in Table and Table Capital dredging costs were divided to two parts, inside the river and outside the river. Since IPC2 is responsible for the dredging inside the river, the capital dredging cost for the channel inside the river was counted as the project cost. The Study Team also assumed IPC2 would pay a half of the maintenance dredging costs outside the river mouth. The dredging costs born by IPC 2 are included in the financial analysis. Table Proposed Dredging Cost Sharing Area Capital Dredging Maintenance Dredging Inside the River Mouth IPC 2 IPC 2 Central Government (50%) Outside the River Mouth Central Government IPC2 (50%) 1) Investment Initial investment cost for the infrastructure and superstructure developed by IPC2 are estimated. Since the durable years of infrastructure facilities are longer than the project life, re-investment costs for these facilities are not counted in this analysis. 2) Maintenance Cost Annual maintenance cost for infrastructure facilities are calculated as 1.6% of the initial construction cost. Annual maintenance cost for superstructure facilities are calculated as 2.60% of the original procurement cost. In addition, the replacement cost is counted in 2017, 2022, 2027, and ) Depreciation Cost Annual depreciation cost for both infrastructure and superstructure facilities is calculated by the straight-line method, based on their durable years. Residual value after all depreciation is estimated as being zero. 4) Tax Taxes to be levied for profit are income tax and deemed dividend tax Evaluation of Project (1) Viability FIRR of the project is shown in Table and Table FIRR of each project is exceeding the weighted average interest rate of loan of 3.55 %. (2) Sensitivity Analysis Sensitivity analysis is carried out to examine the impact of unexpected future changes such as cargo volume, construction cost, inflation or exchange rate. The following cases are examined
51 Case 1 Investment costs increase by 10 %. Case 2 Revenues decrease by 10 %. Case 3 Investment costs increase by 10 %, and revenues decrease by 10 %. Case 4 All the dredging costs are born by the government and thus exempted from the financial analysis Results of the sensitivity analysis is shown in Table I all cases, FIRR exceeds the weighted average interest rate of loan (3.55% per annum). FIRR will significantly improve if IPC is exempted from the entire dredging costs (See Case 4). Table FIRR Sensitivity Analysis (Exchange rate of convenience at US1$=Rp6,000) Case Jambi Base Case Jambi High Public Case Original case 6.8% 7.1% Case 1 5.9% 6.2% Case 2 5.3% 5.6% Case 3 4.5% 4.7% Case % 8.9 % (3) Financial Soundness of Executing Agency Together with the above-mentioned financial analysis, overall financial soundness of IPC2 was assessed to confirm the feasibility of the project. In the assessment, current financial statement, loan repayment programs and income prospects for the future were evaluated. Projected financial statements and financial indicators for IPC2 are shown in Table and Table ) Profitability The rate of return on net fixed assets exceeds the weighted average interest rate of the funds in each case. 2) Loan Repayment Capacity The debt service coverage ratio exceeds 1.75 (World Bank Standard) during the project life. 3) Operational Efficiency The operating ratio keeps below 70% (World Bank Standard) and working ratio also keeps below 50% ( World Bank Standard ). This means that the operation at port will be efficient Conclusion Judging from the above analysis, the project can be regarded as financially feasible. And the financial soundness of executing agency, namely IPC2 is considered to be sound. However, the new terminal management entity should make efforts to heighten the quality of the service, to improve cargo handling efficiency, to secure the forecast cargo volume, and to reduce operating expenses

52
53
54
55