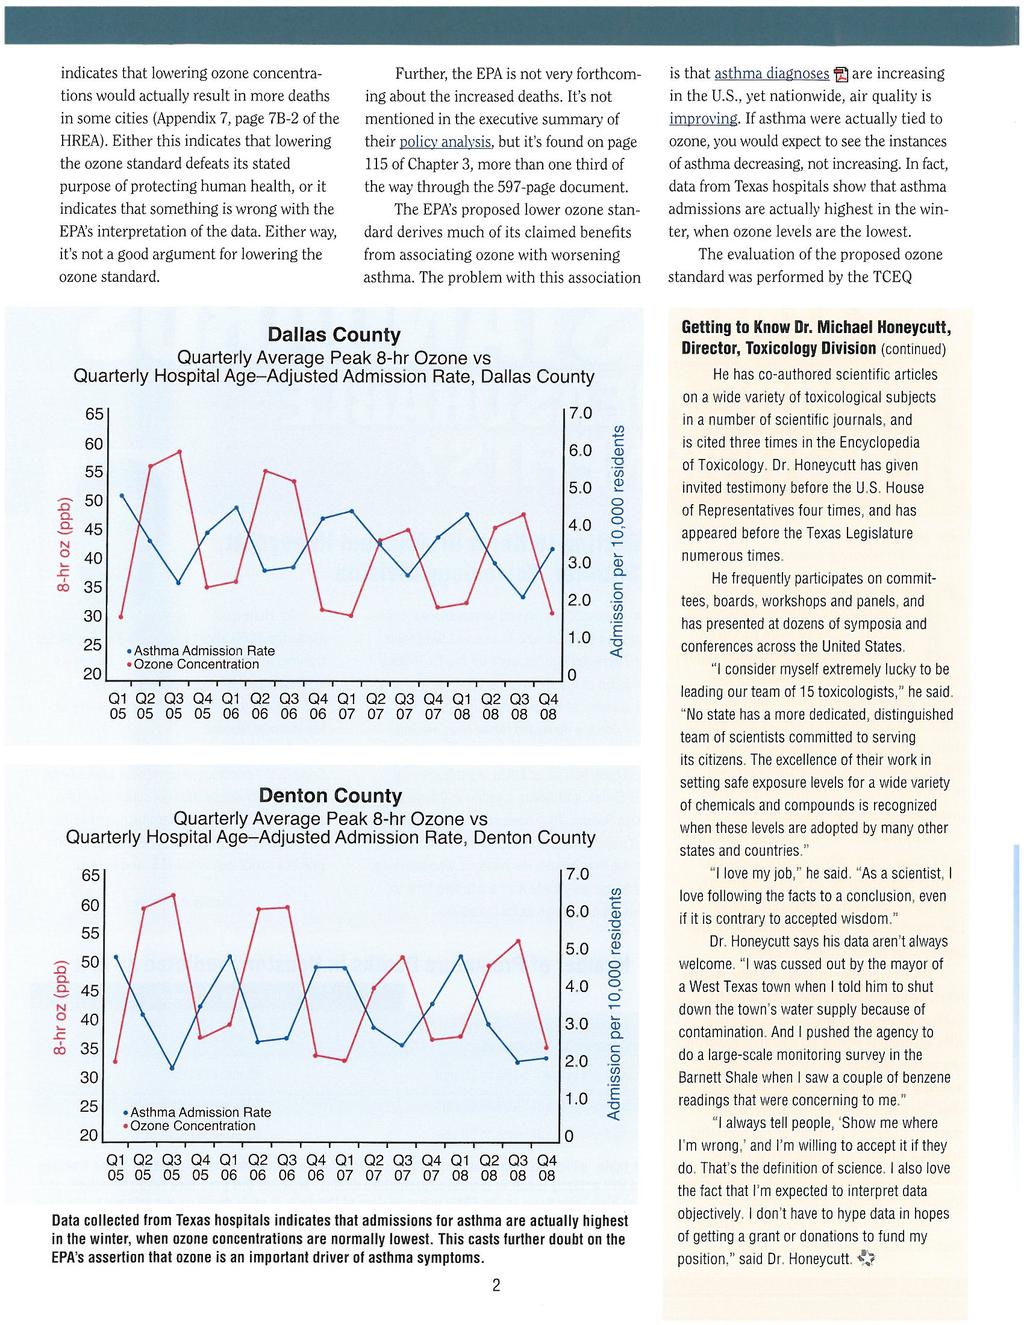
4. Consider and act upon approval of the October 22, 2014 minutes
|
|
|
- Easter Walsh
- 5 years ago
- Views:
Transcription
1 Agenda Alamo Area Council of Governments Air Improvement Resources Executive Committee Wednesday, January 28, :30 a.m. Al J. Notzon III Board Room 8700 Tesoro Drive San Antonio, TX Meeting Called to Order 2. Roll Call 3. Citizens to be Heard 4. Consider and act upon approval of the October 22, 2014 minutes 5. Consider and act upon election of a Chair and Vice-Chair for the Air Improvement Resources Executive Committee 6. Ozone Standard A. Air Quality 101 B. Consider and act upon forwarding comments to EPA in response to the new proposed ozone standard C. Consider and act upon asking EPA for a response to TCEQ s letter on how the proposed lower ozone standards will not accomplish its stated goal of protecting human health 7. Consider and act upon membership recommendations for the AIR Advisory Committee: Kimberly B Dennis CEMEX Christopher Ashcraft - South Texas Energy & Economic Roundtable (STEER) 8. AIR Public Education Committee update A. Consider and act upon Air Quality Stewardship Award recommendations from the AIR Public Education Committee. 9. Consider and act upon EPA s response to the AIR Committee s Path Forward Letter
2 10. Questions from the October 22, 2014 meeting of the Air Improvement Resources Executive Meeting A. Vehicle Emission Standards B. Eagle Ford Emission Inventory C. TERP Funding Allocation and TERP Projects D. Economic Impact of Non-Attainment E. Floresville and Karnes County Monitors 11. Next Meeting, April 22 th, Adjournment. This meeting is accessible to disabled persons. The accessible entrance is located at the front entrance of 8700 Tesoro Drive. Accessible parking spaces are also available. Please contact AACOG for auxiliary aids and services for the hearing impaired, including interpreters for the deaf, at (210) at least 48 hours prior to the meeting or by calling Texas Relay at for assistance.
3 Agenda Item 4: Consider and act upon approval of the Jan. 28, 2015 minutes. Minutes of the Air Improvement Resources Executive Committee Meeting Alamo Area Council of Governments Wednesday Jan. 28, 2015 at 8:30 a.m. Al J. Notzon III Board Room 8700 Tesoro Drive, Suite 100 San Antonio, Texas Committee Members Mayor John Williams, Vice Chair, Universal City Judge Marvin Quinney, Wilson County Mayor Chris Riley, Leon Valley Judge Nelson Wolff, Bexar County Judge Diana J. Bautista, Atascosa County AACOG Saff Brenda Williams, Interim Director of Natural Resources Steve Smeltzer, Environmental Manager Annette Prosterman, Transportation Coord. Parviz Nazem, Environmental Modeler Nic Jones, Clean City Coordinator Guests Present Darcie Schipull, TxDOT Samuel Kline, JBSA, Lackland Liza Meyer, City of San Antonio Chris Ashcraft, STEER, VP Craig Taylor, Communities for Veterans Russell Seal, Sierra Club Randy Waclawczyk Adam Gratzer, Project Manager, Communities for Veterans Peter Bella 1. Meeting called to order. Mayor John Williams, Vice Chair, called the meeting to order at 8:09 a.m. 2. Roll call. A quorum was achieved. 3. Citizens to be heard. There were no citizens to be heard. 4. Approval of Minutes. Judge Diana J. Bautista made a motion to approve the minutes of July 23, 2014 as amended and Mayor Chris Riley seconded the motion. The motion carried and the minutes were approved unanimously. 5. Ozone Standard A: Ozone Report Steven Smeltzer provided an update of local ozone measurements. He stated that the 2014 ozone season has been good in terms of ozone readings at San Antonio s monitors since the annual fourth highest daily maximum 8-hour concentration remained within the national standard. He mentioned that measured ozone levels at each monitor within an area must not exceed 75 ppb according to this standard. He reported a 69 ppb ozone reading for CAMS58, 68 ppb for CAMS23, and 63 ppb for CAMS59 as the 2014 fourth highest daily maximum 8-hour concentration for these regulatory monitors. He stated when the results of 2012, 2013, and 2014 are averaged over 3 years to determine the design values for each regulatory monitor, CAMS58, located at Camp Bullis, is in violation of the federal ozone standard under the Clean Air Act having a 3 year average of 79 ppb. Due to the review period EPA is in where they are Air Improvement Resources Executive Committee Page 1 October 22, 2014
4 Agenda Item 4: Consider and act upon approval of the Jan. 28, 2015 minutes. considering a new standard, the agency is not making designations under the 2008 standard. Therefore, despite the region s violation of the 2008 standard due to high values in 2012 and 2013 of the averaging period, we have not been designated nonattainment. The 2014 calendar year is not complete and there is a chance of having high values at the end of the season, but weather forecasts indicate conditions through October that do not favor high ozone values. B: Ozone Standard Updates Mr. Smeltzer also discussed revision of the ozone standard by the EPA. He explained that periodic revisions are required by the Clean Air Act and the current standard of 75 ppb might be lowered to a level between 60 to 70 ppb, as it is deemed inadequate. On Aug. 29, 2014 the EPA published a 597-page report, which cites the scientific data for revising the national standard for ozone. There is a court order for EPA to issue the new ozone standard by December 1, 2014, but currently we do not what level will be chosen as the new standard, or even whether the old standard will remain in effect. He anticipated that the region s design value, most likely, will be based on values from 2014 to 2016 after the release of the new ozone standard, which is advantageous to the San Antonio region, as the values for 2012 and 2013 are considerably higher than that of If the region does not meet the revised standard and is designated under the new standard, then a SIP must be submitted by October 1, If the region wants to be in a good position by 2020, we ll need to implement air quality control strategies much earlier than this date. Judge Wolff asked what factors contributed to the drop in maximum ozone values in Mr. Smeltzer stated that favorable meteorological conditions, with windy days and cloud coverage, helped keep ozone levels low. Judge Wolff asked Mr. Smeltzer to explain the role of wind and Mr. Smeltzer said the two monitors that usually record the highest ozone values are the C58 and C23 monitors in northwest San Antonio. These are typically the downwind monitors based on predominant ozone season wind directions, and if wind speeds are very low and have brought a fair amount of transported pollutants, we typically experience high ozone values in our region. He explained that for high ozone days in June, the region often gets long range transport from the southeast, which when combined with local ozone precursors, generate high levels of ozone. Of the total ozone precursors in our air during that timeframe, about 25 percent are generated locally and 75 percent are transported. For the months of August and September, quite often the region receives transport within the state, particularly from areas along the I-35 corridor northeast of the city. During this timeframe, precursors typically originate from cities, power plants, and other industrial facilities along the corridor. Wind speed and wind direction are crucial factors with elevated levels of ozone. Judge Wolff asked about the possible impacts of oil and gas exploration in the area and Mr. Smeltzer answered that there has been a report on Eagle Ford Shale emissions describing the photochemical analysis of these emissions, but the results of that report were considered outdated now since so many things have changed since the publication date of that report. A new emission inventory is now being developed and photochemical modeling will be done to assess the impacts of oil and gas exploration in the vicinity of our region. Judge Wolff asked about automobile emissions tests as a possible effective control strategy, but Mr. Smeltzer cautioned that today s cars are much cleaner than 10 years ago and the effectiveness may not be as much as expected. He mentioned however, the Austin area does have a 2- speed idle emission test in effect. Air Improvement Resources Executive Committee Page 2 October 22, 2014
5 Agenda Item 4: Consider and act upon approval of the Jan. 28, 2015 minutes. Judge Wolff asked how many counties will be affected if the area is designated non-attainment by the EPA and Mr. Smeltzer pointed out that the San Antonio- New Braunfels MSA, comprising 8 counties would be the basis for the non-attainment designation, but there is a possibility that some counties might be exempted, as it happened with the Wilson County in the past, or some counties might be added if need be. Judge Wolff asked how the design values that are used for non-attainment designation are calculated and Mr. Smeltzer said the average of the fourth highest eight-hour average ozone values for 3 consecutive years at each regulatory monitor will determine the fate of the region. If one monitor is showing values above the national standards, then the whole MSA will be considered in non-attainment of the national standards. Mr. Smeltzer pointed out that the newer monitors in southern parts of the MSA are not for measuring NOx or ozone, rather they are installed there for measuring VOCs. Judge Wolff asked why they were not measuring ozone and Mr. Smeltzer stated that TCEQ maintains those monitors and they should be able to address that question. Mayor Riley, of Leon Valley asked what SIP stood for and Mr. Smeltzer explained that it was an acronym for State Implementation Plan. The plan describes how a region will reduce pollution in areas that the EPA designates as non-attainment. C. EPA Denied Earthjustice/Sierra Club Petition to Redesignate Areas for the 2008 Ozone NAAQS Mr. Smeltzer summarized a letter that environmental groups had sent to the EPA asking why certain areas, including the San Antonio- New Braunfels MSA, are not being designated as nonattainment, while their ozone records show exceedances. The EPA responded that there are no plans for continuing to make new designations under the 2008 standard. In addition, the federal agency expects these areas to benefit from newly adopted vehicle emission standards (Tier 3) and their own initiatives which will likely help them improve air quality before the decision on new air quality standards is made. 6. Consider and act upon membership recommendations for the AIR Advisory Committee: Russell Seal of Sierra Club, Peter Bella representing ImagineSanAntonio, and Brenda Williams of AACOG were suggested as additional Air Improvement Resources Advisory Committee members. Each was given about a minute to introduce themselves, and a motion to approve membership was made by Judge Diana J. Bautista which was seconded by Mayor Chris Riley. The motion passed unanimously. 7. Consider and act upon Resolution of Priorities for the 84 th State Legislature Mr. Smeltzer gave a summary of 5 priorities that have been outlined by AACOG and reviewed by the AIR Technical and AIR Advisory committees. These were as follows: Assure the Rider 8 funding proposed by the Texas Commission on Environmental Quality (TCEQ) for the biennium provides parity in funding for local air quality planning activities to reduce ozone in the state s regions as reflected in the current appropriations act; Ensure the rider 8 funding continues even if a region is designated nonattainment by the EPA; Air Improvement Resources Executive Committee Page 3 October 22, 2014
6 Agenda Item 4: Consider and act upon approval of the Jan. 28, 2015 minutes. Appropriate all funds collected for the Texas Emission Reduction Plan (TERP) program to that program and include proportionate funding for the San Antonio region; Require TCEQ to demonstrate, through photochemical modeling, that Air Permits by Rule do not interfere with meeting National Ambient Air Quality Standards (NAAQS) in attainment areas and require balancing mitigation measures to ensure no adverse air quality impacts to the State or San Antonio regional air quality attainment goals; and Allocate funding to the San Antonio Metropolitan Health District to develop and manage a formal, objective epidemiological study to identify the impact of air quality in the AACOG region on public health. Mr. Smeltzer stated that if the region is declared in non-attainment of air quality standards the flow of CMAQ money (highway projects funding) may be interrupted and the intention of these five legislative priorities is to ensure continued resources in support of air quality planning. as well as health issues related to air quality, which the fifth priority is emphasizing. Judge Wolff was interested in knowing how much money was available through TERP and Mr. Smeltzer replied hundreds of millions of dollars, but did not have the exact number. The TERP money is available for replacing old non-road equipment and for purchasing alternative fuel non-road equipment. Judge Bautista asked if item 4 on the list of priorities was of interest to other COG s in the state of Texas, or other affected cities in the State and Mr. Smeltzer answered that AACOG is working with other COG s on this list of priorities, including CAPCOG in Austin. Mayor Riley asked if funding for item 5 on the list is part of TCEQ s budget and Mr. Smeltzer answered it will not be part of Rider 8, rather as additional expanses to the State. Mayor Riley made a motion to approve the resolution and Judge Bautista second the motion. The committee approved the list unanimously. 8. AIR Public Education Committee update A: Consideration and possible action on recommendation from the AIR Public Education Committee to transition from the name 'Air Quality Health Alert' to 'Ozone Action Alert' Annette Prosterman, of AACOG, spoke of TCEQ s recent decision to use the term Ozone Action Day universally throughout Texas and replace local variations such as San Antonio s Air Quality Health Alert. Ms. Annette Prosterman asked the Committee to approve a gradual transition, over a three-year period, from using Air Quality Health Alert to the state-wide Ozone Action Day alert. A motion was made by Mayor Riley to accept the AIR Public Education Committee s recommendation and use Ozone Action Day instead of a local variation. The motion was second by Judge Bautista. The committee approved the motion unanimously. B. AIR Public Education Committee update: Results of the 2014 Walk & Roll Challenge In the interest of time, Ms. Annette Prosterman asked the Committee to refer to the press release on the results of the 2014 Walk & Roll Challenge that was included in the meeting s handout package. She emphasized that the event was successful. 9. Ozone Impact Assessment Air Improvement Resources Executive Committee Page 4 October 22, 2014
7 Agenda Item 4: Consider and act upon approval of the Jan. 28, 2015 minutes. Mr. Smeltzer gave a slide presentation showing the results of a series of photochemical model runs with the goal of forecasting the region s ozone levels in the year 2018 and predicting the affects of Eagle Ford Shale activities and emissions generated in San Antonio for this forecasting year. He stated the following model runs were completed and the results were processed: Eagle Ford Shale runs (6 runs low, moderate, and aggressive growth scenarios) Zero out run for the San Antonio MSA 25% NO X reduction, 2018, 75% NO X reduction, 2018, 25% VOC reduction, 2018, 50% VOC reduction, 2018, 75% VOC Reduction, 2018, 25% VOC and NO X reduction, 2018, 50% VOC and NO X reduction, 2018 Mr. Smeltzer explained the results of completed model runs, which indicate that reducing VOC emissions in the area has minimal impact on ozone levels; whereas, reducing NOx emissions by 25%, 50%, and 75% will reduce the design values for the C58 monitor to 71 ppb, 66 ppb, and 61 ppb in 2018, respectively. The simultaneous reduction of VOC and NOx is predicted to have nearly the same effect of reducing NOx only, signifying the fact that our region is not VOC sensitive and the air quality control strategies for ozone must be geared towards reducing NOx. Mr. Smeltzer showed a bar chart that depicted the results of his photochemical modeling runs for a base case scenario in According to this model run, if the ozone standard is reduced to 70 ppb in 2018, two out of three regulatory monitors will show values exceeding the standard. The 2018 predicted design values for C23 and C58 are 71.2 and 74.4, respectively. The bar chart also showed that if all emissions generated in San Antonio are removed from the model, the three monitors will have design values close to 53 ppb. This demonstrates the impact of local anthropogenic pollutants on future ozone levels for this modeling episode. Judge Quinney asked if flaring of gas and oil exploration emissions contributes to ozone. Mr. Smeltzer pointed out that flaring releases mostly NOx, although some VOC emissions are also emitted if flare combustion is not complete. Knowing that NOx has a significant impact on ozone formation, flare emissions may negatively impact ozone levels recorded by our monitors. Mr. Smeltzer also said that he was planning to send the results of the Eagle Ford emission modeling to Judge Wolff, but he will send it to all Committee members. Judge Wolff was interested to know what chemicals are released when natural gas is burned by flaring. Mr. Smeltzer answered various types of gases. Judge Wolff asked so either burn it or release it in the environment. Mr. Smeltzer replied most of, if not all of, the oil and gas producers are flaring, trying to avoid release of natural gas into the atmosphere. Judge Quinney was interested to know why TCEQ was not monitoring everything generated in Eagle Ford area instead of just VOCs. Mr. Smeltzer replied it costs $130,000 annually to monitor VOC, whereas NOx or ozone monitors are much cheaper. He also said he did not know why TCEQ is not monitoring NOx or ozone there. 10. Ozone Advance Ms. Brenda Williams of AACOG gave a brief description of issues associated with the Ozone Advance Program. She began with an overview of the program and provided a comparison between Ozone Advance and an earlier EPA program in which the region participated, the Early Action Compact program. This plan does not offer us protection, nor does it guarantee that future ozone violations will be avoided, or a designation of non-attainment will not occur. She mentioned that the first step in program participation, submittal of a letter of intent, had been Air Improvement Resources Executive Committee Page 5 October 22, 2014
8 Agenda Item 4: Consider and act upon approval of the Jan. 28, 2015 minutes. provided to the EPA in 2012 and that the second step, the Path Forward, had been approved by the AIR Executive Committee and submitted to EPA in According to the EPA, the Path Forward fully describes the measures that a region intends to adopt in order to help a region maintain compliance with the NAAQS. She added that the third step is implementation of the control strategies described in the Path Forward and that EPA recommends that participating regions submit periodic updates to the document, at least annually. The reports should provide evaluations of the success of adopted control strategies, discuss additional measures, and explain needed adjustments or use of lessons learned. In response to the region s submission of the Path Forward in July 2013, EPA provided AACOG with a list of recommendations for updating the plan. The EPA asked for clarification on some items and identified omissions based on the protocol that EPA developed for the Path Forward content. During the September AIR Advisory and Technical Committee meetings, Ms. Williams asked the membership to review the list and provide updates pertaining to their organizations. The current Region s Path Forward document, which was included in the handout package, represents their input as well as information that AACOG staff compiled to address the EPA s recommendations. Ms. Williams briefly went over EPA s recommendations for the Path Forward. These included concerns over the lack of additional control strategies in the region. While EPA encouraged regions to describe their on-going measures in the document, they also wanted areas to list new and proposed controls. The new version of the 2014 Path Forward document addresses those concerns; Chapter 3 provides a list of on-going control strategies, plus any added enhancements, and any updates that member organizations reported to AACOG. Chapter 4 provides a list of new and proposed strategies. Ms. Williams mentioned that the EPA noticed a lack of information about outreach and educational programs and wondered why programs like Air Quality Health Alert were not included in the Plan. The EPA asked whether or not the region had a Banner program, or advertising plans. These programs, referred to as Outreach programs have now been included in the new Path Forward document at the end of Chapter 3. Also, all the items listed below were added to the background chapter (Chapter 2), as recommended by the EPA: Population Emissions data Design Value trends Map of the region Map of ozone monitor locations List of key stationary sources Map of most-traveled highways Ms. Brenda Williams asked the Committee to consider approval of the 2014 Path Forward document for submission to the EPA. Since the document can be updated any time during the year, modifications and additions can be submitted later on should other organizations wish to add their activities. Mayor Williams asked if that meant the region can submit a basic document and continue adding to it and Ms. Williams answered yes. Mayor Williams asked whether all of EPA s concerns had been addressed. Ms. Williams answered that some stakeholders had not provided their responses and additions in time, but that their input could be included in the next version of the Path Forward. Mayor Williams asked: What you have received, then, you put into this document? Ms. Williams confirmed that they had. Air Improvement Resources Executive Committee Page 6 October 22, 2014
9 Agenda Item 4: Consider and act upon approval of the Jan. 28, 2015 minutes. Mr. Smeltzer added that the control strategy list provided in Appendix B of the document had originally been prepared in response to a request by Judge Wolff. Mayor Williams stated that the 2014 Path Forward is a comprehensive document and asked whether AACOG was expecting the committee to approve the current version. Ms. Williams replied affirmatively and added that EPA recommended that participating regions make a five year commitment to the program and during that time, their Path Forward plans are considered living documents to be updated as appropriate. A motion was made by Mayor Riley, which was seconded by Judge Bautista. The motion passed unanimously. 11. Consider and act upon approval of the 2015 meeting schedule Mr. Smeltzer addressed the last sheet in the meeting s handout package, which listed the 2015 scheduled meetings dates for the various AIR committees. He added the AIR Executive Committee meetings will continue to be held on the same dates as the AACOG Board meetings in the next year. He mentioned that AACOG used to have a monthly meeting schedule for the AIR Technical Committee, but due to lack of funding, these cannot be held monthly. Mayor Riley asked if the Executive Committee meeting time would be around 8:00 a.m. like this meeting, or some other time and Mr. Smeltzer answered that meetings are normally held at 8:30 a.m. or 9:00 a.m. Judge Bautista made a motion to accept the proposed meeting dates for 2015 with any options that may occur at later times on dates and meeting times. The motion was seconded by Mayor Riley. This meeting was the last meeting in which Judge Quinney and Judge Bautista would attend and those present thanked them for their service. The meeting was adjourned at 9:10 a.m. Air Improvement Resources Executive Committee Page 7 October 22, 2014
10 1/23/2015 Clean Air Act Air Quality 101 Steven Smeltzer, Environmental Manager Alamo Area Council of Governments January 28 th, 2015 The Federal Clean Air Act requires Environmental Protection Agency (EPA) to set National Ambient Air Quality Standards (NAAQS) for pollutants considered harmful to public health and the environment. EPA has set NAAQS for six principal pollutants, which are called "criteria" pollutants. The Clean Air Act requires primary standards to be requisite to protect public health with an adequate margin of safety, including the health of groups of people considered d more at risk. The Clean Air Act bars EPA from considering cost in setting the NAAQS. Source: EPA, Dec Proposed Revisions to National Ambient Air Quality Standards for Ozone. Available online: Establishing the Standard The law requires EPA to review the NAAQS every five years. The Clean Air Act outlines a 2-step process for setting and then meeting standards. Step 1: Setting the standards, which requires EPA to conduct an extensive scientific review to determine whether new standards are necessary to protect public health and welfare. Step 2: Implementing the standards, which involves states putting measures and programs in place to reduce harmful pollution to meet the standards. San Antonio New Braunfels MSA Region Compliance with 75 ppb Eight Hour Ozone Standard Regulatory Ozone Monitor Sites in Bexar County 4th Highest Reading Current 3 Year Average 2012 (ppb) 2013 (ppb) 2014 (ppb) Camp Bullis C San Antonio NW C Calaveras Lake C The hr. average Ozone National Ambient Air Quality Standard: The annual fourth-highest daily maximum 8-hour concentration, averaged over 3 years, measured at each monitor within an area must not exceed ppm. Source: EPA, Dec Proposed Revisions to National Ambient Air Quality Standards for Ozone. Available online: Available online: Available online: EPA s Proposed Ozone Standard Timeline Nov. 25, 2014: EPA's Released a proposal to Update the NAAQS for Ground-Level Ozone Court Order Requirement EPA proposes the 8-hour standards to be set within a range of 65 to 70 parts per billion (ppb). EPA is seeking comment on levels as low as 60 ppb. Dec. 17, 2014 Rule is published in the Federal Register Jan. 29 and Feb. 2, 2015: 3 Public Hearings on the Proposed Ozone Standard including public hearing in Arlington, Texas on Jan. 29 th March 17, 2015: Comments are due to the EPA on the Proposed Rule Oct. 1, 2015: Court-ordered deadline for EPA to issue the final ozone standard Oct. 1, 2017: EPA determination of attainment or non-attainment for affected areas (may be based on 2014, 2015, and year average) Oct : SIP elements for non-attainment areas are due Dec. 31, 2020: Attainment deadline for Marginal areas Dec. 31, 2023: Attainment deadline for Moderate areas 1


11 1/23/2015 Ground Level Ozone Ground Level Ozone is the main component of smog. It is not emitted directly into the air but forms when emissions of precursors, including nitrogen oxides (NO X ) and volatile organic compounds (VOCs) cook in sun light. Emissions from industrial facilities, electric utilities, motor vehicle exhaust, gasoline vapors, and chemical solvents are major human-made sources of NO X and VOCs. EPA Proposed Non Attainment Boundary if the Region is declared in violation of the Ozone NAAQS San Antonio New Braunfels MSA: Atascosa, Bandera, Bexar, Comal, Guadalupe, Kendall, Medina, and Wilson Counties Mandatory control strategies to reduce ozone are implemented within the region contained in the final nonattainment boundary Source: EPA, Dec Proposed Revisions to National Ambient Air Quality Standards for Ozone. Available online: Photochemical Modeling of Ozone Computer simulation of the formation and movement of ozone Our best diagnostic tool to understand effective control strategies Predicted 2018 Design Value for the San Antonio-New Braunfels MSA CAMS58 Monitor: 74.4 ppb Predicted Daily Maximum 8-hour Ozone Concentrations in the 4-kilometer subdomain: June 9th, 2006 Base Case Modeling Run Predicted 8 hour Ozone Design Values C58 Ozone Monitor, 2018 Funding for 25%, 50%, and 75% reductions is provided by the Alamo Area MPO EPA Requirements for Ozone Nonattainment Areas Monitoring Sites the San Antonio New Braunfels MSA 2


12 1/23/2015 Air Improvement Resources (AIR) Committee Population vs. VOC and NO X Emissions Trends San Antonio New Braunfels MSA AIR Technical Committee Technical considerations of relative reductions in ozone precursors, impacts AIR Advisory Committee Business and Industry Considerations Of Cost, Feasibility AIR Executive Committee Oversight of Process Final Agreement & Authorization Work with EPA, TCEQ Air Improvement Resources (AIR) Executive Committee Next Meeting: 8:30 AM, Jan 28 th, 2015: AACOG, 8700 Tesoro Dr., Predicted 8 hour Ozone Design Values, 2018 Ozone Standard History March 27, 2008: EPA revises primary and secondary ozone standards from 84 ppb to 75 ppb (8-hour average). In 2013, the D.C. Circuit remanded the secondary standard to the Agency for reconsideration because the Agency did not determine what level of protection was requisite to protect the public welfare. January 19, 2010: EPA proposes to reconsider the 2008 ozone standard. Change primary standard to within range of 60 to 70 ppb. Change secondary standard to cumulative seasonal standard within range of 7 to 15 ppm-hours. September 2, 2011: January 2010 proposal is withdrawn and EPA focuses on upcoming 5 year review. June 19, 2013: Coalition of public health and environmental groups, including Sierra Club and ALA, file lawsuit in federal court asking court to set deadline for action on overdue ozone standards. April 29, 2014: U.S. District Court in San Francisco orders EPA to issue new ozone standards (proposal by Dec.1, 2014, final by Oct.1, 2015). Funding for zero out run is provided by the Alamo Area MPO Source: EPA, Dec Proposed Revisions to National Ambient Air Quality Standards for Ozone. Available online: 3
13 1. EPA should delay nonattainment designations for the revised ozone standard until 2018 to allow regions to benefit from the implementation of federal air quality controls which will occur in Due to monitoring uncertainty, EPA should allow +15% ppb variance in the calculated design value used to determine attainment. EPA allows +/- 15% error in data accuracy for approving the calibrations of ozone monitors. 3. EPA should consider the number of exceedance days allowed by other industrialized nations when implementing the ozone standard. 4. EPA should consider rigorously monitoring and evaluating data of all areas, both attainment and nonattainment areas, to understand intrastate and interstate transport and protect downwind areas that might be significantly affected by transported emissions. 5. EPA should recognize the role of interstate, intrastate, and international transport in the calculations and implementation of ozone standards. Moreover, those agencies responsible for air quality management beyond the San Antonio New Braunfels MSA must provide appropriate reductions to assist the local nonattainment region s efforts to regain attainment status. 6. Permitting rules need to require an evaluation of ozone impacts using photochemical grid modeling. Permits should be modified or denied if adverse health impacts or violations of the NAAQS will occur either downwind or within a given attainment/nonattainment area as a result of permit action. 7. When setting the attainment date for areas downwind of other nonattainment areas, consideration should be given to allow appropriate control strategy implementation in the upwind areas as necessary to allow the downwind area to achieve compliance
14 Air Improvement Resources Committee 8700 Tesoro Drive, Suite 700 San Antonio, Texas (210) fax Hon. Ron Nirenberg Chair, AIR Executive Committee City of San Antonio Councilman Hon. Chris Riley Vice-Chair AIR Executive Committee Alamo Area MPO, City of Leon Valley, Mayor Hon. Richard L. Jackson Wilson County Judge Hon. Jim Wolverton Guadalupe County Commissioner Hon. Sherman Krause Comal County Judge Hon. Nelson Wolff Bexar County Judge Hon. Robert L. Hurley Atascosa County Judge Hon. John H. Williams Greater Bexar County Council of Cities Universal City Mayor Hon. Mike Fincke, AACOG Board of Directors Kendall County Commissioner Resolution WHEREAS, the San Antonio region, acting together through the Air Improvement Resources (AIR) Committee hosted by the Alamo Area Council of Governments, was one of the first regions to partner with the US Environmental Protection Agency (EPA) by signing an Early Action Compact (EAC), and continues to work proactively to improve regional air quality and reduce ozone-forming pollution; WHEREAS, in order for the AACOG region to be in compliance with national ambient air quality standards for ground-level ozone, the impacts of transport 1) which originates within Texas but outside of the San Antonio-New Braunfels Metropolitan Statistical Area (SA-NB MSA); 2) which impacts regulatory monitors in Bexar County; and 3) for which the emission sources are under the control of the state of Texas; must be determined, agreed upon by affected stakeholders, and addressed in a proactive and effective manner by the state. Similarly, transport under federal control which impacts the AACOG region must be determined and addressed in a proactive and effective manner by the federal government. The AIR Committee is dedicated to working jointly with the Texas Commission on Environmental Quality (TCEQ) and the U.S. Environmental Protection Agency (EPA) to address both intrastate and interstate air pollution in order to reduce ozone levels in the AACOG region; WHEREAS, international transport is suspected as a contributing factor to background ozone levels impacting local regulatory monitors, the AIR Committee is dedicated to supporting the EPA in addressing globally-produced international transport in order to reduce ozone levels in the AACOG region. The AIR Committee will remain proactively engaged with TCEQ and EPA in the identification of ozone events and episodes which may give rise to appropriate exemption under Title I, Part D, 179B International border areas 1 of the Clean Air Act; WHEREAS, given the effects of transport, EPA should work with states to consider changing the permitting of and the effects of significant pollution sources from which emissions are transported over hundreds of miles. For example, Dallas- Fort Worth (DFW) area is a moderate" 8-hour ozone nonattainment under the ppm 2008 standard. It is not practical to allow nonattainment areas such as DFW to reach attainment by December 31, 2018 while mandating those areas such as central Texas to demonstrate attainment despite overwhelming transport from DFW and other nonattainment areas; 1 See 42 U.S. Code 7509a - International border areas, Also, for reference to 179B International border areas under the Clean Air Act, see the index of Title I - Air Pollution Prevention and Control to the Clean Air Act,
15 WHEREAS, in the case that a nonattainment area is downwind of one or more upwind nonattainment areas and is adversely impacted by transport from the upwind area(s), when setting the attainment date for the downwind area, consideration should be given to allow appropriate control strategy implementation in the upwind area(s) as necessary to allow the downwind area to achieve compliance. For example, the range of classifications for ozone nonattainment areas allows more time to reach compliance for those areas with greater ambient levels of ozone as determined by their design values. This can work against areas which are downwind and which must show attainment earlier than upwind areas. The consideration requested could, as appropriate, establish a timeline for implementation of control strategies in the upwind area consistent with 1) the impacts of transport on the downwind area, 2) possible changes to the deadline for compliance of either area (e.g., giving the downwind area more time to achieve attainment), and 3) air quality planning in the downwind area; WHEREAS, the region opted to participate in the EPA s Ozone Advance Program and submitted to the EPA a Path Forward plan that describes voluntary emissions reduction measures such as industrial controls, energy conservation, cleaner fleets, renewable energy investments, and transportation enhancements that encourage walking, cycling, and mass transit implemented by local governments, utilities, industries, businesses, and organizations and also describes continuing efforts to identify and quantify the benefits of other appropriate voluntary measures for consideration by local entities; WHEREAS, the AIR Committee objected in 2010 to the EPA s proposal to revise the 8- hour average ozone standard below 75 parts per billion (ppb) and the EPA requests comments only on the level of the 8-hour standard, which was set at 75 ppb in the primary and secondary standards of the 2008 final rule. NOW THEREFORE BE IT RESOLVED THAT: 1. EPA should delay nonattainment designations for the revised ozone standard until 2018 to allow regions to benefit from the implementation of federal air quality controls which will occur in 2017, such as the Tier 3 vehicle and fuel standards, increased turnover of non-road equipment to Tier 4 standards, and other federal controls. 2. Due to monitoring uncertainty, EPA should allow +15% ppb variance in the calculated design value used to determine attainment. EPA allows +/- 15% error in data accuracy for approving the calibrations of ozone monitors. 3. EPA should consider the number of exceedances allowed by other industrialized nations when implementing the ozone standard. For example, the European Union states that the maximum daily 8-hour mean concentration of ozone should not exceed 120 μg/m3 (60 ppb) on more than 25 days per calendar year averaged over three years EPA should consider rigorously monitoring and evaluating data of all areas, both attainment and nonattainment areas, to understand intrastate and interstate transport and protect downwind areas that might be significantly affected by transported emissions. Transport significantly impacts local ozone concentrations. Unfortunately, the Clean Air Act relies on implementation of 2 Air Quality in Europe 2011 report, European Environmental Agency, 11/12/2011. Online:
16 local strategies for an area to regain attainment, but at this time, no combination of local strategies has been demonstrated as being effective enough for the San Antonio New Braunfels MSA to reach attainment without concurrent reductions in transport. 5. EPA should recognize the role of interstate, intrastate, and international transport in the calculations and implementation of ozone standards. While we welcome discussions with the EPA on methods to mitigate local contributions to ozone formation, we cannot enact reduction strategies which act beyond our jurisdiction. Moreover, those agencies responsible for air quality management beyond the San Antonio New Braunfels MSA must provide appropriate reductions within their jurisdictions and authorities, as required, to assist the local nonattainment region s efforts to regain attainment status. 6. Permitting rules need to require an evaluation of ozone impacts using photochemical grid modeling. Permits should be modified or denied if adverse health impacts or violations of the NAAQS will occur either downwind or within a given attainment/nonattainment area as a result of permit action. 7. When setting the attainment date for areas downwind of other nonattainment areas, consideration should be given to allow appropriate control strategy implementation in the upwind areas as necessary to allow the downwind area to achieve compliance. PASSED and APPROVED this Signed, Councilman Ron Nirenberg, City of San Antonio Chair, AIR Executive Committee Mayor Chris Riley, City of Leon Valley Vice-Chair, AIR Executive Committee

17 Air Improvement Resources Committee 8700 Tesoro Drive, Suite 700 San Antonio, Texas (210) fax Hon. Ron Nirenberg Chair, AIR Executive Committee City of San Antonio Councilman Hon. Chris Riley Vice-Chair AIR Executive Committee Alamo Area MPO, City of Leon Valley, Mayor Hon. Richard L. Jackson Wilson County Judge EPA Docket Center (EPA/DC), Mailcode 28221T, Attention Docket ID No. OAR , 1200 Pennsylvania Ave. NW., Washington, DC January 28, 2015 Subject: National Ambient Air Quality Standards for Ozone: 40 CFR Parts 50, 51, 52, et al., Docket ID No. EPA HQ OAR Dear Administrator McCarthy: Hon. Jim Wolverton Guadalupe County Commissioner Hon. Sherman Krause Comal County Judge Hon. Nelson Wolff Bexar County Judge Hon. Robert L. Hurley Atascosa County Judge Hon. John H. Williams Greater Bexar County Council of Cities Universal City Mayor Hon. Mike Fincke, AACOG Board of Directors Kendall County Commissioner In response to the EPA s request for public comment on the proposed ozone NAAQS, the members of the Air Improvement Resources Executive Committee, whose membership includes elected officials from the county and city governments of the San Antonio - New Braunfels Metropolitan Statistical Area, encourage EPA to consider the following list of recommendations for the designation process and schedule. The AIR Committee does strongly support the science-based goal of protecting the health of our citizens as our efforts and successes of recent years demonstrate, and we look forward to cooperatively working with the EPA to improve the nation s air quality and our collective public health. 1. EPA should delay nonattainment designations for the revised ozone standard until 2018 to allow regions to benefit from the implementation of federal air quality controls which will occur in 2017, such as the Tier 3 vehicle and fuel standards, increased turnover of non-road equipment to Tier 4 standards, and other federal controls. 2. Due to monitoring uncertainty, EPA should allow +15% ppb variance in the calculated design value used to determine attainment. EPA allows +/- 15% error in data accuracy for approving the calibrations of ozone monitors. 3. EPA should consider the number of exceedances allowed by other industrialized nations when implementing the ozone standard. For example, the European Union states that the maximum daily 8-hour mean concentration of ozone should not exceed 120 μg/m3 (60 ppb) on more than 25 days per calendar year averaged over three years EPA should consider rigorously monitoring and evaluating data of all areas, both attainment and nonattainment areas, to understand intrastate and interstate transport and protect downwind areas that might be significantly affected by transported emissions. Transport significantly impacts local ozone concentrations. Unfortunately, the Clean Air Act relies on implementation of local strategies for an area to regain attainment, but at this time, no combination of local strategies has been demonstrated as being effective enough for the San Antonio New Braunfels MSA to reach attainment without concurrent reductions in transport. 1 Air Quality in Europe 2011 report, European Environmental Agency, 11/12/2011. Online:
18 5. EPA should recognize the role of interstate, intrastate, and international transport in the calculations and implementation of ozone standards. While we welcome discussions with the EPA on methods to mitigate local contributions to ozone formation, we cannot enact reduction strategies which act beyond our jurisdiction. Moreover, those agencies responsible for air quality management beyond the San Antonio New Braunfels MSA must provide appropriate reductions within their jurisdictions and authorities, as required, to assist the local nonattainment region s efforts to regain attainment status. 6. Permitting rules need to require an evaluation of ozone impacts using photochemical grid modeling. Permits should be modified or denied if adverse health impacts or violations of the NAAQS will occur either downwind or within a given attainment/nonattainment area as a result of permit action. 7. When setting the attainment date for areas downwind of other nonattainment areas, consideration should be given to allow appropriate control strategy implementation in the upwind areas as necessary to allow the downwind area to achieve compliance. The Air Improvement Resources Executive Committee seeks to determine the most prudent path available to our region for meeting federal air quality standards. It is important to understand how the proposed O3 standard will impact San Antonio, Texas in our planning process as we work together with the EPA and TCEQ to ensure excellent air quality for our citizens with the least local cost and penalty in the process. Sincerely, Councilman Ron Nirenberg, City of San Antonio Chair, AIR Executive Committee Mayor Chris Riley, City of Leon Valley Vice-Chair, AIR Executive Committee
.")
19 San Antonio-New Braunfels Design Value There are 20 regulatory and non-regulatory air quality monitors in the San Antonio-New Braunfels MSA that record meteorological data and air pollutant concentrations, including ozone levels (Figure 1). The data collected at these sites is processed for quality assurance by the Texas Commission on Environmental Quality (TCEQ) and is accessible via the Internet. 2 The 8- hour ozone design values at the three regulatory ozone monitors in the San Antonio-New Braunfels MSA from 2005 to 2014 are provided in Figure 2. The ozone monitors at the C58 and C23 continuous ambient monitoring stations (CAMS) consistently have the highest design values in the San Antonio region. Ozone design values have increased slightly at the C58 monitor from 2009 to 2014 and this monitor is now exceeding the 75 ppb 8-hour ozone standard. Figure 1: Monitoring Sites the San Antonio-New Braunfels MSA 2 TCEQ, Air and Water Monitoring. Austin, Texas. Available online: Accessed 06/26/13.
 are provided in Figure 3. From 2008-2014, the San Antonio-New Braunfels MSA averaged 12.7 days above the 70 ppb proposed standard and 20.")
20 Figure 2: Monitored 8-Hour Ozone Design Values at C23, C58, and C59, The numbers of days per year for which ozone excedances were measured in the San Antonio- New Braunfels Metropolitan Statistical Area (MSA) are provided in Figure 3. From , the San Antonio-New Braunfels MSA averaged 12.7 days above the 70 ppb proposed standard and 20.7 days above the 65 ppb proposed standard. Eight-hour ozone averages recorded at the CAMS 58 monitor exceeded the 75 ppb ozone standard an average of 4.1 days per year from Ozone measurements at the monitor exceeded the 70 ppb proposed ozone standard an average of 9.3 days per year and exceeded the 65 ppb proposed ozone standard 17.1 days per year. Data from the upwind monitors on high ozone days in the San Antonio-New Braunfels MSA indicated they experienced fewer days above each proposed standard than downwind monitors; nevertheless, exceedances of the proposed standards did occur. Ozone measurements at the New Braunfels monitor, CAMS 504, exceeded the proposed 70 ppb ozone standard an average of 2.3 times per year and exceeded the 65 ppb proposed standard 5.6 times per year (Table 1). This indicates that it will be difficult for the San Antonio-New Braunfels MSA to achieve the proposed standards since historical data from upwind monitors exceeds the proposed changes. When ozone readings are reviewed at monitors outside the region, the Big Bend monitor, CAMS 67, exceeded the proposed 70 ppb standard 4.6 times on average per year and exceeded the 65 ppb proposed standard 14.7 times per year. The Big Bend monitor is not located near any large urban areas or any large Texas point source emissions.

21 Figure 3: Number of High Ozone Days per Year Greater than 65 ppb, 70 ppb, and 75 ppb in San Antonio-New Braunfels MSA Ozone Analysis using Photochemical Modeling Ozone analysis was conducted using a photochemical model that simulates actual high ozone episodes which prevailed in a region over the course of several days. The modeling episode currently used for the San Antonio, Austin, and Dallas regions, and undergoing refinement by the Alamo Area Council of Governments, is based on the period of high ozone that occurred from May 31 st to July 2 nd, This photochemical modeling episode was chosen for the modeling effort as it represents a variety of meteorological conditions that are commonly associated with ozone exceedance days. The June 2006 photochemical modeling episode was projected to 2012 and 2018 using updated emission inventory projections. The predicted future design value at the monitor with the highest values in the region, CAMS 58, was below the 75 ppb standard at 74.3 ppb. However, the predicted future design value was higher than either the 70 ppb or 65 ppb proposed standards. When all anthropogenic (human-made) emissions were removed from the 8-county San Antonio-New Braunfels MSA, future predicted design values at the CAMS 58 was 56.2 ppb (Figure 4).
22 Table 1: Number of High Ozone days per Year greater than 60 ppb, 65 ppb and 70 ppb CAMS 504 CAMS 58 CAMS 23 (New Braunfels) Year >60 >65 >70 >60 >65 >70 >60 >65 >70 ppb ppb ppb ppb ppb ppb ppb ppb ppb >60 ppb CAMS 506 (Seguin) >65 ppb >70 ppb >60 ppb CAMS 67 (Big Bend) >65 ppb Average ( ) >70 ppb
 and nitrogen oxide (NO X ) emissions from the San Antonio MSA in the 2018 photochemical modeling projection.")
23 Figure 4: Zero-out runs for all Anthropogenic NO X and VOC Emissions in the San-Antonio New Braunfels MSA, 2018 Across-the-board runs were conducted by removing 25%, 50%, and 75% of the volatile organic compound (VOC) and nitrogen oxide (NO X ) emissions from the San Antonio MSA in the 2018 photochemical modeling projection. Figure 5 provides the results of the across-the-board design value reduction runs for the monitor with the highest ozone design value in the San Antonio-New Braunfels MSA, CAMS 58 at Camp Bullis. The model projects that if NO X emissions were reduced 25% and additional controls already in place or mandated by 2018 are applied to sources outside the MSA, the region would not be able to attain the 70 ppb or 65 ppb proposed standards. To reach the 65 ppb proposed standard, at least a 50% reduction in local NO X emissions is needed. The required reductions will make it very difficult for the region to obtain the 70 ppb or the 65 ppb proposed standards. San Antonio-New Braunfels MSA Emission Inventory As provided in Table 2, point sources are estimated to be the largest sources of NO X emissions in 2018 in the San Antonio-New Braunfels MSA, followed by on-road vehicles. Other sources of NO X emissions include area emission sources and non-road/off-road emissions sources. Total NO X emissions are projected to decrease significantly in the 8-county region from 250 tons of NOX in 2006 to 125 tons of NO X in By far the largest anthropogenic source of VOC emissions is the area source category (Table 3). On-road and non-road sources can also emit significant amounts of VOC emissions.

24 Figure 5: Anthropogenic NO X and VOC Emission Reduction in the San-Antonio New Braunfels MSA, 2018 Table 2: NO X Emissions by Source, San Antonio-New Braunfels MSA, tons/ozone season day Emission Source On-Road Non-Road Area Point Off-road Oil and Gas Equipment Total Table 3: VOC Emissions by Source, San Antonio-New Braunfels MSA, tons/ozone season day Emission Source On-Road Non-Road Area Point Off-road Oil and Gas Equipment Total
25 Back Trajectories Analysis While urban areas typically have many sources of the NO X and VOC emissions that form ozone, their air quality is also influenced by anthropogenic precursors and ozone transported from other areas, perhaps even from long distances. Tracking wind parcels coming into a region helps identify the sources of transported ozone. The Air Resources Laboratory of NOAA maintains the Hybrid Single Particle Lagrangian Integrated Trajectory (HYSPLIT) model that replicates wind dynamics and allows public use via the Internet at their Realtime Environmental Applications and Display System (READY) webpage. 3 This versatile model can be run as a trajectory (parcel displacement) or air dispersion model, using either forecast or archived meteorological data. The HYSPLIT model produces air parcel positions for every hour by latitude, longitude, and height. The back trajectories needed for the analyses of transport were created using this model. The approximate pathways of air entering San Antonio on days of interest were determined using the HYSPLIT model. Figure 6 displays air mass 100-meter back trajectory density counts over 48 hours for air parcels terminating at C58 on days with recorded 8-hour ozone greater than 65 ppb. Given a final geographic destination for an air parcel, back trajectories show the path followed by the air parcel before reaching the destination. Back trajectories track air displacement over time, distance, and emission source regions. These back trajectories demonstrate that, on high ozone days > 65 ppb, it is rare for air arriving at C58 to come from the west, northwest, or southwest. In the San Antonio region, it is common to have stagnated back trajectories on high ozone days arriving in San Antonio from the southeast in the spring and from the northeast in the fall. 3 NOAA, Feb. 26, Realtime Environmental Applications and Display system (READY). Available online: Accessed 05/24/10.

26 Figure 6: Density of Hourly Back Trajectory Bin Counts on High Ozone Days > 65 ppb,
27 6. Ozone Standard B. Consider and act upon forwarding comments to EPA in response to the new proposed ozone standard Ozone Standards in Industrialized Countries The World Health Organization (WHO) considers ozone a major public health concern, causing respiratory and cardiac illnesses and leading to increased hospital visits and premature death. Government scientists have known for at least six years that the existing standards do not protect the public from the respiratory and heart problems caused by high ground-level concentrations of ozone. But, because ozone involves so many industries, there is great industry pushback against tighter controls. 1 The WHO Air Quality Guideline (AQG) for ozone was updated from 60 ppb an 8-hour daily average to 50 ppb with new research studies indicating significant additions to the health improvement 2. A: European Union The European Union limit is set to 120 μg/m3 (60 ppb) within its 33 member countries. The EU promulgates air quality standards by issuing Directives periodically. These legally binding limit values are for concentrations of major air pollutants that impact public health, such as particulate matter (PM10 and PM2.5) and nitrogen dioxide (NO 2 ), ozone, sulphur dioxide and carbon monoxide. Directive 2008/50/EC on ambient air quality and cleaner air for Europe sets out the target value for the protection of human health from ozone. Specifically, the maximum daily 8-hour mean concentration of ozone should not exceed 120 μg/m3 (60 ppb) on more than 25 days per calendar year averaged over three years. 3 Many EU Member States do not comply with legally binding air quality limit and target concentration values, for particulate ground level ozone (O3) and nitrogen dioxide (NO 2 ). 4 European Union Air Quality Standards for Ozone as Defined in the Air Quality Directive Objective Period Target Value Total Allowed Exceedance Human health Vegetation Daily maximum 8- hour mean 120 μg/m3 (Ozone 1 ppb = 2.0 ug/m3) AOT40 accumulated over May July 25 days per year averaged over three years (μg/m3).h averaged over five years LTO health Daily maximum 8-hour mean 120 μg/m3 LTO vegetation AOT40 accumulated over May July (μg/m3).h Information One hour 180 μg/m3 Alert One hour 240 μg/m3 1 The Guardian, Obama unveils new limits on ozone pollution in victory for health groups, 11/25/2014. Online: 2 CAI-Asia Factsheet No. 15, August Online: 5_Aug_2010.pdf&rct=j&frm=1&q=&esrc=s&sa=U&ei=H7K2VJquNo- QyATcgoL4Ag&ved=0CC0QFjAE&usg=AFQjCNEaVOIy7COYgLpm-NZAGTkoKAmw2g 3 Air Quality in Europe 2011 report, European Environmental Agency, 11/12/2011. Online: 4 Ibid.
28 6. Ozone Standard B. Consider and act upon forwarding comments to EPA in response to the new proposed ozone standard B: United Kingdom As a member of EU, the United Kingdom obeys by the EU s environmental rules. The limits set in the Ambient Air Quality Directive, 2008/50/EC, are closely aligned to the UK air quality objectives, with similar metrics and levels. 5 C: Canadian Ambient Air Quality Standards (CAAQS) Current ozone standard in Canada is 63 parts per billion with plans to reduce it to 62 ppb by The CAAQS for PM 2.5 and ozone were established as objectives under the Canadian Environmental Protection Act 1999, in May 2013 and replace the Canada-wide Standards for Particulate Matter and Ozone. The 2020 standards for PM 2.5 and ozone will be reviewed in Canadian Ozone CAAQS Pollutant Averaging time Standards (concentration) Ozone 8-hour 63 ppb 62 ppb Metric The 3-year average of the annual 4th- highest daily maximum 8- hour average concentrations. D: Mexico Mexican Official 8-hour ozone standard, NOM-020-SSA1-1993, is set at ppm. The fifth maximum cannot be over the standard in one year. Official Mexican Ozone Standard Averaging Pollutant Standard Time Form Ozone ppm 1-hour Not to be exceeded more than once per year ppm 8-hour Fifth maximum taken over a period of one year 5 UK Environmental Protection, 2014; Online: 6 Canadian Council of Ministers of the Environment, Canadian Ambient Air Quality Standards, 2014, Online:
29 6. Ozone Standard B. Consider and act upon forwarding comments to EPA in response to the new proposed ozone standard E: Other Countries Of the 19 Asian countries and the City of Hong Kong, which our source has surveyed, only three countries have 8-hr average ozone standards at par with the World Health Organization AQG. More than half of the countries do not have 8-hr average O3 standards, but some have 1-hour ozone standards. 7 Summary of Ozone Standards in Other Countries Countries 1-hr 1-hr 8-hr 8-hr (μg/m3) (ppb) (μg/m3) (ppb) Metric Bangladesh Cambodia China: Grade I Hourly, and 8-hr maximum China: Grade II per a day China: Grade III Daily Hong Kong SAR Hong Kong SAR India hourly monitored values %98 of the time in a year. %2 may exceed but not India consecutive days of monitoring. Indonesia Malaysia Mongolia Pakistan Pakistan Philippines Republic of Korea Singapore Sri Lanka Thailand Viet Nam China: Grade I = applies to specially protected areas, such as natural conservation areas, scenic spots, and historical sites; China: Grade II = applies to residential areas, mixed commercial/residential areas, cultural, industrial, and rural areas; China: Grade III = special industrial areas; SAR = Special Administrative Region; PDR = People s Democratic Republic; PM10 = Particles with aerodynamic particle diameters of 10 micrometers or less; PM2.5 = Particles with aerodynamic particle diameters of 2.5 micrometers or less 1 = Proposed air quality objectives for Hong Kong SAR. 2 = NAAQS for Industrial, Residential, Rural and Other Areas 3 = NAAQS for Ecologically Sensitive Areas (notified by Central Government) 4 = Draft: Effective from 1st Jan 09 5 = Draft: Effective from 1st Jan 2012 Source: CAI-Asia Center, [Collected from various sources] 7 Clean Air Initiative for Asian Cities Center, Factsheet No. 15 Ozone (O3) Standards in Asia. August Online: 5_Aug_2010.pdf&rct=j&frm=1&q=&esrc=s&sa=U&ei=Ltq2VNCsLMOlgwTxrIH4Cg&ved=0CBQQFjAA&usg=AFQjCNFgJfjE9dZMd8p VTw5EeH7n4UiN2w
30 6. Ozone Report C. Consider and act upon approval to ask EPA for a response to TCEQ s letter on how the proposed lower ozone standards will not accomplish its stated goal of protecting human health January 28, 2015 Gina McCarthy Administrator Environmental Protection Agency, 1101A 1200 Pennsylvania Avenue, N.W. Washington, DC Subject: Texas Commission on Environmental Quality (TCEQ) letter on Will EPA s Proposed New Ozone Standards Provide Measurable Health Benefits? Dear Administrator McCarthy: We, the members of the Air Improvement Resources Executive Committee in San Antonio, Texas, are writing to express our interest in EPA s response to TCEQ s statement in the referenced document (attached) that EPA s proposed lower ozone standards will not accomplish its stated goal of protecting human health. We are also interested in receiving EPA s assessment of TCEQ s statement about the ramifications of the proposed lowering of the ozone standard: If you are an official of a city or county in or near an ozone nonattainment area, a lower ozone standard could have a direct, negative effect on the economy of your area by making it more difficult for some new businesses to open, or existing businesses to expand. The Air Improvement Resources Executive Committee seeks to determine the most prudent path available to our region for meeting federal air quality standards. It is important to understand how the lower ozone standard will protect human health in San Antonio, Texas in our planning process as we work together with the EPA and TCEQ to ensure excellent air quality for our citizens with the least local cost and penalty in the process. Sincerely, Chair, AIR Executive Committee Vice-Chair, AIR Executive Committee
31

32
33

34
35

36
37 January 22, 2015 Honorable John H. Williams Vice Chairman, Air Improvement Resources Executive Committee Alamo Area Council of Governments 8700 Tesoro Drive, Suite 700 San Antonio, Texas Re: Nomination to the Air Improvement Resources Advisory Committee Dear Vice Chairman Williams: This letter is a request on behalf of the South Texas Energy & Economic Roundtable (STEER) that you consider Christopher Ashcraft, Vice President of STEER, for nomination to the Air Improvement Resources (AIR) Advisory Committee as a representative of STEER. STEER is a 501(c)6 and serves as the bridge connecting the oil and natural gas industry to South Texas communities. Originally, STEER was established by 11 of the largest operators, now 16, in the Eagle Ford Shale region along with other oil and gas service companies in South Texas. As their representative, STEER s mission is to facilitate and coordinate communication, education, and public advocacy for the production of energy resources in South Texas. The responsible stewardship of our environment and being a positive stakeholder of the communities in which we work and live is a top priority for our industry. As a major economic driver in the region, activity by the energy industry in the Eagle Ford Shale resulted in $87 billion total economic output and the creation of more than 150,000 full-time jobs. Chris has extensive experience working in environmental issues. After receiving an honorable discharge as a Medical Officer in the US Army, Chris worked for the Office of The Administrator at the US EPA on Federal Advisory Committees. After leaving the US EPA he worked in the Natural Resources Department at the Alamo Area Council of Governments where he managed the US DOE Clean Cities program and worked closely with the Air Quality department at AACOG. Chris also manages the STEER Health, Safety, and Environment (HSE) and the Water Sustainability Committees, which are made up of the technical experts of our STEER member companies. Thank you for your consideration of his nomination. Please feel free to contact me with any questions. If further information is needed, my number is (210) Sincerely, Omar Garcia President and CEO South Texas Energy & Economic Roundtable
, AACOG recognizes businesses, agencies, and other organizations that are making")
38 8. AIR Public Education Committee update A. Consider and act upon Air Quality Stewardship Award recommendations from the AIR Public Education Committee Air Quality Stewardship Award Recommendations Each year, through its Air Quality Stewardship Awards (AQSA), AACOG recognizes businesses, agencies, and other organizations that are making outstanding voluntary efforts to reduce air pollution. This year, the award has been opened to include single projects carried out by one or more organizations. Nominations for the AQSA are reviewed by AACOG s AIR Public Education Committee. Criteria are based in six areas of accomplishment: commuter assistance, fleet management, energy efficiency and sustainable building, industrial process pollution reduction, landscaping, and air quality education. Based on that committee s recommendations, a final determination of the annual award is made by the AIR Executive Committee. For the 2015 AQSA, the AIR Public Education Committee received nominations for five organizations and six projects. 1 The nominees were asked to indicate their interest in being considered for an award by returning a request for information form. 2 The organizations or projects that responded were: San Antonio Missions National Historical Park, Demand Response Transit for Urbanized Areas project, William R. Sinkin Eco Centro project, and Skymine project. The AIR Public Education Committee discussed the submitted materials at their January 5, 2015 meeting. The committee recommends issuing three awards in the categories of Organization, Project, and Trailblazer, along with one honorable mention. Its recommendations, below, are followed by summarized accomplishments: Organization Award: San Antonio Missions National Historical Park (NHP) Background: The NHP staff has been actively involved in environmental sustainability since the 1990s and has maintained a formal Environmental Management System (EMS) program since The park was designated as the first Climate Friendly Park in Texas during 2013, and was recognized by the National Park Service Director for its Servicewide NPS Environmental Achievement (honorable mention) in Accomplishments: It supports and encourages both alternative work scheduling (compressed) and telecommuting appropriate to job functions, with 38% of its staff working alternative schedules that reduce their number of commutes per year. Almost half of the park s 22-vehicle fleet is now alternative fueled, and all turf grooming mowers operate on propane. An electric vehicle charging station has been installed at park headquarters and another electric charging station for visitor use has been installed at the park Visitor Center. The park has partnered with the City of San Antonio to expand the city s B-Cycle Bike Share program to the four primary visitor use sites in the park. The Mission San Jose B-Cycle station is now the most active B-cycle location in the City of San Antonio. Visitors can park their vehicles at any of the park missions and travel by bike throughout the park, to downtown San Antonio and to the Museum District north of downtown. The park has a written policy that all construction and remodeling projects must consider and attempt to use local, sustainable materials. Projects are also required to submit recycling plans for approval. The remodeling of the visitor center theater, for example, used carpeting, acoustical wall board, and acoustic ceiling tiles with recycled content. 1 The five nominated organizations were; Bates Container, Hyatt Regency San Antonio Riverwalk, McGuyer Homebuilders, Munters Corporation and San Antonio Missions National Historical Park. The six nominated projects were; A-AAAKey Mini Storage Solar Panel Project (Brundage Management), Demand Response Transit for Urbanized Areas (Cities of Cibolo, Garden Ridge, New Braunfels, and Schertz; the Comal and Guadalupe County Commissioners Courts; the McKenna Foundation; and VIA Metropolitan Transit) William R. Sinkin Eco Centro (San Antonio College), MILCON Training Barracks (Joint Base San Antonio-Ft Sam Houston) San Antonio Data Center Building (Data Stream Centers); and SkyMine (Zachry Corporation and Skyonic, Inc.). 2 AACOG s William Moseley, Regional Transportation Coordinator, was asked to submit the requested information on behalf of the eight entities involved in the Demand Response Transit project.
39 Onsite education on emissions reduction is provided for staff. The NHP has allowed AACOG to set up an air quality information tables on site. Employees receive direct notification when there is an Air Quality Health/Ozone Action Alert. Project Award: William R. Sinkin Eco Centro (San Antonio College, Alamo Community College District) Background: This urban sustainability project/outreach center conducts classes, information sessions, exhibits, fairs and public meetings to foster more sustainable energy and conservation practices at both the household and commercial levels. Accomplishments: In addition to promoting policy and behavioral change toward cleaner air in our region through courses, workshops, and free information sessions, the center itself contributes to clearer air: It was built to meet United States Green Building Council s LEED certification at the silver level It facilitates alternative transportation with multiple bike racks, a B-Cycle bike sharing station (final installation in January 2015), and the relocation of a Via bus stop onto Eco Centro property, two (2) electric vehicle charging stations with free charging during the daytime because the power is generated by the solar panels on the roof of their building. It provides roughly three times its own energy needs with its own 135 kilowatt solar array. It has established demonstration gardens incorporating xeriscaping and native plant landscaping. It has been a recipient of CPS Demand Response Award for reducing energy consumption during peak time usage as defined by CPS Energy. Trailblazer Award: Capital SkyMine (Zachry Corporation and Skyonic Corporation) Background: Operating on a demonstration scale since 2010 at Capitol Aggregates cement plant in San Antonio, SkyMine was brought to commercial-scale production late in Not only does SkyMine technology capture carbon emissions, it mineralizes and converts them into such products as baking soda, bleach, and hydrochloric acid. This project will generate an expected $48 million in revenue and $28 million in annual earnings. The first of its kind, Capital Skymine could not have been built without the grant-matched local funding and support of the Zachry Corporation, who owns Capital Aggregates. Accomplishments: Capitol SkyMine will reduce the existing plant s overall emissions by 75,000 tons of CO2 annually. Plus, through the creation of carbon-negative products, Capitol SkyMine will offset 225,000 tons of CO2 emissions a year by displacing products that are normally made through carbon-intensive practices. These emissions savings a total of 300,000 tons CO2 impact are equivalent to removing over 62,000 passenger vehicles from the road annually. In addition to removing CO2 from the Capitol Aggregates stack, Capitol SkyMine also reduces SOX, NOX, and heavy metals from the treated slip stream. It is capable of removing over 90% of SOX and NOX and 96% of the mercury and heavy metals. Honorable Mention: Demand Response Transit for the San Antonio Urbanized Area (Cities of Cibolo, Garden Ridge, New Braunfels, and Schertz; the Comal and Guadalupe County Commissioners Courts; the McKenna Foundation, and VIA Metropolitan Transit) Background: The Cities of Cibolo, Garden Ridge, New Braunfels, and Schertz, as well as the Census Designated Place of McQueeney were recently re-designated as urban areas. With the loss of their rural designation, these areas lost full State funding for rural demand-response transit that AACOG s Alamo Regional Transit (ART) had been providing for over a decade. The above mentioned cities, Guadalupe County (for the McQueeney area), and Comal County and McKenna Foundation (for New Braunfels) voluntarily adjusted existing budgets so that they could continue uninterrupted demand-response transit service. Their $680,000+ in local funds, combined with matched urban and local dollars from VIA Metropolitan Transit and AACOG, provided means to contract with ART for this ongoing service. Accomplishments: The decision to locally finance demand-response transit for the re-designated urban areas results in continued elimination of 16,000 or more personal vehicle trips per year by combining rides around town and out of the respective municipal areas. Also, use of newer, more fuel-efficient vehicles contributes to reduction of vehicle emissions. In addition, by operating on an as-needed basis, these trips further reduce pollutants by eliminating much of the exhaust associated with continuously running fixed bus routes. Finally, this decision eliminates the need for, and associated environmental footprint of, operating additional small bus yards to maintain municipal fixed-route fleets for these areas. Action Item
40 The AIR Public Education Committee is requesting consideration and approval of the recommendation from the AIR Executive Committee. Further information is available from Natural Resources staff. The awardees will be honored at a ceremony held in April, possibly during the Fiesta San Antonio Earth Day Celebration on April 12 at Woodlawn Lake.
41 9. EPA s Response to the AIR Committee s Path Forward Letter San Antonio Ozone Advance Update EPA feedback, Nov/Dec 2014 Thank you for the opportunity to review your update! We are so pleased that AACOG is continuing its efforts to improve air quality in San Antonio; we believe that the unique issues faced by the area make early actions to reduce emissions especially appropriate. Below are some thoughts (in no particular order) for your consideration as you continue working toward cleaner air. Our intention is to provide you with ideas for ways to further enhance your plan; you can decide which of these make sense to you to add in a future update. Please let us know if you would like to discuss any of these suggestions; we would be happy to talk with you anytime. General Suggestions o We appreciate the manner in which you provided your updates; repeating the parts of your plan that remain the same and updating the parts that have changed or that are new is a very helpful way to represent what is happening in your area thank you! o An addition that could be made in a future update is some background language explaining what the NAAQS are and some information about the status of the current ozone NAAQS review at the time your update occurs. o Some of the facilities that generate NOx in your area are already doing things to support your plan, and others might be willing to become involved. Even if facilities aren t able to install new controls per se, they may be able to do other things to reduce NOx (e.g., start a carpool/vanpool program, support telecommuting, provide transit subsidies, establish a weekly bike to work day, etc.) or increase employees awareness (promote the use of Enviroflash ( for air quality alerts?). One source for ideas about working with local employers to implement employee VMT reduction and other programs is the Clean Air Force of central Texas, see o We hope the 2011 National Emission Inventory emission profiles we sent to you were useful; we can expand on that if you want similar information for any of the counties neighboring the six county San Antonio area. Also, we are working on adding sulfur dioxide (SO2) and ammonia (NH3) information to the PM Advance areas emission profiles, given that those pollutants are PM precursors. Although your area is focused on ozone rather than PM, if you would like us to add SO2 and NH3 information to the profiles we sent to you, we would be happy to add that information. 1
42 9. EPA s Response to the AIR Committee s Path Forward Letter Measures/Programs o It s great that you looked to some of the other local areas in Texas (DFW, Austin) for ideas; what has worked well in those areas might work well in yours, too. Some other sources of ideas could be the Advance plans/updates for Waco, Hood County, and Corpus Christi, see: o When would the contingencies in Appendix B be triggered? Do you think you might revisit your plan now that revisions to the ozone standard have been proposed? o Coordinating with Lackland Air Force Base would be worthwhile so that, in a future update, your plan can include measures undertaken there. Military installations are subject to a variety of policies and directives related to energy efficiency and other priorities that are related to air quality improvements. Other Advance areas with area military bases have incorporated the bases efforts in their plans. o The improvements to controls, energy efficiency, and mobile fleets at area cement plants are worth noting. As an additional idea, consider working with the operators to see whether they would be able to implement heightened controls during ozone action days, akin to the agreement the Austin area reached with Texas Lehigh Cement Co. plant (see page 38 of their 2014 path forward update, and Andrew Hoekzema can answer questions - Other Advance areas have similar ozone action day agreements with oil and gas production companies see, e.g. starting on page 14. o Regarding emission reduction opportunities in the Eagle Ford shale, the separator example you provided was excellent. Are you going to continue to reach out to other companies about steps they are planning to take? o The work TCEQ is doing to evaluate control strategies to reduce ozone in the San Antonio area sounds very interesting! Let us know if there are things we can do to help. In particular, you/tceq may find it useful to look through a menu of measures for NOx/VOC reduction options and cost effectiveness information (see Another source might be the Control Strategy Tool (Co$t) (see 2
43 9. EPA s Response to the AIR Committee s Path Forward Letter o Awareness/Education o We have lesson plans and other materials for grade schools that may be of use to you. Also consider reaching out at both the District and school by school levels to encourage the development of anti-idling policies (if they don t already exist). Here are a variety of school resources: o The air quality health alert program update is especially well done we appreciate how you briefly explained the program, specified current status, and indicated the next near-term goal. o Is there a website for the air quality stewardship awards? We would be interested in learning more about your selection process recognition efforts like this are something we would like to suggest to other Advance areas. o Motivating individuals to take steps to improve air quality is a good step. Here are a couple of lists of tips that you can use when you reach out to the public via websites, public service ads, articles, school lectures, or whatever means you choose: and (we can point out additional lists of tips). If you re interested, we can also send you a few lists of social media messages (Facebook and Twitter); several Advance areas are interested in reposting/re-tweeting messages like this to encourage individuals take steps to reduce emissions. o Public service ads are another way some Advance areas are raising awareness about ozone. Check out the live-read radio PSA scripts we have developed you re welcome to use/adapt these: and o Mobile Sources o Some ideas to reduce diesel emissions include: Waste haulers and other fleets: Retrofitting or replacing old waste haulers is a strategy some cities and counties are implementing. 3
44 9. EPA s Response to the AIR Committee s Path Forward Letter Solar trash compactors: Some cities have purchased solar trash compactors and placed them in parks, universities, business districts and sport/concert venues. The compactors reduce the number of trash collection pickups significantly and can generate revenue by serving as advertisement billboards. Construction: The Southeast and Northeast Diesel Collaboratives have developed a toolkit for states, counties and municipalities on construction site best practices. The toolkit provides sample contract language that can be used to request or recommend (or even use in the bidding of jobs), which provides strategies to use cleaner construction equipment, idle strategies and other best practices. Your county and city agencies could include these practices in future construction contracts. Other idle reduction: Consider asking area grocery store chains to make their loading docks idle free zones. Or, you could ask local colleges/universities to create a policy that delivery trucks cannot idle while unloading, or to restrict idling at particular times/in particular locations (e.g., in front of dorms during move in/move out periods). An idle policy can also be applied to new construction on campus to encourage construction equipment companies not to idle when on lunch break, or when equipment is not in direct use. o A rail yard is one of the bigger NOx facilities in your area. A number of things can be done at rail yards to reduce fuel costs and improve air quality. Some ideas about how railways can voluntarily reduce fuel costs and improve air quality are provided here: EPA has a SmartWay rail carriers program, we provide information about verified idle reduction technologies, and we also provide information about retrofitting rail yard equipment and switchers. All of the above have the potential to significantly reduce local air emissions it may be worth providing this information to the companies that operate in your area. o EPA is/will be offering two Diesel Emissions Reduction Act funding opportunities that may be of interest to you or others in San Antonio: o One program is offering rebates for school bus replacements and it will be akin to the 2012 school bus rebate program and 2013 rebate program for nonroad construction equipment. The application period for 2014 has closed, but if funds become available in 2015, the program will be announced on the Advance website and we hope you will consider applying for such funds or encouraging others in your area to apply for them. o The larger, annual DERA competition should open again next spring (2015) assuming funding is available. Please start thinking about (or encouraging others in your area to start thinking about) project ideas now so that you/they can jump on the opportunity! Our hope is that projects located in Advance areas will 4
45 9. EPA s Response to the AIR Committee s Path Forward Letter receive some preference again this year as they have for the past couple of years. o Energy o Tree planting: The chart on pg. 44 includes a strategy for Measures to Shade or Cool Urban Areas. In , the San Antonio Parks and Recreation Dept. had a tree rebate for energy savings program for commercial/residential customers, see Are there plans to continue this program in 2015? o Tree planting: If the San Antonio Parks and Recreation Dept. plans to continue its tree planting program, they may be interested in taking a look at the Forest Service s itree Species tool (see The tool aids users in selecting proper tree species for certain functions such as air pollution removal, energy conservation, etc., and providing information regarding proper siting of seedlings. Also, an idea that is being pursued by the Cumberland County NC Ozone Advance area is a bank of trees that construction companies contribute to when projects are undertaken that involve the removal of trees (see their 2014 path forward update: o Urban Heat Island: If you haven t already, you may be interested in looking at studies that have been done on San Antonio and urban heat island effect, e.g.: and o Utilities: Consider asking area power companies what energy conservation programs are planned, or to find out if they would be willing to retrofit or replace older diesel utility and service vehicles. o Green purchasing: Another idea is to promote green purchasing practices (model contract language) to promote energy efficient choices. We can locate sample language for you if you are interested. o Energy efficiency in building codes: EPA Contact - Niko Dietsch o Background Info on Building Codes: Energy codes establish minimum efficiency requirements for the construction of new and renovated residential and commercial buildings. Building energy codes are typically developed at the national level, adopted at the state level, and implemented and enforced by local governments. The International Energy Conservation Code (IECC) is the prevailing model code for the residential sector. ASHRAE is the model commercial code. To date, 31 states (including Texas) have adopted IECC 2009 and 4 states have gone further by adopting the IECC In the commercial 5
46 9. EPA s Response to the AIR Committee s Path Forward Letter sector, 36 states have adopted ASHRAE and 5 states have adopted ASHRAE o Potential Impact: Building codes offer cost-effective energy savings. One study finds that residential codes deliver a decrease of roughly 10% in energy use relative to households that were not built to code: Cleaner-Buildings-Effectiveness-of-US-Building-Energy-Codes.pdf. o Resources for more information: Federal resources: DOE s Building Energy Codes Program - EPA/DOE paper on the role of utilities, PUCs, and governments in advancing codes Key organizations with codes: Online Code Environment and Advocacy Network (OCEAN) - Institute for Market Transformation (IMT) - Southeast Energy Efficiency Alliance (SEEA) - SEE Action - o Background info. on energy efficiency/renewable energy: o Quantification of air quality benefits associated with energy efficiency programs, see AVERT (AVoided Emissions and generation Tool), The tool is designed to meet the needs of state air quality planners and can be used to evaluate the county-level emissions of NOx, SO2, and CO2 displaced at electric power plants due to EE/RE policies and programs. AVERT is free and uses publicly-available data. For more information, talk with Robyn DeYoung (EPA), o For an overview of emissions reduction strategies that local governments can use to achieve economic, environmental, social, and human health benefits, see: and contact Emma Zinsmeister (EPA), for more information. o Local Government Case Studies on general EE programs: o Webcasts and other resources, and to sign up for our newsletter: o A number of state and local governments use the Energy Star Brand and Program materials to jump start their local programs, see: 6
47 9. EPA s Response to the AIR Committee s Path Forward Letter local-governments and contact Leslie Cook (EPA), for more information. o Sustainable Development o The EPA offers assistance with green infrastructure ( and smart growth ( projects. o In a future update, you could consider also mentioning the San Antonio Bike Plan: BikePrograms.pdf and the municipal bike sharing system (B-cycle): Phoenix is another city that recently began a new municipal bike sharing system you may want to compare programs to see what has/hasn t worked for each of you: EPA Assistance o Periodically check the Advance website (epa.gov/ozonepmadvance) for new information. In particular, we are keeping the site updated with current Federal funding opportunities as they arise, and we are continually posting new updates from the Advance areas that you can draw ideas from. o Please feel free to contact Carrie Paige, EPA Region 6 if would like to talk in more detail about any of these thoughts or if you have questions about anything else we want to assist you as you continue to work toward improving air quality in San Antonio. 7

48 TIER III Motor Vehicle Emission and Fuel Standards The EPA has proposed new standards for gasoline and new vehicles. The new safeguards will lead to 30% cuts in the key pollutants NOx, CO, and VOCs by Reducing those pollutants is critical to addressing the Wasatch Front s air quality challenges. WHAT ARE TIER III STANDARDS? Treats fuels and engines as a single system to be regulated together Requires a two-thirds cut in sulfur content of gasoline, to 10 ppm (already achieved in Calif., Japan, and the EU.) Requires a package of new vehicle pollution control technologies, very similar to those already available in Partial Zero-Emission Vehicles (PZEV.) Those include: bigger catalytic converters heat pumps to warm up catalysts to avoid cold start emissions releases redesigned fuel tanks and fuel lines The new vehicle requirements phase in between 2015 and 2025 HOW WOULD TIER III STANDARDS HELP? Lowering sulfur in gas would reap immediate benefits when it goes into effect in 2017: 8% reductions in NOx and CO, 3% in VOCs By 2030, with most cars using Tier III technologies that take full advantage of lower-sulfur gas, emissions of NOx, CO and VOCs would be reduced by 29%, 38% and 26% respectively Together, with already-passed mileage standards, regulators expect 70 to 80% reductions in key pollutants by 2030 These will be critical cuts for Utah, where vehicle emissions are an estimated 57% of the cause of wintertime smog WHAT ARE THE BENEFITS OF THOSE POLLUTION CUTS? Those cuts in emissions are equivalent to removing 33 million cars and light trucks from our roads. By 2030, cleaner gasoline and cleaner vehicle standards are expected to: Prevent more than 2,500 premature deaths annually Prevent more than 3.3 million days missed at work or school Result in $8.5 billion to $22 billion in annual economic and health care benefits WHAT WOULD TIER III STANDARDS COST? Cost of reducing gasoline sulfur content to 10 ppm is less than one cent per gallon, according to a refinery consulting firm hired by the EPA Estimated costs for new vehicles is about $125 to $150 per vehicle Tier III Standards are very cost-effective, costing about $3,300 per ton of pollutant removed (Most cuts recently ordered by the Utah DAQ cost about $6-$8,000 per ton removed.) WHO SUPPORTS THE STANDARDS? * Carmakers, domestic and foreign * Health groups, including the American Heart Association, American Lung Association and more. WHAT CAN WE DO? * Let the EPA know you support the proposed Tier III standards: They re a cost-effective way for Utah to address its air quality challenges. * For more information, go to Comments are due June 13. Clean Gas, Clean Cars, Clean Air
49 10. Questions from the October 22, 2014 meeting of the Air Improvement Resources Executive Meeting A. Vehicle Emission Standards Emission Standards for Cars and Light Trucks All new vehicles sold in the U.S. are subject to emissions standards set by either the federal government or the State of California. Tier 2 tailpipe emissions program replaced the National Low Emission Vehicles (NLEV) at the end of 2004, and Tier 3, which intends to regulate evaporative emissions and sulfur content of the fuel, will start in The Tier 3 standards will reduce both tailpipe and evaporative emissions from passenger cars, light-duty trucks, medium-duty passenger vehicles, and some heavyduty vehicles. Emission reductions from the Tier 3 program will lead to immediate air quality improvements that are critically important for states to attain and maintain the existing health-based National Ambient Air Quality Standard (NAAQS). The 1999 Tier 2 Program In 1999 EPA proposed Tier 2 tailpipe emissions standards to go in effect beginning in A phase-in would occur between 2004 and 2009, and gradually lead to nearly a full fleet of Tier II compliant vehicles in Based on this program, for the first time all passenger cars, light trucks, and larger passenger vehicles operated on any fuel are subject to the same national pollution control system. Light trucks include light light-duty trucks (LLDTs), rated at less than 6000 pounds gross vehicle weight and heavy lightduty trucks (HLDTs), rated at more than 6000 pounds gross vehicle weight). Medium-duty passenger vehicles (MDPVs) form a new class of vehicles introduced by this rule that includes SUVs and passenger vans rated at between 8,500 and 10,000 Gross Vehicle Weight Rating (GVWR). The program thus ensures that essentially all vehicles designed for passenger use in the future will be very clean vehicles. The new standard is 0.07 gpm for NOx, a percent reduction for cars and a percent reduction for trucks beyond the NLEV agreement 1. Tier II standards for passenger cars and light trucks phased in beginning in 2004, with the standards to be fully phased in by For heavier trucks and MDPVs, the Tier 2 standards phased in beginning in 2008, with full compliance in Table 1: Phase-In Percentages for Tier 2 Requirements Model year LDV/LLDT Tier 2 a HLDT/MDPV Tier 2 b Interim Non-Tier 2 c and subsequent a - Percentage of LDV/LLDTs that must meet Tier 2 requirements b - Percentage of HLDT/MDPVs that must meet Tier 2 requirements c - Percentage of non-tier 2 HLDT/MDPVs that must meet interim non-tier 2 fleet average NOx requirements 1 EPA, Emission Facts, 1999, Available online Last viewed 10/31/14 Page 1 of 4
50 10. Questions from the October 22, 2014 meeting of the Air Improvement Resources Executive Meeting A. Vehicle Emission Standards In addition, the program required most refiners and importers meet a corporate average gasoline sulfur standard of 120 ppm and a cap of 300 ppm beginning in 2004, and 80 ppm by Most refineries must produce gasoline averaging no more than 30 ppm sulfur. The following table provides information on NO X emissions standards and percentage of reduction as compared to the former standard for various vehicle types. 2 Table 2: NO X Emissions Standards NO Vehicle Type X (gpm) NO X (gpm) Reduction from previous standard Passenger Cars % Smaller SUVs, Minivans, and Light Trucks Larger SUVs, Vans, and Heavier Trucks % % Tier 2 Emission Standards The federal Tier 2 program requires manufacturers to certify individual vehicles to tailpipe and evaporative emissions standards and meet a sales-weighted fleet-wide emissions average. The Tier 2 emission standards are structured into 8 permanent and 3 temporary certification levels of different stringency, called certification bins, and an average fleet standard for NOx emissions. Vehicle manufacturers have a choice to certify particular vehicles to any of the available bins. When fully implemented in 2009, the average NOx emission of the entire light-duty vehicle fleet sold by each manufacturer has to meet the average NOx standard of 0.07 g/mi. The temporary certification bins (bin 9, 10, and an MDPV bin 11) with more relaxed emission limits are available in the phase-in period and expire after the 2008 model year. 3 Engines in commercial vehicles above 8500 lbs GVWR, such as cargo vans or light trucks, continue to certify to heavy-duty engine emission standards. The following table summarizes the Tier 2 emission requirements. The Tier 2 emission standards were phased-in from 2004 to Tier 2 standards will be phased-out and replaced by Tier 3 regulations over the period of Tier 3 Program Summary Tier 3 program targets gasoline sulfur content and vehicles evaporative emissions. Under the final Tier 3 program, gasoline sulfur content, currently 80 ppm at refinery gate and 95 ppm downstream, will not contain more than 10 parts per million (ppm) of sulfur on an annual average basis by January 1, The new gasoline sulfur standard makes use of less expensive technology possible, enables more stringent vehicle emissions standards, and will make emissions control systems more effective. According to an analysis done by HEAL Utah, a private environmental organization based in Utah Lowering sulfur in gas would reap immediate benefits when it goes into effect; an 8% 2 EPA, Emission Facts, 1999, available online: 10/31/14 3 DieselNet, Emission Standards, 2006, Available online: 11/03/14 Page 2 of 4
51 10. Questions from the October 22, 2014 meeting of the Air Improvement Resources Executive Meeting A. Vehicle Emission Standards reductions in NO X and CO, 3% in VOCs in 2017 and by 2030, gas emissions of NO X, CO and VOCs would be reduced by 29%, 38% and 26% respectively. 4 Tier 3 standards were finalized in March 2014 and its requirements will phase in from 2017 to The following table presents a comparison between tailpipe and evaporative emissions from an average Tier 2 vehicle with those of a Tier 3 vehicle. 5 Table 3: Tier 2 Emission Standards, g/mi Intermediate life Full useful life Bin Bin# (5 years/50,000 mi) NMOG* CO NOx NMOG* CO NOx Temporary Bins Permanent Bins 11 MDPV c a,b,d,f (0.160) 3.4 (4.4) (0.230) 4.2 (6.4) a,b,e,f (0.140) (0.180) b (0.125) (0.156) * for diesel fueled vehicle, NMOG (non-methane organic gases) means NMHC (non-methane hydrocarbons) average manufacturer fleet NOx standard is 0.07 g/mi for Tier 2 vehicles a - Bin deleted at end of 2006 model year (2008 for HLDTs) b - The higher temporary NMOG, CO and HCHO values apply only to HLDTs and MDPVs and expire after 2008 c - An additional temporary bin restricted to MDPVs, expires after model year 2008 d - Optional temporary NMOG standard of g/mi (50,000) and g/mi (full useful life) applies for qualifying LDT4s and MDPVs only e - Optional temporary NMOG standard of g/mi (50,000) and g/mi (full useful life) applies for qualifying LDT2s only f - 50,000 mile standard optional for diesels certified to bins 9 or 10 4 Healthy Environment ALliance of Utah, Tier III Motor Vehicle Emission and Fuel Standards, available online: Last viewed 10/31/204 5 Congressional Research Service, Tier 3 Motor Vehicle Emission and Fuel Standards, April 28, 2014, available online: Last viewed 10/31/204 Page 3 of 4
52 10. Questions from the October 22, 2014 meeting of the Air Improvement Resources Executive Meeting A. Vehicle Emission Standards Table 4: Tier 3 Fleet-Average Non-Methane Organic Gases and Nitrogen Oxides Standards by Model Year, g/mi Tier MY MY MY MY MY MY MY MY Vehicle Type MY 2025 LDV, LDT LDT2,3,4 and MDPV HDV Class 2b HDV Class The Tier 3 gasoline sulfur standards are similar to levels already being achieved in California, Europe, Japan, South Korea, and several other countries. In the absence of additional controls such as the Tier 3 standards, many areas will continue to have air pollution levels that exceed the NAAQS in the future. 6 Tier 3 is harmonized with the California Air Resources Board Low Emission Vehicle (LEV III) program so automakers could sell the same vehicles in all 50 states. 7 6 EPA Sets Tier 3 Motor Vehicle Emission and Fuel Standards, EPA, March 2014, available online: Last viewed 10/31/204 7 Ibid. Page 4 of 4

 Compressor Stations Processing Facilities Disposal Wells Other Mid-Stream Sources The EI only includes sources located at well heads or at mid-stream sources.")

53 4/14/2014 Overview Eagle Ford emission inventory Eagle Ford production projections Changes in the Eagle Ford EI requested by TCEQ Emissions from Eagle Ford Oil and Gas Production Oil and Gas Emission Inventory, Eagle Ford Shale, AACOG Future steps April 15 th, 2014 Presented by Steven Smeltzer, AACOG, Eagle Ford Emission Inventory Emission Sources in the Eagle Ford 1) Exploration/Pad Construction 2) Drilling 3) Hydraulic Fracturing/Well Completion 4) Production 5) Mid Stream Sources (can be located at well sites) Compressor Stations Processing Facilities Disposal Wells Other Mid-Stream Sources The EI only includes sources located at well heads or at mid-stream sources. The Eagle Ford EI does not include pipelines, storage ponds, most non-routine emissions, railways, refineries, trucks bringing supplies to mid-stream sources, and sources outside of the Eagle Ford Region. Emissions from the production of gravel, cement, steel pipes, and other material are not included. Drill Rigs Compressors Pump Trucks Crude Oil Storage Tanks Condensate Storage Tanks On-Road Vehicles (Trucks) Well Casing Trucks Blenders Signal Boards Cranes Sand Kings Seismic Trucks Separators Flares Transmission Storage Tanks Pumps Production Loading Other Generators Large Cranes Construction Equipment Fugitives Boilers/Heaters Dehydrators Pneumatic Devices Other Fugitive Emissions Other Non-road Equipment Other Mid-Stream Sources Other Sources Eagle Ford Emission Inventory Drill Rig Projections, Three different 2015 and 2018 emission inventory scenarios were developed for Eagle Ford Shale oil and gas production - Low, moderate, and high projection scenarios - Based on the number of projected drill rigs and well decline curves in the Eagle Ford - The number of drill rigs operating in the Eagle Ford was capped at 250 Worked closely with the oil and gas industry to develop the Eagle Ford Emission Inventory 1


54 4/14/2014 Cumulative Projected Number of Horizontal Wells Drilled in the Eagle Ford, Projected Oil Production in the Eagle Ford, The Railroad Commission of Texas reported at least 256 MMbbl were produced in Accessed 04/14/14 Projected Natural Gas Production in the Eagle Ford, Changes in the Eagle Ford EI requested by TCEQ TCEQ suggested that AACOG use emission factors (EF) for compressor engines only from attainment counties in the Barnett Special Shale Emission Inventory. The EFs from all Barnett Shale counties were used for developing the draft EI. - NO X emissions changed from tons to tons per compressor/year - VOC emissions changed from 0.36 tons to 0.39 tons per compressor/year Include sources for any local data used in the EI - The EI was updated with local sources Correct emissions in McMullen and Maverick Counties - Corrected TCEQ had questions about hydraulic pump engine and storage tank data sources - Sources of local data were added to the report The Railroad Commission of Texas reported at least 1,318 BCF were produced in Accessed 04/14/14 Eagle Ford NO X Emissions by Year and Source Category, Moderate Scenario Eagle Ford VOC Emissions by Year and Source Category, Moderate Scenario Bexar County 2018 anthropogenic emissions are 101 tons of NO X/day and 129 tons of VOC/day The Eagle Ford EI includes emissions from shale oil and gas production for a 25 county region Bexar County 2018 anthropogenic emissions are 101 tons of NO X/Day and 129 tons of VOC/Day The Eagle Ford EI includes emissions from shale oil and gas production for a 25 county region 2


 cross over the Eagle Ford 46% of the back trajectories (17 out of 37 days) cross over")

55 4/14/2014 NO X Emissions from Eagle Ford by County, 2012 Future Work on the Eagle Ford Emission Inventory Include the results from the 2013 Hydraulic Fracturing and Drill Rig surveys in future Eagle Ford EIs Update the Eagle Ford EI with other completed survey results Continue updating projections as new data becomes available Update Mid-Stream source emissions Include traffic count data from TxDOT and other sources Emission sources from the Eagle Ford not included in the original and not under consideration for updates pipelines, storage ponds, most non-routine emissions, railways, refineries, trucks bringing supplies to mid-stream sources, sources outside of the Eagle Ford Region, and production of gravel, cement, steel pipes, and other material Bexar County 2018 anthropogenic emissions are 101 tons of NO X/day and 129 tons of VOC/day The Eagle Ford EI includes emissions from shale oil and gas production for a 25 county region The location of the Eagle Ford and C23 Back Trajectories on Days when the 8- Hour Ozone > 75 ppb, % of the back trajectories (21 out of 37 days) cross over the Eagle Ford 46% of the back trajectories (17 out of 37 days) cross over the southern section of Eagle Ford (Gonzales County or farther south) NOAA, Feb. 26, Realtime Environmental Applications and Display system (READY). Available online: tml. Accessed 01/12/12. NO X Emissions (tons/day) for the San Antonio-New Braunfels MSA, 2006, 2012, and 2018 Eagle Ford Moderate Scenario Eagle Ford NO X Emissions by Scenario and Source Category, 2018 Bexar County 2018 Anthropogenic Emissions are 101 tons of NO X/Day and 129 tons of VOC/Day The Eagle Ford EI includes emissions from shale oil and gas production for a 25 county region 3

 160,000 160,000 160,000 Casinghead Gas EUR per well (MCF) 225,000 225,000 225,000 Condensate EUR per well (bbl) 100,000 100,000 100,000 Natural")

56 4/14/2014 Eagle Ford VOC Emissions by Scenario and Source Category, 2018 Locations of Horizontal Wells Drilled in the Eagle Ford Shale Play, 2012 Bexar County 2018 Anthropogenic Emissions are 101 tons of NO X/Day and 129 tons of VOC/Day The Eagle Ford EI includes emissions from shale oil and gas production for a 25 county region Typical Well Decline Curve, Eagle Ford Eagle Ford Projection Parameters Factor Low Development Moderate Development Aggressive Development Number of New drill rigs per year Maximum number of Drill Rigs Percent of wells drilled that go into production per year 33% 33% 33% Oil EUR per well (bbl) 160, , ,000 Casinghead Gas EUR per well (MCF) 225, , ,000 Condensate EUR per well (bbl) 100, , ,000 Natural Gas EUR per well (MCF) 1,250,000 1,250,000 1,250,000 Amount of EUR produced in the first year 51.3% 51.3% 51.3% Annual Growth in EUR per Well 0% 5% 10% Annual Change in Natural Gas Wells -10% 0% 10% Annual increase in Condensate Production per Well 5% 5% 5% EUR = estimated ultimate recovery Projected Condensate Production in the Eagle Ford, The Railroad Commission of Texas reported at least 76 MMbbl were produced in Accessed 04/14/14 4