SECTION 5 - VULNERABILITY ASSESSMENT. 5.1 Overview
|
|
|
- Frederica Robertson
- 5 years ago
- Views:
Transcription
1 SECTION 5 - VULNERABILITY ASSESSMENT 5.1 Overview A Vulnerability Assessment is performed to determine the impact that hazards have on the built environment and how they can affect the safety of the residents. The results of the Hazard Identification indicate that some of the hazards warrant a Vulnerability Assessment due to the frequency of occurrence or those hazards that have caused major damage in Citrus County. The Vulnerability Assessment uses the information generated in the hazard identification and hazard profile to identify locations in which residents of Citrus County could suffer the greatest injury or property damage in the event of a disaster. This assessment identifies the effects of hazard events by estimating the relative exposure of people, buildings, and infrastructure to hazardous conditions. Depending on the data available, a vulnerability assessment could involve counting the number of structures or people in the path of hazards or describing what these hazards can do to physical, social, and economic assets. 5.2 Identification of Assets Asset identification is a critical step in the hazard mitigation planning process. Taking Inventory of existing structures and identifying critical facilities provide insight into the County's vulnerability to select hazards and the magnitude of the potential damages from those hazards. Most risk assessment models examine the impact of various hazards on the built environment, including on the general building stock (residential, commercial, industrial, etc.), critical facilities, government operations, shelters, hospitals and health care facilities, utilities, water and wastewater, hazardous material sites, and schools. A compendium of maps was prepared by the Citrus County Public Works Department that references the locations of various assets, communications towers, nursing facilities, etc. These maps are titled 2009 Hurricane Season, Citrus County DPW, Emergency Management Maps and are included in this document by reference only due to the security of this information.[l1] The Data from the Florida Department of Community Affairs provideddivision of Emergency Management GIS data analysis and Mapping for Emergency Management, Parallel Hazard Information System (MEMPHIS) outputs developed by The Kinetic Analysis CorporationCritical Facilities inventory was analyzed to assess vulnerability. The MEMPHIS system used inventory data from the Florida Department of Revenue and U.S. Census Bureau tofdem s Critical Facilities inventory the total number of structures as well as the critical facilities that are potentially vulnerable to the identified hazardsincludes shelters, health care facilities, schools, emergency services, infrastructure, and more. The MEMPHIS system did not identify the City of Inverness as a Census Designated Point, and therefore, it is assumed that the information for the City was included in the data for the 76

2 Unincorporated Areas. In some instances, these figures differed slightly from the inventory data reflected in the Citrus County Property Appraisers Office. Currently, local staff is unable to update this information due to loss of staff and lack of experience of the remaining staff to produce models. Therefore, the information in Section 5 is based on the best available data from other sources General Building Stock A combination ofcounty tax assessment record data and Census 2000HAZUS data were used to develop a detailed inventory of the built environment. Structures were divided into one of six categories: Mobile homes -- Pre-engineered structures include manufactured housing and metal buildings that are mass-produced for shipment for erection on site. Single-family residential structures -- This includes most single-family structures and low-rise, 1-to-4 unit residential structures. Multi-family/condominium structures -- This includes multi-family residential structures, condominium, apartments, and assisted living facilities. Also included in this category are hotels and motels and higher density residential structures. Commercial structures -- structures built for professional, shopping, restaurant, and similar uses. Government/Institutional structures -- structures built for institutional, governmental, school, worship, and similar uses. The Citrus County Profile, draft 2005 as prepared by the State has identified the estimated number of acres, structures and persons at risk from select hazards for both the unincorporated area of Citrus County and the City of Crystal River. The City of Inverness data is specifically shown only on the table titled Total and Vacant Incorporated Areas in Hazard Areas below. The following tables were taken from the draft Citrus County Profile, DCA,

3 78

4 79

5 80
6 5.2.2 Critical Facilities Hazard identification analyses typically begin and end with determining which of those structures, areas, and services are required to provide a minimal degree of safety, health, and security to residents of a community. Each community must determine the exact composition and relative importance of these critical facilities. During the LMS planning process, Citrus County determined that the following shall be deemed as critical facilities: Governmental Buildings Schools/Shelters Hospital and Health Care Facilities Utilities Government Operations Citrus County and local governments use several facilities, offices, and stations to house and coordinate hazard and emergency response activities. These facilities also provide a means to direct operations prior to, during, and after a hazard event. Although most facilities have been designed to withstand a variety of hazards, several historic and locally vital facilities do not (and for these reasons, are not likely to be moved or retrofitted). A review of the County s CIP Budget FY 2009 through 2014 identifies the future construction of a new fire station in the vicinity of US 19 and US 98 in accordance with the development trends in the southwest part of the County. The construction of the new station would facilitate the closure of Stations 4, 10 and 18 in accordance with the 2007 Master Plan. This would remove these stations from their current location in the Coastal High Hazard Area (Category 1 surge zone). The Water Resource Department, Utilities Division will continue to expand and upgrade their water and sewer lines and plants, which will reduce the number of private wells and septic tanks that could be contaminated and non-functional during a disaster event Schools/Shelters Schools house thousands of children during each weekday and school facilities are used by the entire community for educational, recreation, and other activities throughout the year. At the least, events could cause disruption to these activities. Additionally if schools are open for children, this period allows parents to focus on home and business cleanup and rebuilding. There are several storm shelters in Citrus County (primarily within school facilities). In case of a major storm, plans call for evacuation of affected communities to these shelters. As in many other areas in the United States, emergency preparedness officials have expressed some concern about the adequacy of these shelters to house evacuated populations. A stringent shelter criterion from the American Red 81
7 Cross (ARC) limits the number of existing structures that can be used to house evacuated people. Shelters cannot be located in the evacuation zones, must be outside the Category 4 storm surge area, and is limited to 20 square feet of space per person. Approved shelters that are used for our Special Needs Population must have 60 square feet of space per person. According to the Statewide Emergency Shelter ReportPlan, Citrus County has 3 shelter locations that meet the ARC standards. Two of thesethe 3 sites include a total of 7 8 separate buildings for a total capacity of 4,7503,647 persons. The buildings on the school campuses estimated deficit of shelter space in the county is 84,476168,703 square feet needed to house an additional 3,6298,820 persons. The report also addresses our Special Needs Shelter space requirements. It reflects the existence of qualifying spaces, equaling 8,2807,680 square feet of capacity. This reflects a deficit surplus of 18,7204,320 square feet/ persons of shelter space. Other buildings identified in the 2014 Statewide Emergency Shelter Plan that either do not meet the ARC standards, or were not yet surveyed, have a total risk capacity of 18,453 people. However, it appears that this report does not reflect the newer educational facilities that should have additional areas constructed to EHPA Standards. The local Emergency Management office is working with the American Red Cross and the School Board in an effort to ensure that the County is credited with all ARC shelter space that exists Hospitals and Health Care Facilities When a large-scale event (such as a hurricane) threatens the County and forces evacuation, impacts may include County hospitals and other health care facilities. During such a scenario, hospitals would not be providing any care during or shortly after the event. Should the event cause significant damage, reentry would not occur for any portion of the general population until the hospital was able to provide care. However, after sudden events that evacuation is not an option, the hospital and other health facilities would serve as critical facilities for the treatment and care of injured, as well as providing ongoing care to the remainder of the community. Additionally, in the case of a flood event, hospitals should expect the influx of citizens, including infirm and aged persons. During interviews, emergency management authorities expressed concern about the possible evacuation of residents of nursing and community facilities prior to a major storm event. As described in the comprehensive plan, the number of older residents possibly requiring such facilities is expected to grow within the County (CCP, 2006) Utilities Electrical and communication utilities plan contingencies and design equipment to mitigate hazard events. Even with this effort, common sense recognizes that services can still be disrupted. In a post-event context, such entities will need to direct mobilized labor and equipment to restore services. Loss of electrical power 82
8 could affect fire flow resources and potable water, especially for some of the smaller or individual systems in Citrus County. Such disruptions could impact emergency management officials' ability to predict when displaced populations can safely return to homes and businesses. Likewise, communication failures could have an immediate impact on directing crews to fix services, or emergency management coordination efforts. The water supplies in Citrus County potentially face a variety of hazards during a flood event. The first is the possible contamination of the public utility and private wells that furnish potable water. Another hazard is the loss of plant capacity resulting from floodwaters. Residents in areas served by private wells also face issues of contamination. A concern during and after the flood event is the ability to properly dispose of sewage. This manifests itself through submerged sanitary sewers, septic systems, and wastewater treatment facilities. During periods of high saturation, such as a flood event, a likely result could be a reduction of the efficiency of such systems. Likewise, septic systems submerged by floodwaters could lead to possible health risks. In such cases, pathogenic organisms are introduced into the environment. Additionally, the higher saturation associated with such events could result in septic drain field failures. A list of the total assets in Citrus County, the City of Crystal River and the City of Inverness are included in Table 14. Type of Structure TABLE 14 Citrus County Assets Citrus County City of Crystal River City of Inverness Total Total Total Total Total Total Structures Exposure Structures Exposure Structures Exposure Agriculture 1,224 $182,485, $2,822, $4,769,266 Churches 193 $42,929, $4,734, $6,415,765 Commercial 2,272 $173,930, $59,458, $48,057,167 Condominium 1,036 $40,309, $9,662, $6,531,882 Governmental 55 $4,114, $992, $34,632,702 Group Homes 45 $28,722, $2,828, $11,704,000 Hospitals 6 $11,970,470 0 $0 16 $14,928,706 Industrial 203 $20,523, $787, $1,659,763 Mobile Homes 14,886 $309,131, $1,345, $1,450,117 Multi-family 419 $24,899, $5,940, $7,004,823 Public 212 $4,098,118 8 $510,940 0 $0 Schools 5 $7,174,236 8 $1,177, $36,238,827 Single Family 35,444 $2,139,999,1 1,172 $65,977,064 2,313 $108,326,02 Single Utilities Family $281,216,248 8 $369, $1,151,175 Total 56,171 $3,271,505,0 2,057 $156,607,345 3,343 $282,870,21 Source: The Kinetic Analysis corporation 79 LMS Data Site 7 83
9 5.3 Impacts of Population, Buildings, and Critical Facilities The following describes the process in which the initial vulnerability assessment was conducted for the 2005 document. The vulnerability assessments used for the 2010 update are reflected in the Tables as prepared by Kinetic Analysis Corporation for use with the LMS Strategies and provided by the State. After the critical facilities were identified and mapped, the focus of the asset identification shifted to assessing vulnerability. Natural hazards such as droughts, landslides, extreme heat and severe storms were not mapped at the County level, as they are likely to impact the entire County, including the City of Crystal River and the City of Inverness. As such, the entire County must be considered somewhat vulnerable to these hazards, although the impacts would be minimal. In regard to the other identified hazards (wildfires, flooding, hurricanes/tropical storms, and hazardous materials), a general spatial analysis was performed to determine the concentration of development (and thus indirectly of people) located within a given search area of the structures. Describing vulnerability in terms of dollar losses provides the community and the State with a common framework with which to measure the effects of hazards on assets. However, the estimated dollar losses obtained through this process are extremely rough and should not be used for purposes other than mitigation planning. The basic process for determining loss estimates required an initial assessment ofrequires initially assessing the level of damage from a hazard event, both as a percentage of the asset's structural and content replacement value, and as a loss of function. Next, the level of damage percentage needs to be multiplied by the value of the structure, contents and use. In this manner, comprehensive loss estimation can be developed which includes the risk to a structure itself, as well as the contents and functions of the structure. The MEMPHIS was used to model hazards across the State of Florida for a variety of hazard scenarios including the flood/wave, wind, hurricane, tornado, sinkhole and, wildfire, tsunami, and earthquake. Damage estimates were used from the MEMPHIS to estimate worst case scenarios for these hazards such as Tsunamis. FEMA's HAZUS-MH was also used to compare the results from different hazard scenarios for earthquakes and hurricanes. Damage estimates for other hazards used the methodology based on FEMA's Understanding Your Risks: Identifying Hazards and Estimating Losses (FEMA 386-2). The result is an estimate of the potential hazard losses that could occur due to an event impacting Citrus County and causing damages. The Citrus County loss estimates included an estimate of structural loss by 84

10 determining the number of structures within the hazard area, grouped by specific occupancy class. The average structural replacement cost multiplied by the percentage of structural damage, when loss estimation tables were available for the particular hazard type. This was added to content loss, which was calculated by determining the average content value (as a percent of the structure value) and multiplying it by the percentage of content damage. Functional downtime was determined by determining the number of days a particular business would be closed due to a particular hazard event and multiplying it by the average daily income. The displacement costs were calculated by multiplying the number of days an owner or business would have to be relocated due to damages at their permanent structure by the average cost of the displacement per day. 5.4 Severe Storms Severe storms can occur anywhere in the County depending on factors such as wind and weather patterns, all of the assets in the county, City of Crystal River or City of Inverness that may be vulnerable;, however, specific building counts are not available for this hazard. In addition, loss estimation tables are not available for severe storms; therefore an estimation of potential losses will be completed as more information becomes available. 5.5 Tornadoes Since tornadoes are unpredictable in their pattern, frequency, and severity, all of Citrus County is vulnerable to tornado induced Figure 17: Tornado Vulnerability damages. Figure 14 shows the tornado risk across Citrus County. There are approximately 114,081 people in Citrus County in the moderate risk area and 4,004 people in the high risk area for tornadoes. Both the City of Crystal River and City of Inverness populations are in the moderate risk area for tornadoes. Over 48.8 percent (1,957) of the population at high risk are disabled. Mobile homes account for just over 26.5 percent of the structures in the county and 4.0 percent of the structures in the City of Crystal River. An additional 12.0 percent of the structures in the county were built prior to Table 15 shows the distribution of assets in the two tornado risk areas. The Memphis program does not identify the City of Inverness as a Census Designated Point (CDP). Therefore, it is assumed that this information is included in the Citrus County/Unincorporated area.data is not available for the City of Inverness. Source: The Kinetic Analysis Corporation LMS 85

11 TABLE 15 Distribution of Structures in Tornado Risk Areas Citrus County City of Crystal River City of Inverness Type of Moderate Risk High Risk Moderate Risk High Risk Structure Exposure Bldgs Exposure Bldgs Exposure Bldgs Exposure Bldgs Single Family $9,310,000,000 34,099 $287,860,000 1,230 $302,060,000 1,164 Mobile Homes $1,160,000,000 13,824 $287,860, $6,400, Multi-family $261,500,000 1,445 $826,680 5 $69,470, Commercial $770,290,000 2,326 $8,490, $242,670, Agriculture $1,530,000, $8,860, $43,020, Government/ $582,110, $159,940, $5,550, Institutional TOTAL $13,610,000,000 52,998 $550,050,000 2,562 $669,170,000 2,063 N/A Source: The Kinetic Analysis corporation LMS data Site Tornadoes can occur anywhere in the County and the path, length, and intensity of each storm will be different. Any given tornado will not result in 100 percent countywide 86
12 damages, but rather a path of damages that will vary based on the location of the structure in relation to the path of the tornado and based on the type, size, and construction of the structure. A few assumptions were made to estimate the losses from a tornado event. First, for the purpose of estimating losses from a tornado, 1 percent of the structures within Citrus County, the City of Crystal River and the City of Inverness were used as a basis. Since tornados would have a greater impact on agricultural structures, mobile homes, and utilities resulting in a greater percent damage, damage functions were assigned to each of the classes of structures. Table 16 shows the estimated dollar losses from a tornado event. Structure Type TABLE 16 Estimated Losses from Tornadoes (based on damage to 1 percent of structures) Total Estimated Damages (Structure Damage, Content Damage, and Loss of Function Damage) Citrus County City of Crystal River City of Inverness Agriculture $4,036, $0 $195, Churches $118, $0 $0 Commercial $1,215, $757, $718, Condominium $0 $196, $191, Governmental $0 $0 $153, Group Homes $0 $0 $0 Hospitals $0 $0 $0 Industrial $0 $0 $0 Mobile Homes $3,165, $26, $25, Multi-family $105, $46, $55, Public $30, $0 $0 Schools $0 $0 $376, Single Family $12,486, $1,098, $1,942, Utilities $0 $0 $0 Total $21,159, $2,125, $3,659, Source: Based on FEMA S Understanding Your Risks: Identifying Hazards and Estimating Losses 5.6 Hurricanes Citrus County is vulnerable to damage from hurricanes and tropical storms. Damages from these events combine storm surge, high winds, and inland flooding. Figure shows the SLOSH basins for Citrus County. The following table was taken from the draft Citrus County Profile, DCA,


13 Figure 1815: Hurricane vulnerability 88


14 Source: Citrus County GIS SectionWRPC 89
. The total expected damages from a category 1 hurricane (Table 17) would be $340.")


15 A category 1 hurricane would result in peak winds of 89 MPH (Figure 1916). The SLOSH maps indicated approximately 4 feet of flooding at Kings Bay/RtSR. 44 in Crystal River and 7.6 feet in Homosassa (Figure 2017). The total expected damages from a category 1 hurricane (Table 17) would be $340.7 million dollars in the County, $11.12 million in the City of Crystal River, and $17.70 million in the City of Inverness. Figure 1916: Category 1 Maxima Wind Speed Figure 2017: Category 1 Maxima Water Depth Source: The Kinetic Analysis Corporation LMS data Site (measured in MPH, Offshore data masked at 100 ft.) A category 2 hurricane would result in peak winds of 111 MPH in the County (Figure 2118). The wind gusts are estimated to be 106 MPH in the City of Crystal River and 99 MHP in the City of Inverness. The SLOSH maps indicate an estimated 7 feet of flooding at SR 19/98 south of Red Level, 11 feet at Kings Bay, 14 feet at Homosassa and 1 foot at Chassahowitzka, east of SR 19/98 (Figure 2219). 90
 The total expected damages from a category 2 hurricane (Table 18) would jump to over $1.02 million dollars in the County, $35.38 million in the City of Crystal River, and $57.")
16 Figure 2118: Category 2 Maxima Wind Speed Figure 2219: Category 2 Maxima Water Depth Source: the Kinetic Analysis Corporation LMS Data Site (measured in MPH, Offshore data masked at 100 ft.) The total expected damages from a category 2 hurricane (Table 18) would jump to over $1.02 million dollars in the County, $35.38 million in the City of Crystal River, and $57.31 million in the City of Inverness. Just over 2.0 percent (1,305) of the housing units in the County would be uninhabitable and 1.8 percent in the City of Crystal River and 1.2 percent in the City of Inverness would be uninhabitable following a category 2 hurricane. 91
17 Figure 21: Category 2 Maxima Wind Speed Figure 22: Category 2 Maxima Water Depth Source: the Kinetic Analysis Corporation LMS Data Site (measured in MPH, Offshore data masked at 100 ft.) A category 3 hurricane would result in peak winds of 130 MPH in the County, 123 MPH in the City of Crystal River and 118 MPH in the City of Inverness (Figure 2320). The County would experience over 12 feet of flooding at SR 19/98, south of Red Level and 18 feet of flooding at Ozello - RtCR An estimated 17 feet of flooding would occur at Kings Bay and 20 feet at Homosassa during a category 3 hurricane. (Figure 2421). Figure 2320: Cat. 3 Maxima Wind Speed Figure 2421: Cat. 3 Maxima Water Depth Source: The kinetic Analysis corporation LMS data Site (measured in MPH, Offshore data masked at 100 ft.) The total expected damages from a category 3 hurricane (Table 19) would be $2.39 billion dollars in the County. The City of Crystal River would sustain $84.68 million in damages and the City of Inverness would experience $ million in damages. 92
18 Over 3,000 (5 percent) of the County's housing units would be uninhabitable and 4.2 percent in the City of Crystal River and 3.1 percent in the City of Inverness following a category 3 hurricane. Figure 23: Cat. 3 Maxima Wind Speed Figure 24: Cat. 3 Maxima Water Depth Source: The kinetic Analysis corporation LMS data Site (measured in MPH, Offshore data masked at 100 ft.) TABLE 19 Estimated Losses for Category 3 Hurricanes Total Estimated Damages (Structure Damage, Content Damage, and Loss of Function Damage) Type of Structure City of Crystal Citrus County River City of Inverness Loss Percent Loss Percent Loss Percent Agricultural $306,740, % $5,240, % $35,300, % Commercial $147,670, % $28,650, % $23,220, % Governmental $91,180, % $735, % $2,400, % Mobile Homes $537,400, % $2,760, % $2,570, % Multi-family $47,910, % $8,490, % $7,600, % Single Family $1,260,000, % $38,810, % $60,810, % Source: The kinetic Analysis corporation LMS data Site Source: The Kinetic Analysis Corporation LMS Data Site (measured in MPH, Offshore data masked at 100 ft. A category 4 hurricane would result in peak winds of 158 MPH in the County. The wind gusts are estimated to reach 150 MPH in the City of Crystal River and 141 MHP in the City of Inverness (Figure 2522). A category 4 hurricane would result in an estimated 15.6 feet of flooding at SR 19/98 south of Red Level, 20 feet of flooding at Kings Bay, 10 feet of flooding at West Venable street in the City of Crystal River area, 26.9 feet of flooding at Homosassa, and 15 feet at Chassahowitzka (Figure 2623). 93
. Over 11 percent (7,023) of the County's housing units would be uninhabitable and nearly 10.")
 Citrus County City of")
19 The total expected damages from a category 4 hurricane would be $5.4 billion Figure 2522: Category 4 Maxima Wind Speed Figure 2623: Category 4 Maxima Water Depth dollars in the County, $ million in the City of Crystal River, and $ million in the City of Inverness (Table 20). Over 11 percent (7,023) of the County's housing units would be uninhabitable and nearly 10.0 percent (191) of the housing units in the City of Crystal River and 7.4 percent (270) in the City of Inverness would be uninhabitable following a category 4 hurricane. A c a t e g o r y 5 Type of Structure TABLE 20 ESTIMATED LOSSES FOR CATEGORY 4 HURRICANES Total Estimated Damages (Structure Damage, Content Damage, and Loss of Function Damage) Citrus County City of Crystal River City of Inverness Loss Percent Loss Percent Loss Percent $12,620, % $89,990, % $67,720, % $56,770, % Agricultural $698,370, % Commercial $34 7,450, % Governmental $210,400, % $1,700, % $5,900, % Mobile Homes $1,100,000, % $5,350, % $5,450, % Multi-family $111,760, % $19,760, % $18,310, % Single Family $2,930,000, % $89,090, % $147,010, % Source: The Kinetic Analysis corporation LMS Data site 94
.")
.")
20 Figure 2724: Category 5 Maxima Wind Speed Figure 2825: Category 5 Maxima Water Depth A category 5 hurricane would result in peak winds of 181 MPH in the County. The wind gusts are estimate to be 170 MPH in the City of Crystal River and 162 MHP MPH in the City of Inverness (Figure 2724). A category 5 hurricane would result in 22 feet of flooding along SR 19/98 south of Red Level, over 16 feet of flooding along West Venable Street in the City of Crystal River area and 28 feet of flooding at Kings Bay. Over 32 feet of flooding would be experienced at Homosassa and over 22 feet at Chassahowitzka (Figure 2825). The total expected damages from a category 5 hurricane (Table 21) would be $8.96 billion dollars in the County, $ million in the City of Crystal River, and $ million in the City of Inverness. Over 12,000 housing units in the County (12,320, 19.8 percent) would be uninhabitable and 17.7 percent (346) in the City of Crystal River and 13.3 percent (484) in the City of Inverness would be uninhabitable following a category 5 hurricane. Type of Structure TABLE 21 Estimated Losses for Category 5 Hurricanes Total Estimated Damages (Structure Damage, Content Damage, and Loss of Function Damage) Citrus County City of Crystal River City of Inverness Loss Percent Loss Percent Loss Percent Agricultural $1,250,000, % $22,730, % $169,030, % Commercial $624,920, % $123,390, % $104,780, % Governmental $376,200, % $3,160, % $10,890, % Mobile Homes $1,260,000, % $6,360, % $6,410, % Multi-family $202,790, % $35,730, % $33,600, % Single Family $5,240,000, % $162,450, % $271,390, % Source: The Kinetic Analysis Corporation LMS data Site One additional way to measure the vulnerability of Citrus County's infrastructure to hurricanes or other coastal events was to run a hazard scenario on FEMA's Hazards 95
21 U.S. Multi-Hazard (HAZUS-MH). The historic scenario calculated the damages that would result if Hurricane Easy were to hit the Coast of Citrus County today. By using a historic event and using today's infrastructure, one can compare the damages sustained from the same hurricane in 1950 and today. If Hurricane Easy were to strike the coast of Citrus County today, HAZUS-MH estimates that approximately 4,638 buildings would be at least moderately damaged and an estimated 250 structures would be completely destroyed. The expected numbers of buildings impacted by this scenario are presented in Tables 22 and 23 below. TABLE 22 Expected Building Damage by Occupancy Type of Structure Hurricane Easy None Minor Moderate Severe Destruction Commercial Education Government Industrial Religion Residential 40,150 13,765 3, Total 40,333 13,834 3, Source: HAZUS-MH Note: The total numbers of structures by categories in HAZUS-MH are based on Census 2000 data and may differ from the numbers from the Citrus County Appraisers Office. TABLE 23 Expected Building Damage by Building Type Type of Structure Hurricane Easy None Minor Moderate Severe Destruction Concrete Masonry 18,421 7,957 1, Manufactured Housing 14,619 1, Steel Wood 6,057 3, Total 40,172 12,586 3, Source: HAZUS-MH Note: The total numbers of structures by categories in HAZUS-MH are based on Census 2000 data and may differ from the numbers from the Citrus County Appraisers Office. According to the hospitals, Citrus Memorial Hospital Health System has 198 beds and Seven Rivers Hospital Regional Medical Center has 128 beds. Before the hurricane, there would be an estimated 326 hospital beds available for use and they would all be filled for at least 1 week. HAZUS-MH estimates that 57 percent of the hospital beds would be available 30 days after the event occurred. HAZUS-MH also estimated the amount of debris that would be generated if a hurricane similar to Hurricane Easy were to strike Citrus County. The debris for this 96
 Reinforced Concrete/Steel (0%) Trees 967,184.")
22 scenario would exceed 1 million tons (1,954 truckloads). The debris calculations are shown in the Table 24 below. TABLE 24 Debris Calculations Type of Debris Hurricane Easy Brick/Wood 50, Tons (5%) Reinforced Concrete/Steel (0%) Trees 967, Tons (95%) Total 1,018,089 Tons Source: HAZUS-MH The wind vulnerability for the County, City of Crystal River, and City of Inverness is similar with areas directly along the coast in the County and the City of Crystal River expected to suffer more direct wind damage from coastal storms than the other areas of the county given their proximity to the shoreline. However, the county's coastal location puts all of its communities at risk from high winds from coastal storms. The following maps reflect the hurricane vulnerable areas as shown on the existing land use as compared to the areas shown on the generalized future land use maps. 97
23 The following maps reflect the coastal hazard vulnerable areas as shown on the existing land use as compared to the areas shown on the generalized future land use maps. 98
24 HAZUS Historical Hurricane Event: Jeanne General Building Stock Damage Hazus estimates that about 2 buildings will be at least moderately damaged. This is over 0% of the total number of buildings in the region. There are an estimated 0 buildings that will be completely destroyed. The definition of the damage states is provided in Volume 1: Chapter 6 of the Hazus Hurricane technical manual. Table 2 below summarizes the expected damage by general occupancy for the buildings in the region. Table 3 summarizes the expected damage by general building type. Table 2: Expected Building Damage by Occupancy None Minor Moderate Severe Destruction Occupancy Count (%) Count (%) Count (%) Count (%) Count (%) Agriculture Commercial 3, Education Government Industrial 1, Religion Residential 66, Table 3: Expected Building Damage by Building Type None Minor Moderate Severe Destruction Building Type Count (%) Count (%) Count (%) Count (%) Count (%) 99
25 Concrete 2, Masonry 29, MH 16, Steel 1, Wood 14, Debris Generation Hazus estimates the amount of debris that will be generated by the hurricane. The model breaks the debris into four general categories: a) Brick/Wood, b) Reinforced Concrete/Steel, c) Eligible Tree Debris, and d) Other Tree Debris. This distinction is made because of the different types of material handling equipment required to handle the debris. The model estimates that a total of 29,663 tons of debris will be generated. Of the total amount, 25,225 tons (85%) is Other Tree Debris. Of the remaining 4,438 tons, Brick/Wood comprises 2% of the total, Reinforced Concrete/Steel comprises of 0% of the total, with the remainder being Eligible Tree Debris. If the building debris tonnage is converted to an estimated number of truckloads, it will require 4 truckloads (@25 tons/truck) to remove the building debris generated by the hurricane. The number of Eligible Tree Debris truckloads will depend on how the 4,337 tons of Eligible Tree Debris are collected and processed. The volume of tree debris generally ranges from about 4 cubic yards per ton for chipped or compacted tree debris to about 10 cubic yards per ton for bulkier, uncompacted debris. The total economic loss estimated for the hurricane is 4.7 million dollars, which represents 0.06 % of the total replacement value of the region s buildings. Building-Related Losses The building related losses are broken into two categories: direct property damage losses and business interruption losses. The direct property damage losses are the estimated costs to repair or replace the damage caused to the building and its contents. The business interruption losses are the losses associated with inability to operate a business because of the damage sustained during the hurricane. Business interruption losses also include the temporary living expenses for those people displaced from their homes because of the hurricane. The total property damage losses were 5 million dollars. 1% of the estimated losses were related to the business interruption of the region. By far, the largest loss was sustained by the residential occupancies which made up over 96% of the total loss. Table 4 below provides a summary of the losses associated with the building damage. Table 5: Building-Related Economic Loss Estimates (Thousands of dollars) Category Area Residential Commercial Industrial Others Total Building Loss Building 3, , Content
26 Inventory Subtotal 4, , Business Interruption Income Relocation Rental Wage ALL Subtotal Total 4, , Extreme Summer Heat Extreme summer heat would generally affect the entire county, including the City of Crystal River and the City of Inverness in the same manner and would not result in structural damages; therefore, specific building counts and damage function tables are not available to assess the vulnerability of this hazard. 5.8 Floods This section discusses the vulnerability of Citrus County to damage by the flooding described in the Hazard Profile. Flooding of vacant land or land that does not have a direct effect on people or the economy is generally not considered a problem. Flood problems arise when floodwaters cover developed areas, locations of economic importance and infrastructure. Damage to buildings, particularly residential buildings, is usually the largest single flood problem a community faces. Nearly one-half of Citrus County lies within the 100-year floodplain as shown on the communities' FIRMs. Therefore, a significant portion of existing development in the County is located in the various flood zones and is vulnerable to flooding and flood damages. Base flood elevations within the County range from 8 ft NGVD within VE zones in the City of Crystal River to 45 ft NGVD around Floral City. Figure illustrates the various flood zones in Citrus County. In Citrus County, over 27,000 people live in the 100-year flood zones where there is at least a 1 percent chance of being flooded in any given year. Of these residents, 13,535 are listed as having a disability. Over 1,600 of the County's residents live in the high velocity zone along the coast. Tables 25, 26, and 27 provide the results of the analysis indicating the number of structures in Citrus County, the City of Crystal River, and the City of Inverness that are vulnerable to flooding. Figure 29: FEMA FIRM Zones 101


27 TABLE
28 Distribution of Citrus County Structures in Flood Hazard Areas Citrus County Type VE A and AE AH X and X500 Exposure Bldgs Exposure Bldgs Exposure Bldgs Exposure Bldgs Single Family $364,280,000 4,141 $1,713,250,000 7,108 $8,990, $7,814,810,000 27,940 Mobile Homes $91,550, $375,460,000 4,422 $2,850, $918,060,000 10,462 Multi-family $289,790, $92,188, $211,080 1 $162,260, Commercial $126,380, $320,540, $0 0 $468,130,000 1,470 Agriculture $1,090,000, $134,550, $0 0 $406,770, Government/ $7,870,000 1 $1,096,380, $1,330,000 1 $633,880, Institutional TOTAL $1,970,000,000 5,919 $3,740,370,000 13,388 $13,380, $10,398,430,000 42,091 Source: the Kinetic Analysis Corporation LMS Data Site TABLE 26 Distribution of City of Crystal River Structures in Flood Hazard Areas City of Crystal River Type VE A and AE AH X and X500 Exposure Bldgs Exposure Bldgs Exposure Bldgs Exposure Bldgs Single Family $17,580, $277,310, $0 0 $12,960, Mobile Homes $61,990, $17,580, $0 0 $569,850,000 9 Multi-family $233,910, $61,990, $0 0 $6,665, Commercial $39,510, $233,910, $0 0 $9,620, Agriculture $5,560, $39,510, $0 0 $3,440,610 3 Government/ $0 0 $5,560, $0 0 $54,150 1 Institutional TOTAL $358,540, $635,850,000 1,920 $0 0 $33,320, Source: The Kinetic Analysis Corporation LMS Data Site Please Note: The updated information from the Kinetic Analysis Corp. does not contain any information for the City of Inverness. TABLE 27 Distribution of City of Inverness Structures in Flood Hazard Areas Type City of Inverness VE A and AE AH X and X 500 Exposure Bldgs Exposure Bldgs Exposure Bldgs Exposure Bldgs Single Family Mobile Homes Multi-family Commercial Agriculture Government/ Institutional TOTAL N/A Source: The Kinetic Analysis Corporation LMS Data Site As noted earlier, the Memphis system does not recognize the City of Inverness as a Census Designated Point. Therefore, it is assumed that the data for the City is included 103
29 in the Unincorporated totals. However, The Draft Citrus County Profile by the Florida Department of Community Affairs (2005), Table 2.6 indicates that the City of Inverness has a total 23.5 acres in the Special Flood Hazard Area, with 6.1 acres as vacant land. There are 35 critical facilities that were deemed to be vulnerable to flood hazards. These facilities are shown in Table TABLE 2827 Critical Facilities Vulnerable to Flood Critical Facility Fire Station 7 Government Buildings 5 Hospital/Health 5 School/Shelter 5 Water/Wastewater 5 Utility/Other 8 Total 35 Critical Facilities Vulnerable to Flood According to data from MEMPHIS, the estimated flood depth for a 100O-year event in Citrus County is 2.3 feet and 0.8 foot in the City of Crystal River. There was no depth of flooding in the City of Inverness. Losses were estimated for flood events based on the methodology in FEMA's Understanding Your Risks: Identifying Hazards and Estimating Losses. First the structures located within the 100O-year floodplain on the FIRM were identified. The average flood depth used in the calculations was determined to be 2.0 feet for the County and 1.0 foot for the City of Crystal River and the City of Inverness. Next the percent of damages was calculated using FEMA guide for both the A and AE Zones and the VE zone and the potential losses from a flood event was calculated (Table 2928). TABLE 2928 Estimated Losses for Floods 104
30 Structure Type Total Estimated Damages (Structure Damage, Content Damage, and Loss of Function Damage) Citrus County City of Crystal River City of Inverness Agriculture $14,793,194 $1,030,765 $39,228 Churches $4,390,097 $1,845,123 $0 Commercial $77,479,615 $30,412,759 $586,120 Condominium $8,755,181 $3,295,693 $0 Governmental $1,350,598 $524,660 $0 Group Homes $550,333 $559,739 $0 Hospitals $4,924,667 $0 $0 Industrial $6,717,117 $717,784 $0 Mobile Homes $85,000,732 $962,036 $1,257,676 Multi-family $3,010,635 $1,010,287 $0 Public $1,241,235 $51,581 $0 Schools $27,281 $369,408 $0 Single Family $240,072,558 $24,834,287 $497,554 Utilities $179,605,114 $2,538,350 $0 Total $627,918,357 $68,152,471 $2,380,578 Source: Based on FEMA s Understanding Your Risks: Identifying Hazards and Estimating Losses 105

31 HAZUS 100 Year Event: Coastal and Riverine Flooding Building Exposure by Occupancy Type for the Scenario 106
32 Occupancy Exposure ($1000) Percent of Total Residential 3,151, % Commercial 727, % Industrial 145, % Agricultural 18, % Religion 85, % Government 18, % Education 25, % Total 4,174, % Hazus estimates that about 10,850 buildings will be at least moderately damaged. This is over 78% of the total number of buildings in the scenario. There are an estimated 5,584 buildings that will be completely destroyed. The definition of the damage states is provided in Volume 1: Chapter 5.3 of the Hazus Flood Technical Manual. Table 3 below summarizes the expected damage by general occupancy for the buildings in the region. Table 4 summarizes the expected damage by general building type. Table 3: Expected Building Damage by Occupancy Substantiall y Coun Coun Coun Coun Coun Coun Occupancy t (%) t (%) t (%) t (%) t (%) t (%) Agriculture Commercial Education Government Industrial Religion Residential , , , Total Table 4: Expected Building Damage by Building Type Substantially Building Coun Coun Coun Coun Coun Coun Type t (%) t (%) t (%) t (%) t (%) t (%) Concrete
33 8 8 7 ManufHousi ng , Masonry , , , Steel Wood Before the flood analyzed in this scenario, the region had 489 hospital beds available for use. On the day of the scenario flood event, the model estimates that 361 hospital beds are available in the region. Shelter Requirements Hazus estimates the number of households that are expected to be displaced from their homes due to the flood and the associated potential evacuation. Hazus also estimates those displaced people that will require accommodations in temporary public shelters. The model estimates 9,489 households will be displaced due to the flood. Displacement includes households evacuated from within or very near to the inundated area. Of these, 23,303 people (out of a total population of 118,085) will seek temporary shelter in public shelters. The total economic loss estimated for the flood is 1, million dollars, which represents % of the total replacement value of the scenario buildings. Building-Related Losses The building losses are broken into two categories: direct building losses and business interruption losses. The direct building losses are the estimated costs to repair or replace the damage caused to the building and its contents. The business interruption losses are the losses associated with inability to operate a business because of the damage sustained during the flood. Business interruption losses also include the temporary living expenses for those people displaced from their homes because of the flood. The total building-related losses were 1, million dollars. 0% of the estimated losses were related to the business interruption of the region. The residential occupancies made up 57.55% of the total loss. Table 6 below provides a summary of the losses associated with the building damage. Table 6: Building-Related Economic Loss Estimates (Millions of dollars) Category Area Residential Commercial Industrial Others Total Building Loss Building Content Inventory

34 Subtotal 1, , Business Interruption Income Relocation Rental Income Wage ALL Subtotal Total 1, , Drought In that drought is a regional issue, the impacts from this hazarddrought will generally affect the entire county in the same manner and would not result in structural damages; therefore, specific building counts are not available to assess the vulnerability of this hazard. Factors that contribute to the vulnerability of drought include water reserves, agricultural production, water conservation efforts, and the duration of the drought event Fires There are over 6,000 people living in high wildfire risk areas in Citrus County and nearly one-half (2,956) are somewhat disabled. Figure 30 shows the wildfire risk areas in the County. Figure 30: FDOF Fire Risk Tables 30, 31, and 32 show the distribution of structures in the wildfire risk areas of the County, City of Crystal River and City of Inverness. Source: The Kinetic Analysis Corporation LMS Data Site OCCURRENCE TRENDS: 109
35 Characteristic Fire Intensity Scale (FIS) specifically identifies areas where significant fuel hazards and associated dangerous fire behavior potential exist based on a weighted average of four percentile weather categories. Similar to the Richter scale for earthquakes, FIS provides a standard scale to measure potential wildfire intensity. FIS consist of 5 classes where the order of magnitude between classes is ten-fold. The minimum class, Class 1, represents very low wildfire intensities and the maximum class, Class 5, represents very high wildfire intensities. Refer to descriptions below: Class 1, Very Low: Very small, discontinuous flames, usually less than 1 foot in length; very low rate of spread; no spotting. Fires are typically easy to suppress by firefighters with basic training and non-specialized equipment. Class2, Low: Small flames, usually less than two feet long; small amount of very short range spotting possible. Fires are easy to suppress by trained firefighters with protective equipment and specialized tools. Class 3, Moderate: Flames up to 8 feet in length; short-range spotting is possible. Trained firefighters will find these fires difficult to suppress without support from aircraft or engines, but dozer and plows are generally effective. Increasing potential for harm or damage to life and property. Class 4, High: Large Flames, up to 30 feet in length; short-range spotting common; medium range spotting possible. Direct attack by trained firefighters, engines, and dozers is generally ineffective, indirect attack may be effective. Significant potential for harm or damage to life and property. Class 5, Very High: Very large flames up to 150 feet in length; profuse short-range spotting, frequent long-range spotting; strong fire-induced winds. Indirect attack marginally effective at the head of the fire. Great potential for harm or damage to life and property. 110
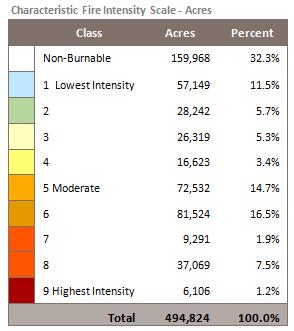
36 111

37 Much of Central Florida, which includes Citrus County, has experienced moderate to severe drought conditions for the past five years. These conditions have been aggravated by increases in the occurrences and durations of hard freeze periods creating reduced live and dead fuel moisture content and surface fuel load increases. This past five year period from January January 2009 represents the most probable existing and near future wildland fire vulnerability for the county. The county is comprised of three major topographical regions, each with its own characteristic major vegetative fuel types and wildfire hazards. These regions are depicted on the map on page 97.The Coastal Region is generally depicted as the land area to the west of County Road 495 and US 19 to the Gulf of Mexico and is characterized by extensive coastal wetlands of marsh grasses, Cypress and hardwood swamps. Much of this region is designated as Conservation lands with the largest being the Chassahowitzka Wildlife Refuge comprising 31,000 acres. The major population areas within this region are the communities of the City of Crystal River, Homosassa and Homosassa Springs. During the past five year period, this 112
38 region has experienced a total of 152 wildland fires which burned 1,067 acres. The majority of these fires were due to lightning caused ignitions. The Central Ridge Region of the county contains the highest elevation and is known as the Brooksville Ridge. It is generally the areas bounded by County Road 495 and US 19 on the west and US 41 on the east. The region is characterized by sand hills with the major wildland fuels vegetation being Sand Pines with brush understory, Long Leaf Pines mixed with Turkey Oak and mixed grasses and shrubs. The major population areas comprising the Central Region are the communities of Lecanto, Beverly Hills, and Citrus Springs. The five year wildfire history for this region reflects a total of 160 wildland fire occurrences with a total of 1,765 acres burned. The majority of wildland fire causes within this region are due to human carelessness and arson. The Eastern Region of the county are the lakes and rivers regions comprised of the Withlacoochee River, the Tsala Apopka Plain and an interconnected series of lakes known as the Tsala Apopka Chain. It is the area bordering and to the east of US 41 to the county s eastern border along the Withlacoochee River. The major vegetative fuel types are fresh water wetlands of river bottom hardwoods, oak hammocks, and grass pastures. The major population centers within this region are Hernando, the City of Inverness and Floral City. This region has experienced the greatest impact from the prolonged drought conditions with many of the smaller lakes and wetlands losing their surface water and exposing bottom lands comprised mainly of peat and muck. During the past five years this region has experienced a total of 54 wildland fires; however, these fires consumed the greatest acreage at 1,937. This was due primarily to the lack of access for suppression equipment due to the swamp and muck surface conditions. These fires were caused primarily by lightning ignitions and carelessness during human recreational activities. An overlay depicting the county s major fuel type region and fire occurrences by county township and range is presented below in Figure
 completed by the local Division of Forestry wildfire mitigation specialist in partnership with the Southern Group of State")
39 COUNTY WILDFIRE EXPOSURE ASSESSMENTS Several community wildland fire risk assessments have been completed within the county but for the purpose of this vulnerability assessment, the three regionalsouthern Wildfire risk assessments (Coastal, Central and Eastern) completed by the local Division of Forestry wildfire mitigation specialist in partnership with the Southern Group of State Foresters were used. These assessments evaluated the risk factors within the three topographical/fuel type regionsand impacts within the county. The results of these assessments are as follows: Coastal Region - MODERATE RISK Central Region - LOW RISK Eastern Region - MODERATE RISK The major factors differentiating these regions were: vegetative fuel types, Wildfire Urban Interface percentage, wildland fire occurrence rates and causes, defensive space between structures and wildlands and building construction types and materials (mobile home vs. block/stucco). An overall wildland fire vulnerability rating for the county would be low to moderate. 114
 consistent with Federal Register National standards.")
40 The Wildland Urban Interface (WUI) Risk Index layer is a rating of the potential impact of a wildfire on people and their homes. The key input, WUI, reflects housing density (houses per acre) consistent with Federal Register National standards. The location of people living in the Wildland Urban Interface and rural areas is key information for defining potential wildfire impacts to people and homes. 115
41 REGIONAL VULNERABILITY LEVELS OF CONCERN: WUI is described as the area where structures and other human improvements meet and intermingle with undeveloped wildland or vegetative fuels. Population growth within the WUI substantially increases the risk from wildfire. For the Citrus project area, it is estimated that 137,948 people or 98 percent of the total project area population (141,215) live within the WUI. The following table shows the total population for each WUI area within the project area. 116


42 To better understand of the vulnerability of the communities within the topographical 117
43 regions, the 2005 Mapping for Emergency Management Parallel Hazards Information System (MEMPHIS) for the major factors was reviewed. The MEMPHIS study addressed seven Census Designated Point (CDP) areas within Citrus County - (Beverly Hills, Black Diamond, Citrus Hills, the City of Crystal River, Hernando, Homosassa and Lecanto). These areas were then aligned with the appropriate topographical region risk assessment areas as follows: Coastal Region: Crystal River and Homosassa; Central Region: Beverly Hills, Citrus Hill and Lecanto and Eastern Region: Hernando and Black Diamond, TABLE 30 Citrus County Distribution of Structures in Wildfire Hazard Area Citrus County Type of Structure Low Risk Medium Risk High Risk Exposure Bldgs Exposure Bldgs Exposure Bldgs Single Family $2,153,750,000 8,593 $1,977,780,000 7,524 $4,917,160,000 20,207 Mobile Homes $4,917,160,000 20,207 $221,370,000 2,555 $673,500,000 7,304 Multi-family $673,500,000 7,304 $57,830, $317,980,000 1,308 Commercial $317,980,000 1,308 $116,540, $1,484,450,000 1,149 Agriculture $1,484,450,000 1,149 $57,150, $497,170, Government/ Institutional $497,170, $217,590, $222,380, TOTAL $10,050,000,000 39,143 $2,677,500,000 11,257 $8,106,830,000 30,907 Source: The Kinetic Analysis Corporation LMS Data Site TABLE 31 Crystal River Distribution of Structures in Wildfire Hazard Areas City of Crystal River Type of Structure Low Risk Medium Risk High Risk Exposure Bldgs Exposure Bldgs Exposure Bldgs Single Family $52,150, $39,100, $126,650, Mobile Homes $126,650, $660, $11,811, Multi-family $11,811, $5,611, $55,320, Commercial $55,290, $34,024, $151,920, Agriculture $151,920, $3,180, $20,970, Government/ Institutional $20,970, $103,030 2 $5,445,280 9 TOTAL $418,830,000 1,213 $71,690, $372,130,000 1,019 Source: The Kinetic Analysis Corporation LMS Data Site Please Note: The updated information from the Kinetic Analysis Corporation does not contain any information for the City of Inverness. TABLE 32 City of Inverness Distribution of Structures in Wildfire Hazard Areas Type of City of Inverness 118
44 Structure Low Risk Medium Risk High Risk Single Family Mobile Homes Multi-family Commercial Agriculture Government/ Institutional TOTAL Exposure Bldgs Exposure Bldgs Exposure Bldgs N/A Source: The Kinetic Analysis Corporation LMS Data Site The City of Inverness was not Concerns over fire hazards in the county centered on the natural gas pipeline and on various areas within the county identified as a Census Designated Point (CDP) in the MEMPHIS study. The unincorporated areas are assumed to be dispersed across all three regions. The vulnerability ratings used within the MEMPHIS study were identified as levels of concern, and used as a rating tool developed for the Florida Division of Forestry s Fire Risk Assessment System. The ratings range from low (1) to high (9). To better align the level of concern ratings with the risk factor ratings of the regional risk assessments, only medium (5) to high (9) level of concern values were used. The data is summarized in the following two tables. Table 29 represents the CDP communities within the MEMPHIS study and Table 30 for the unincorporated areas. They are a best attempt to identify the population numbers, % of county total, number of structures and their exposure values for Medium to High level of concern CDPs within the three wildfire regions. The unincorporated data is considered representative for all of the regionshaving a high potential for brush/wildfires, including the Withlacoochee State Forest. Analyses were conducted to delineate zones by degree of risk to fire damage around the potential wildfire areas and pipeline. These zones were cataloged as high, moderate, and low risk (Figure 31). 119
45 In summary, the current wildfire exposure level of concern based upon the 2009 risk assessments and the 2005 MEMPHIS study: 14% of the county s citizens reside within incorporated areas with a low to moderate wildfire risk exposure. Within the county s unincorporated areas, 47% face a low to moderate wildfire risk exposure. However, within all of the three low to moderate wildfire risk regions, there is a medium to high concern for the vulnerability of the regions citizens and private and commercial structures to the effects of a wildfire. A 500-foot buffer was identified for the area surrounding the pipeline or fire risk area and was defined as the high-risk zones. The moderate risk zones were identified as 1,600 feet from the pipeline or fire area and 1-mile was defined as the low-risk zone. All critical facilities present were identified for each zone. In addition to critical facilities, the number of wooden structures was also examined, because they are at 120
 as having a high potential for brush/wild fires.")
46 higher risk to be damaged by flying embers than are many other types of structures. Figure 31: Fire Vulnerability Source: Citrus County GIS Section The study identified 20 areas (including the Withlacoochee State Forest) as having a high potential for brush/wild fires. Ninety three critical facilities (Table 33) were identified within the high-, moderate- and low-risk zones surrounding these areas. The analysis estimated that 97 wooden structures are located within the high- (15 structures), moderate- (21 structures), and low- (61 structures) risk zones surrounding the potential brush/wild fire areas. TABLE 3331 Distribution of Critical Facilities in Wildfire Risk Areas Critical Facilities Vulnerable Critical Facility to Wildfire High Moderate Low Fire Station Government Building Hospital/Health School/Shelter Water/Wastewater Utility/other Total
47 To determine the community's vulnerability to wildfires, a general spatial analysis was performed. The concentration of development (and thus indirectly of people) located within a given search area of the known wildfire hazard areas was determined using the GIS structure coverage provided by the County. The analysis assumed 100 percent losses in the high hazard areas, 75 percent losses in the moderate hazard areas; and 25 percent losses in the low hazard areas. Table shows the estimated losses for wildfires. TABLE 3432 Estimated Losses for Wildfires Total Estimated Damages (Structure Damage, Content Type of Structure Damage, and Loss of Function Damage) Citrus County City of Crystal River City of Inverness Agriculture $105,063,685 $2,640,077 $2,685,299 Churches $14,152,647 $2,854,394 $0 Commercial $149,315,693 $17,659,022 $15,084,171 Condominium $36,446,884 $3,371,465 $3,161,598 Governmental $1,517,384 $1,097,245 $749,957 Group Homes $9,712,143 $356, $3,542,503 Hospitals $607,447 $0 $0 Industrial $22,265,161 $2,081,973 $100,800 Mobile Homes $134,306,770 $549,968 $199,577 Multi-family $8,127,138 $3,199,144 $1,338,282 Public $3,464,491 $0 $0 Schools $8,459,837 $139,683 $0 Single Family $979,362,099 $22,689,271 $23,4 78,869 Utilities $15,082,973 $117,848 $680,219 Source: Based on FEMA s Understanding your Risks: identifying Hazards and Estimating Losses The following maps reflect 5.11 Earthquakes Citrus County, including the wildfire vulnerablecity of Crystal River and the City of Inverness are in the Very Low Risk Zone (0.02g) for earthquakes (Figure 32). Earthquakes are rare occurrences outside of the known seismic areas as shown on the existing land use as comparedof the west coast and the New Madrid Fault. Any earthquake that occurs outside of Citrus County would not result in major damages to the infrastructure in Citrus County, resulting in a low level of vulnerability to the County. 122
48 Figure 32: USGS 50 Yr. Earthquake Source: The Kinetic Analysis corporation LMS Data Site To measure the vulnerability of Citrus County's infrastructure to an earthquake, a hazard scenario was run on HAZUS-MH. The arbitrary scenario calculated the damages from a magnitude 5.0 earthquake with an epicenter 10 kilometers below the middle of Citrus County. HAZUS-MH estimated that approximately 3,498 buildings would be at least moderately damaged. The expected numbers of buildings impacted by this scenario are presented in Table 35 and Table 36. HAZUS estimated that there would not be any major damages to any critical facilities or transportation components (highways, bridges, etc.) from this earthquake scenario. The only utility projected to be damaged is communications and it would resume at least 50 percent functionally after the first day. According to HAZUS-MH, the event would result in less than 12 breaks to utility pipelines (water, wastewater, or gas) and just over 50 leaks Landslides Citrus County is not prone to landslides and there are no known landslide hazard areas shown on the generalized future land use maps. 123

49 5.11 Earthquakes Citrus County, including the City of Crystal River and the City of Inverness are in the 124

50 Very Low Risk Zone (0.02g) for earthquakes (Figure 32). Earthquakes are rare occurrences outside of the known seismic areas of the west coast and the New Madrid Fault. Any earthquake that occurs outside of Citrus County would not result in major damages to the infrastructure in Citrus County, resulting in a low level of vulnerability to the County. Figure 32: USGS 50 Yr. Earthquake To measure the vulnerability of Citrus County's infrastructure to an earthquake, a hazard scenario was run on HAZUS- MH. The arbitrary scenario calculated the damages from a magnitude 5.0 earthquake with an epicenter 10 kilometers below the middle Source: The Kinetic Analysis corporation LMS Data Site of Citrus County. HAZUS- MH estimated that approximately 3,498 buildings would be at least moderately damaged. The expected numbers of buildings impacted by this scenario are presented in Table 35 and Table 36. TABLE 35 Expected Building Damage by Occupancy Type of Structure Magnitude 5.0 Earthquake None Slight Moderate Extensive Complete Commercial Education Government Industrial Other Residential 14,40 2,069 1, Religion Single-Family 34,584 3,921 1, Total 49,267 6,017 2, Source: HAZUS-MH Note: The total numbers of structures by categories in HAZUS-MH are based on Census 2000 data and may differ from the numbers from the Citrus County Appraisers Office. TABLE 36 Expected Building Damage by Building Type 125
51 Type of Structure Magnitude 5.0 Earthquake None Slight Moderate Extensive Complete Concrete 1, Manufactured Housing 13,982 2,038 1, Precast Reinforced Masonry Unreinforced Masonry 23,332 3,229 1, Wood 9, Total 49,123 5,845 2, Note: The total numbers of structures by categories in HAZUS-MH are based on Census 2000 data and may differ from the numbers from the Citrus County Appraisers Office. HAZUS estimated that there would not be any major damages to any critical facilities or transportation components (highways, bridges, etc.) from this earthquake scenario. The only utility projected to be damaged is communications and it would resume at least 50 percent functionally after the first day. According to HAZUS-MH, the event would result in less than 12 breaks to utility pipelines (water, wastewater, or gas) and just over 50 leaks Landslides Citrus County is not prone to landslides and there are no known landslide hazard areas within Citrus County, the City of Crystal River, or the City of Inverness. Potential losses will be estimated when additional information becomes available Land Subsidence Land subsidence and sinkholes would impact the entire County in the same manner; however, the risk is based primarily on past occurrences and location/ relationship to known sinkhole hazard areas. The majority of the sinkholes in Citrus County have occurred in the northwestern part of the County, and many have impacted roadways. Figure illustrated illustrates the areas of known sinkholes. 126

52 Figure 3337: Sinkhole Risk Source: The Kinetic Analysis Corporation LMS Data Site There are 12,393 people living in areas classified as extreme sinkhole risk areas. Of these, over 10 percent are below the poverty level and an additional 42 percent are disabled. Table and Table show the distribution of structures in the County, City of Crystal River, and City of Inverness in sinkhole hazard areas 127
53 TABLE 3733 Distribution of Citrus County Structures in Sinkhole Hazard Areas Citrus County Medium High Very High Extreme Adjacent Type of Structure Exposure (in 1,000s) Bldgs Exposure (in 1,000s) Bldgs Exposure (in 1,000s) Bldgs Exposure (in 1,000s) Bldgs Exposure (in 1,000s) Single $5,270,000 18,823 $2,150,000 8,085 $1,170,000 4,529 $641,960 2,544 $40, Family Mobile $601,000 7,128 $250,030 2,898 $181,670 2,158 $115,080 1,414 $6, Homes Multi-family $104, $71, $53, $22, $1, Commercial $279, $166, $145, $139, $26, Agriculture $1,210, $160, $86, $47, $2,490 1 Government/ $539, $85, $51, $33, $1,230 2 Institutional TOTAL $8,000,000 28,412 $2,880,000 12,147 $1,690,000 7,661 $1,000,000 4,528 $78, Source: The Kinetic Analysis Corporation LMS Data Site Bldgs TABLE 3834 Distribution of Structures in Sinkhole Hazard Area Type of Structure City of Crystal River Medium High Very High Extreme Adjacent Exposure Bldgs Exposure Bldgs Exposure Bldgs Exposure Bldgs Exposure Bldgs $17,180, $75,120, $115,900, $63,300, $1,260,000 9 Single Family Mobile Homes $97,680 2 $856, $3,680, $1,710, $0 0 Multi-family $1,180,000 5 $17,550, $29,850, $11,720, $163,910 1 Commercial $0 0 $41,540, $146,460, $44,300, $
54 Agriculture $668,010 2 $4,720, $25,750, $10,570, $0 0 Government/ Institutional $0 0 $999,430 4 $553,180 2 $4,000,000 5 $0 0 TOTAL $19,130, $140, $322,200, $135,600, $1,430,000 9 Source: The Kinetic Analysis Corporation LMS Data Site 129

55 The following maps (Figures 38 & 39) reflect the sinkhole vulnerable areas as shown on the existing land use as compared to the areas shown on the generalized future land use Tsunamis The possibility of a tsunami occurring on the west coast of Florida is very remote; 130

56 however, the consequences would be great. A tsunami loss estimation model has not been designed for Florida; therefore, this study estimated the damages based on 100 percent losses in the Tsunami Inundation Area shown in Figure 34. There are approximately 25,521 people living in the Tsunami Inundation Area in Citrus County and an additional 3,339 in the City of Crystal River. The Tsunami Inundation Zone does not reach the City of Inverness. Of those individuals, approximately 30 percent (8,514) are over the age of 65 and 47 percent (13,508) are disabled. Table 39 documents the number and value of structures in the Tsunami Inundation Zone. Figure 34: Tsunami Inundation Area Source: The Kinetic Analysis corporation LMS Data Site Note: These are the updated tables that show all structures lying Out of Zone Table 2.1: Population at risk for KAC Tsunami Risk Zone Total Minority Over 65 Disabled Poverty Lang Iso Sing Pnt Out of Zone yr Tsunami Table 2.2: Structures at risk for KAC Tsunami Risk Zone Total SF Res Mob Home MF Res Commercial Agriculture Gov/Instit Out of Zone yr Tsunami