NWQI and Beyond: NRCS s Focused Watershed Approach
|
|
|
- Edgar York
- 5 years ago
- Views:
Transcription
 Potter Water Quality Specialist NRCS Vermont Helping")


1 NWQI and Beyond: NRCS s Focused Watershed Approach Fletcher (Kip) Potter Water Quality Specialist NRCS Vermont Helping Private Landowners Protect and Improve Natural Resources on Agricultural Lands 435 square miles of surface water More than 70 islands 6 th largest freshwater lake in the U.S. 120 miles long 600 miles of shoreline 56% in VT, 37% in NY and 7% in the Province of Canada 1

2 But, there s a problem Lake phosphorus levels have continued to increase despite 30 years of agricultural conservation efforts 2

3 Lake Champlain Phosphorus TMDL 2016 Reductions by Lake Segment 3
 and technical assistance to priority areas The purpose of which is to accelerate conservation practice implementation by farmers in the watershed The state water quality")
4 The NWQI Program Summary Program started in 2012, one watershed in Vermont the Rock River Watershed NWQI is a partnership between NRCS, state water quality agencies and the EPA Program targets NRCS conservation funding (EQIP) and technical assistance to priority areas The purpose of which is to accelerate conservation practice implementation by farmers in the watershed The state water quality agencies support the projects through increased monitoring and targeted funding Monitoring in the Rock River Watershed Monitoring at Four Levels and Two Types In-lake HUC-12 Subwatershed Edge of Field Biomonitoring 4


5 Key Accomplishments in The Rock River NWQI, NRCS has worked with 17 farmers $768,000 in NWQI funding 1,363 acres of cover crops 6,335 feet of fence Several waste management systems 75 acres of reduced tillage 130 acres of conservation crop rotation Local Watershed Action Team formed in each watershed Watershed plans developed that include: a watershed level resource assessment phosphorus reduction and practice implementation goals an action plan Each watershed project includes an agreement with a local partner for coordination, E&O and farmer assistance 5


6 NRCS with State partners developed priority ranking of Lake Champlain HUC-12 watersheds based on 12 factors. Four watersheds were selected to receive increased FA and TA over the next five years starting in Nearly ½ of VT EQIP funds ($4.6 million in FY 2016) was focused in these priority areas. The goal is to accelerate conservation measures in targeted critical areas to achieve measurable water quality improvement. Targeting most critical watersheds in the Basin and the most critical areas on the farms. Crop and Hayland Map Total watershed = 33,515 ac. 6,449 acres annual crops 5,844 acres hay 1,923 acres pasture 6

7 7


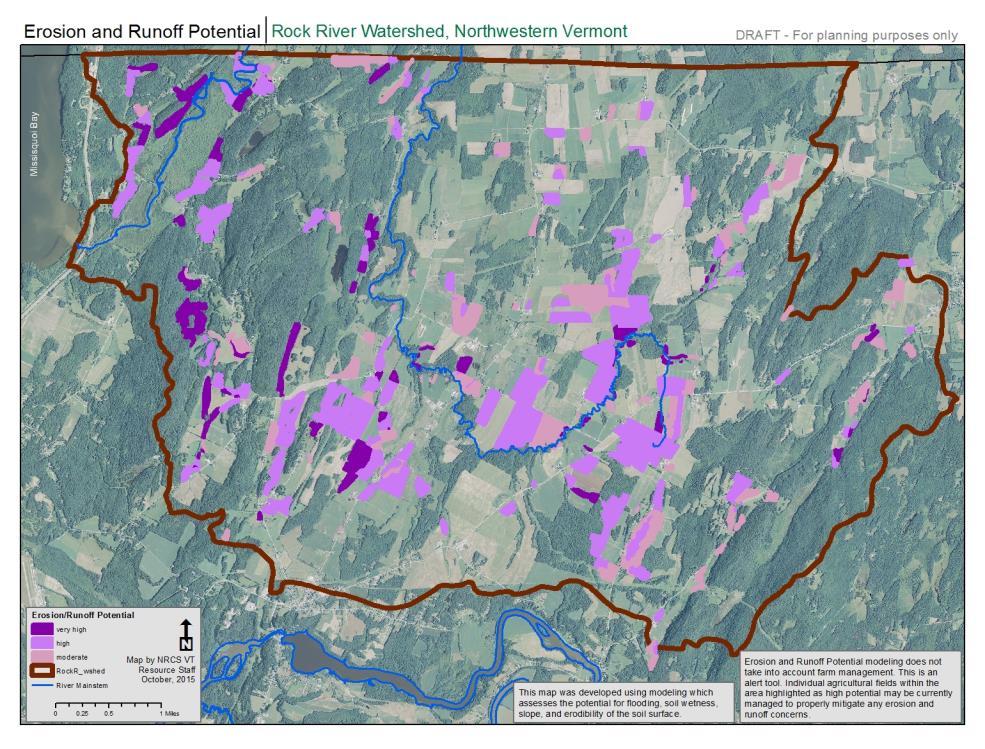
8 Ditch Network 180 miles of ditches, both field and roadside 152 miles of streams Also shows piped (buried) waterways Farm Detail Maps Erosion and Runoff Risk Potential 8
9 2016 Focus Watersheds - Estimated Ag Phosphorus Loadings and TMDL Reductions Watershed Name Watershed Area (acres) Total Estimated Ag P Loading (lbs /yr) TMDL Reduction Goal Ag P Reduction Goal (lbs /yr) Rock River 22,743 19,248 83% 15,976 Pike River 25,088 9,599 83% 7,967 St. Albans Bay 33,515 23,047 35% 8,066 McKenzie Brook 21,222 43,276 60% 29,966 EPA BMP Scenario Tool Spread sheet type model created by a private consultant working for EPA Based on SWAT modelling of LCB Used to estimate the P loading reduction associated with different sets of BMP s Ag, forest, urban, streambank, etc. St. Albans Bay Baseline Example (2010) Table 2. Average Annual Flow and Pollutant Load by Source Source Flow (MG/yr) TP (kg/yr) TSS (mt/yr) Cropland 2, , , Pastureland , Farmstead Rangeland Forest 2, Wetland Back road Developed 2, , Point Source Streambank - 1, ,
10 Example Practices the St. Albans Bay Scenario Practice Amount Percent of Total Acres P Reduction Reduced Tillage-Cover Crops- Manure Injection on cont. corn 633 ac. 50% 343 lbs/yr Cover Crop on Corn/Hay 2,531 ac 60% 464 lbs/yr Crop Rotation on cont. corn 633 ac. 50% 180 lbs/yr Riparian Buffers on cont. corn 11 ac. 25% 148 lbs/yr Ditch Buffer on cont. corn 31,000 ft 50% 365 lbs/yr Waste Management 19 no. 50% 273 lbs/yr 2016 Priority Watershed Estimated Ag Phosphorus Loadings and Targeted Reductions Watershed Name Watershed Area (acres) Total Estimated Ag P Loading (lbs /yr) TMDL Reduction Goal Ag P Reduction Goal (lbs /yr) Project Goal (lbs/yr) (% of TMDL goal) Rock River 22,743 19,248 83% 15,976 7,000 (40%) Pike River 25,088 9,599 83% 7,967 5,200 (65%) NRCS Estimated Cost of Project Implementation $8,518,000 $9,938,000 St. Albans Bay McKenzie Brook 33,515 23,047 35% 8,066 7,000 (87%) 21,222 43,276* 60% 29,966 15,000 (50%) $7,764,000 $10,753,

11 St. Albans Bay TMDL Scenario Results Total Estimated Ag P Load = 23,047 lbs/yr Estimated Reduction Needed (35%) = 8,066 lbs/yr Estimated Scenario Reduction = 7,000 lbs/yr Estimated NRCS Practice Cost = $7,700,000 Watershed Planning Groups The Four Watershed groups Met 3 to 5 times Included federal, state and local partners, and local farmers Established five year P reduction goals for each watershed Developed local action plans for each watershed 11
12 St Albans Bay Watershed Action Plan Purpose of the plan is to bring watershed goals into actions Four Key Strategies Logic Models Outcomes to Actions Watershed Tactical Action Plan What, who, when 5 Year Practice Implementation Plan based on Practice Scenarios Strategy 4: Outreach and Education St. Albans Bay Tactical Action Plan Actions: Description Who is responsible? When Begin When End Develop and Implement SAB Outreach and Education plan NRCS and UVM Extension are to develop and track a St. Albans Bay watershed outreach and education plan to include target audiences, key messages, expected outcomes, and timeline with goal of ensuring that 95% of farmers in watershed are contacted regarding the EQIP program. NRCS & UVM 01/12/16 03/31/16 One-on-One Contact with farmers. Initiate individual contact with 25% or farmers in UVM 01/12/16 12/31/16 the watershed to explain the water quality issues in the SAB watershed and the goals of the watershed planning group as it relates to the EPA TMDL. One-on-One Contact with farmers. Same as above UVM 01/01/17 12/31/17 Collaborate with the Farmers Watershed Alliance Collaborate with the Farmers Watershed Alliance to provide peer-to-peer farmer education and networking opportunities. UVM, NRCS & FNLC 01/12/16 04/30/16 12

13 Focused Watershed Implementation Plans Summary With partners identified critical HUC-12 watersheds Developed watersheds plans that include: Resource assessments, including CSA s at field level P reduction and practice implementation goals Action plans P reduction goals will achieve a significant portion of the TMDL required reduction Each watershed has existing HUC-12 level monitoring or monitoring will be established by State Progress meeting P reduction goals will be evaluated annually using EPA and State developed tools Questions? 13