A 100 % Renewable Energy System In Belgium by 2050
|
|
|
- Eleanor Bates
- 5 years ago
- Views:
Transcription


1 A 100 % Renewable Energy System In Belgium by 2050 Assessment of Different Long Term Trajectories to Transform the Current Belgian Energy System into a 100% Renewable Energy Mix Eupen 17 January 2017 Authors : Wouter Nijs, Jan Duerinck, Danielle Devogelaer, Dominique Gusbin, Yves Marenne, Marco Orsini
2 Content» Background information» Definition of the scenarios» The challenge of intermittent renewable energy» Modelling approach: how we used the TIMES model» Exogenous assumptions» General results» Special results 23/01/2017 2
3 Purpose of the project (and limits)» Study ordered end 2011 by 4 energy ministers» The study defines different trajectories that can lead to an energy system exclusively based on renewable energy sources» How to achieve a 100% renewable target in 2050 (electricity, heating and cooling, transport except aviation and sea transport)?» What technologies are needed?» What are the costs of these solutions?» The study has to be perceived as a feasibility study» To be completed by other analyses» 23/01/
4 100 % What : energy is more than electricity! (as we all know - but sometimes forget) Heat Electricity Biofuels and waste Natural gas Oil products Coal and Peat 50 0 Industry Transport Residential Commercial and Public Services Agriculture / Forestry» Energy balance Belgium; Final energy consumption (PJ, IEA, 2009) 23/01/2017 4
 GDP: 350 billion Final")

5 Background information Surface: km 2 Population: 11 million (330p/km2) GDP: 350 billion Final energy consumption: 1800 PJ Per capita final energy consumption: 150 % EU27 average or 75 % US Hydro limited to 120 MW Domestic fossil energy supply = 0 (1992) 23/01/2017 5


6 Basic principles of TIMES model Partial equilibrium (energy) model Bottom-up optimisation model of the national energy system Detailed representation of energy-material flows and technologies (broad sense) Various alternative technological choices Up to 2050 Driving factor: fulfilment of energy service demand ( energy demand) 23/01/2017 6

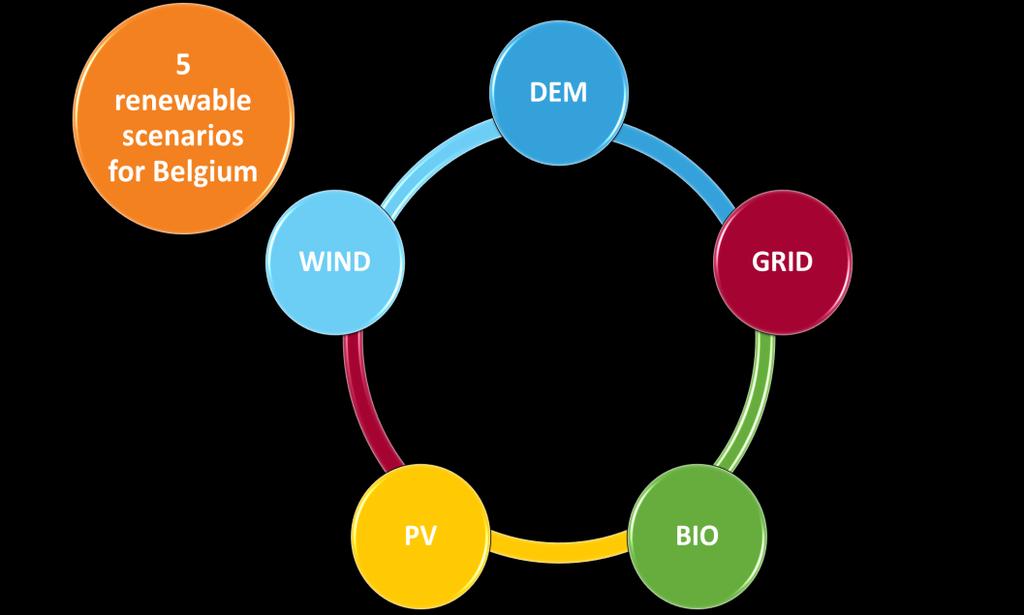


7 Definitions of scenarios REF Fossil Benchmark scenario 23/01/2017 7
8 Challenges of intermittent renewable energy Daily fluctuations Capacity factor Solar Wind Half hourly observations from 1 to 5 March 23/01/2017 8
9 Capacity factor Challenges of intermittent renewable energy Longer perspective» days moving average /01/ Lowest combined availability
10 Modelling approach: How we used the TIMES model Security of supply Extending the temporal resolution to 78 periods in one year = 26 periods of two weeks x 3 periods a day Reserve capacity requirement (sum of nominal power of biomass plants, geothermal and storage facilities) Constraint to assure that BE can be self sustained for 14 consecutive days without counting on wind and solar Day-night and seasonal electricity and hydrogen storage options Transmission and distribution network capacities determined by model Price sensitivity for end uses Option for large scale industrial demand management (steel sector) Curtailment 23/01/
11 Assumptions» Belgian GDP: increases at an AAGR of 1.8% in » Fuel prices: from the Energy roadmap 2050, Reference scenario, crude oil to some 127 $ 08/bbl in 2050» Biomass: price of imported biomass increases to some 157 $ 08/bbl in 2050» Carbon price: 15 /tco 2 in 2020, 51 /tco 2 by 2050» CCS technologies: not allowed» Nuclear: 2012 legislation on the phasing out of the nuclear power plants» Electricity imports: limited to 5.8 TWh (average Belgian net imports )» Targets: 35% of primary energy in 2030, 65% in 2040, 100% in /01/


12 Assumptions on renewable costs 23/01/

13 Assumptions on electricity storage costs 23/01/

14 Primary energy supply in /01/
15 Final energy consumption 23/01/
 23/01/2017")
16 Electricity production (LHS) and capacities (RHS) 23/01/
17 GWh GWh Storage technologies Electricity -Low -eff Smart grids Existing Coo Ref Grid Sol Wind Hydrogen -Seasonal Hydrogen-Day Night Ref Grid Sol Wind 23/01/
")
18 Cumulative investment requirements ( ) 23/01/
19 Results Costs: Cumulative additional investment expenditures in the electricity sector (M 2005) Cumulative for DEM GRID BIO PV WIND Conventional Geothermal Grid expansion Others Solar Storage Wind Source: TIMES. 23/01/
")
20 Cost of renewable energy scenarios (in % GDP 2050) 23/01/
21 Results Costs: Additional cost incl. avoided GHG damage cost (M 2005), 2050 Total annual add. cost wrt REF, when (global) benefit of avoided GHG in 2050 is included No longer a cost but a benefit DEM GRID BIO PV WIND Low case CO2 damage (130 /ton) High case CO2 damage (300 /ton) 23/01/
22 Space requirement (2050) (km 2 ) Results PV: 205 W45000 peak /m² Wind offshore: 8.5 W peak /m² (squared parks) Wind onshore: 8.5 W peak /m² (squared parks) Biomass: 0.5 W/m² (could be much higher if imported biofuels, produced with PV electricity) Biomass (domestic and imported) WIND offshore (BE) WIND onshore SOLAR Belgian la nd surface Belgian Continental Plate REF DEM GRID BIO PV WIND 23/01/
23 Special results: Renewables penetration in electricity sector 23/01/
24 Electricity prices 23/01/

25 Special results: Steel production» Flexible steel production saves 600 m in 2050 or 17% of total revenues of the sector» Flexible steel production is competitive in wind scenario 23/01/
26 Employment Employment: Some estimations The RES trajectories all create more job-years or FTE s than REF REF already integrates a lot of renewables PV creates the most FTE s in any given year BIO and DEM are the second highest job generating scenarios Annual job-years generated over REF due to the RES trajectories, Total FTE s DEM GRID BIO PV WIND Source: Wei et al. (2010), Federal Planning Bureau. 23/01/
27 Conclusions Conclusions (1/2) Technically, a 100% renewable energy system is feasible without having to change the economic paradigm. However, such a radical society transformation implies that: o A highly ambitious renewable target goes hand in hand with a trend towards electrification: a doubling/tripling of power production is noted, curtailment is necessary o Energy imports strongly diminish but remain important: imports tumble from 83% (REF) to [42%-15%] depending on the scenario o Society shifts from a fuel intensive to a capital intensive society o It seems cost efficient to maintain overcapacities, both in industry and power generation new paradigm in energy perception 23/01/
28 Conclusions Conclusions (2/2) o This comes at a significant cost: in 2050, energy system costs increase by 20% wrt REF, BUT o When including disutility costs, the total add. cost is even higher (30%) o With disutility + GHG damage net positive effect of some scenarios +/- 10 B /year (highly dependent on GHG damage cost assumptions) o 300 to 400 billion of additional investments are needed o Sensitivity to fuel prices and PV costs o PV costs from /kW p => variation of 0.5% of GDP2050 o Variant of REF scenario with higher oil prices (250 $08/boe in 2050) additional costs decrease o Creation of additional employment o to additional full-time jobs in 2030 o Cost efficiency of adapting to energy flow variability o Further research is certainly needed 23/01/
29 Thank you for your attention Full report via Google: 100% renewable energy by 2050» Authors :» Wouter Nijs, Jan Duerinck, Danielle Devogelaer, Dominique Gusbin, Yves Marenne, Marco Orsini, Marie Pairon, 23/01/