Mahmoud Abu El Saud General Manager Operations & Maintenance Division
|
|
|
- Imogen Chandler
- 5 years ago
- Views:
Transcription
1 Designing, Constructing, Operating and Maintaining an effective waste water and world class water reuse system networks in Oman Mahmoud Abu El Saud General Manager Operations & Maintenance Division Presentation to: Oman Energy and Water Conference and Exhibition 2016 May 2016
2 TABLE OF CONTENTS Objective Haya Water Overview o Service Coverage o Sewerage Collection & Conveyance o STP o Treated Effluent Reuse STPs Processes Technologies
3 Objective To provide a brief overview of Haya Water existing wastewater infrastructure To discuss wastewater reuse and how to maximize the usage To provide a brief overview on the Sewage Treatment Plant s technologies used in Haya Water


4 HAYA WATER OVERVIEW
5 Haya Water Haya Water is responsible for the Operation and Maintenance of Sewerage Treatment Plants, Pumping Stations, Sewerage and Treated Effluent Networks and Composting Plant throughout Muscat, including: 11 Sewage Treatment Plants, 48 Sewerage Pump Stations, 1,471 Km of Sewerage Network, 2 TE Pumping Stations, 296 Km of TE Network, 1 Composting Plant Haya Water is currently treating approximately 140,706 m3/day of wastewater and reusing the treated effluent for irrigation purposes.


6 Haya Water Services TREATMENT COLLECTION & CONVEYANCE REUSE EFFLUENT COMPOST ODOUR & GASES CONTROL AND TREATMENT

7 Haya Water Service Coverage
8 SEWAGE COLLECTION & CONVEYANCE
9 Sewerage Network Technology 1. Gravity Networks Pipeline -UPVC, GRP, HDPE, Manholes- concrete cast in situ, Precast concrete, HDPE and polycrete Sewerage pumping stations Submersible pumps and dry installation submersible pumps Rising mains GRP Pipes, and HDPE 2. Vacuum System Pipeline HDPE Vacuum interface valves 3. TE Networks Pressurize pipeline HDPE, DI and GRP Valve chambers and measuring equipment, Storage and balancing tanks TE pumping stations double suction split case centrifugal pumps


10 Schematic of Sewerage Networks HAYA responsibility Sewer network
11 Sewerage Collection Network Area Length (km) GM, Amerat & Qurayat Bousher Seeb Total 1,471.4

12 Seeb Area
13 SEWERAGE NETWORK Coastal Strip - Vacuum System VS4 VS2 STP VS10 VS9 VS6 VS5A VS5 VS3 MPS1 MPS2 VS8 VS7 MPS 3 VS1 Pressurize Sewer Main Gravity Sewerage Network Vacuum Network Main Collector Sewer Mabella Al Khoud

14 Bousher Area PSQ13 PSQ3 SPS1 SPS2 CPS SQ STP PS2MQ PSQ4 PSQ7 PSQ12 PSQ8 PSQ2 LSQ1 PSQ9 PSQ14 PSQ10 PS3MQ PS17 LSQ6 PSIL11 PS19 PS18 PS3MQ Airport Heights PS15 PS16 Al Ansab STP Pressurize Sewer Main Gravity Sewerage Network STP

15 HAYA WATER SEWAGE TREATMENT PLANTS
16 HAYA WATER SEWAGE TREATMENT PLANTS
17 Sewerage Treatment Plants No STP PROCESS Design Capacity m 3 /Day Avg. Inflow m 3 /Day (Apr 2016) Inflow Collection 1 DARSAIT Activated Sludge 21,000 18,438 Network / PS 2 JIBROO Activated Sludge Network /PS 3 Old ANSAB Activated Sludge 20,000 17,022 Tankers 4 New ANSAB MBR 57,300 59,300 Network/PS s & Tankers 5 SAQ MBR 7,500 4,831 Network / PS 6 BOUSHER Activated Sludge Network / PS 7 MANUMA Activated Sludge Network / PS 8 AMERAT Activated Sludge / MBBR 650 / Network 9 QURIYAT MBBR and MBR 1,000 / Tankers 10 HAG MBR Network 11 SEEB SBR 60,000 39,161 Network / PS TOTAL 168, ,705
18 Treatment Effluent Quality April 2016 Parameter Unit Compliance Standard Class A Seeb STP SBR/UF Al Ansab STP MBR Darsayt STP* CAS ph BOD 20ºC) mg/l < Suspended Solids mg/l < Ammonia Nitrogen mg/l < Nitrate mg/l < Oil and grease mg/l < Phosphorous (total as P) mg/l < Faecal Coliforms /100ml < Residual Chlorine mg/l <= * Darsayt STP must comply with class B MECA Standards.


19 NEW ANSAB STP Capacity : 57,300 m3/d Technology: Membrane Bioreactor, MBR (Immersed Flat Sheet, KUBOTA)


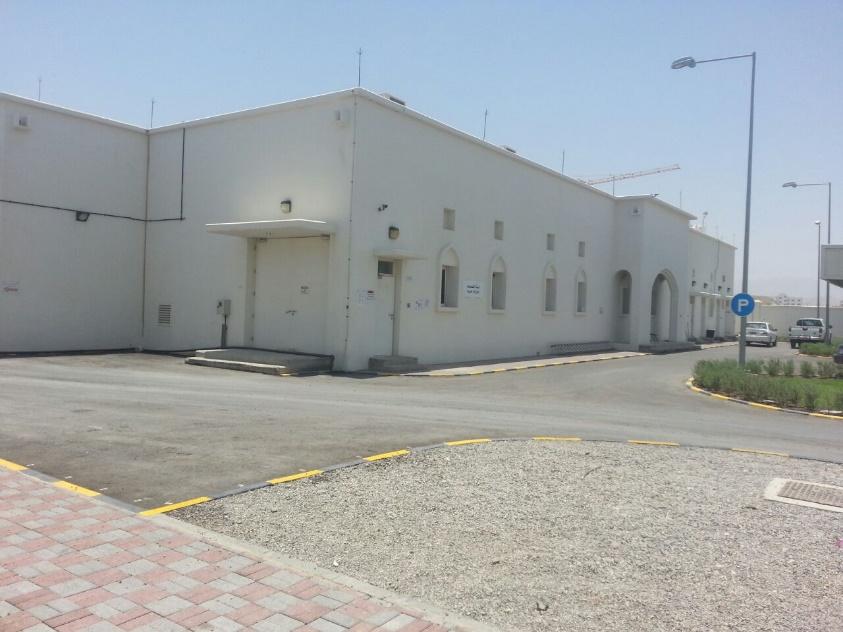
20 Old Al Ansab STP Capacity : 20,000 m3/day Technology : Conventional Activated Sludge
21 SEEB STP Huber Screen SBR Basin UF Cells OSHG Centrifuge Capacity : 60,000 m3/day Technology : SBR with Ultrafiltration OCU

22 Darsait STP Capacity : 21,000 m3/day Technology : Conventional Activated Sludge with Sand Filter (Tertiary Treatment)


23 SAQ MBR Capacity : 7,500 m3/d Technology: Membrane Bioreactor, MBR (Immersed Hollow Fiber, Zenon)
24 STP PROCESS TECHNOLOGIES
25 HAYA TECHNOLOGY It is our endeavor to ensure the use of best practices, systems and technologies to establish a world class Water Reuse System yielding to making Oman Greener and Healthier; hence a better and more enjoyable place to live and work. Membrane Bioreactor (MBR) technology is among the most advanced and sophisticated systems available in the world that is used for municipal and industrial wastewater treatment and was selected by Haya Water to produce high quality treated effluent for irrigation and coastal discharge. SBR Sequential Batch Reactor flowed by Ultra Filtration is one of the approved technology for Sewage Treatment Plants in Haya Water to produce high quality TSE 25 of 12
26 CONVENTIONAL ACTIVATED SLUDGE
27 Overview of STP Technologies Standard Biological sewerage treatment plants usually consist of: I. Reception chamber II. Preliminary treatment III. Aeration IV. Secondary settlement process V. Tertiary treatment
28 Conventional Extended Aeration Activated Sludge Process Conventional Extended Aeration Activated Sludge process is typical to Darsait, Al Ansab Tanker Facility, Bousher, Jibroo, Al Amerat and Manuma Sewage treatment Plants. The illustration below shows a simplified flow diagram for biological processes used for wastewater treatment. The influent wastewater (e.g. municipal wastewater) goes through several stages. Primary Treatment Secondary Treatment Tertiary Treatment Influent Raw Sewage Bar Screen Grit& Grease Primary Clarifier Aeration Tanks Secondary Clarifier Tertiary Filtration Disinfection Return Activated Sludge Waste Activated Sludge Treated Effluent
29 Conventional Extended Aeration Activated Sludge Process DARSAIT STP
30 Sequential Batch Reactor System (SBR)


31 SBR Cycle Illustration 1. Mix Fill 4. Settle 2. React Fill 5. Decant 3. React
32 ICEAS Basin Layout (Intermittent Cycle Extended Aeration System) Screened & De-Gritted Sewage In Baffle Wall Decanter Pre-React Chamber Main React Chamber Effluent
33 ICEAS OPERATING CYCLE Continuous Flow of Screened and Degritted Influent 1. React 2. Settle 3. Decant Treated Effluent Waste Sludge

34 SBR BASIN


35 FINE BUBBLE MEMBRANE DIFFUSERS Aeration System
36 Membrane Bioreactor System (MBR)
37 Membrane Bioreactor System (MBR) This type of wastewater treatment technology is currently used in New Al Ansab, Sarooj and New Quriyat Sewage Treatment Facility. Future projects such as New Darsait and Al Amerat Sewage Treatment Plant would also utilize this type of process technology. Head Works Area Biological Treatment Area MBR Area Treated Effluent Pre-aeration Screening Area Grit and oil Separator Anoxic Zone Aeration Zone Return Activated Sludge MBR Zone Waste Activated Sludge


38 Membrane Bioreactor System (MBR) Hollow Fiber Membrane used in SAQ STP Zenon Hollow Fiber Module Flat sheet MBR
39 Comparison of Different Technologies CAS SBR MBR The CAS process uses microorganisms to feed on organic contaminants in wastewater to remove Biochemical Oxygen Demand (BOD) and suspended solids, producing a high-quality effluent. The basic principle is that as microorganisms grow, they form particles (floc) that are allowed to settle at the bottom of the tank leaving a relatively clear (supernatant) liquid. The conventional Sequencing Batch Reactor (SBR) activated sludge process operates on the fill and draw principle. The unit processes of fill, react, settle, decant and idle occur sequentially on a cyclic basis. In the conventional SBR configuration, flow is diverted from the basin during settling and decanting. This requires conventional SBRs to have two or more basins or an influent equalization tank to receive flow when basins are settling and decanting. The MBR is the combination of Activated Sludge Treatment together with a separation of biological sludge by membranes which provide complete disinfection of the Treated Effluent (TE). The latter step replaces the Final Clarifier used in the Conventional Activated Sludge (CAS) which separates solids by gravity only.
40 BIOLOGICAL TREATMENT CAS PRELIMINARY TREATMENT Anoxic Reactor Aerobic Reactor SBR MBR Aerobic Reactor Clarifier Membrane Tank TERTIARY TREATMENT & DISINFECTION DISINFECTION
41 BIOLOGICAL TREATMENT Raw Sewage Screening Grit Removal Aerobic Reactor Clarifier Activated Sludge Process Raw Sewage Preaeration Screenin g Aerated Grit Removal Anoxic Reactor Aerobic Reactor Membrane Tank MBR
42 NEW AL ANSAB STP OVERVIEW
43 AL ANSAB STP In 2010, the new Ansab STP was commissioned with a design capacity of 57,300 m 3 /d. Al Ansab STP receives 50% of the flow through tankers The second phase of the STP is planned to be operational by the end of year 2018 for an ultimate capacity of 125,000 m3/day.

44 Al Ansab STP MBR Technology: Immersed Flat Sheet Membrane Bioreactor, MBR Membrane: Flat Sheet, KUBOTA


45 New Al Ansab Plant

46 AL ANSAB STP TE Storage Overflow pond Bio-filter Head Works Biological Treatment Tanker Discharge Old Al Ansab


47 PRELIMINARY TREATMENT Blower Room Aerated Grit/Grease Removal Tanks Fine Screens Electrical Sludge Holding Tanks Pre-aeration Tanks Chemicals Screenings/Grit Handling Dewatering To Biological System Influent Flow


48 Raw Sewage De-ox Zone Anoxic Reactor Aerobic Reactor Membrane Tank Permeate DO 0.5 mg/l DO <0.5 mg/l DO >1.0 mg/l DO >2.0 mg/l Recirculation Flow 3 5 Q

49 Biological Treatment Aerobic Reactors Oxidation: BOD + O 2 CO 2 + H 2 O Nitrification: NH 4 + +O 2 NO NO 3 - +H 2 O Anoxic Reactors Denitrification: NO O = N 2 +H 2 O Anaerobic Reactors Aerobes Aerobes Autotrophs Phosphorus Adsorption: PO 4 O 2 + TSS Poly-P Organisms
50 SEEB STP OVERVIEW
51 SEEB STP The STP has a design capacity of 60,000 m 3 /d. Once completed phase II, Seeb STP capacity will reached a design capacity of 81,000 m 3 /d. The major processes in the STP comprise of screening, grit and grease removal, Sequential Batch Reactor (SBR) system, Ultrafiltration, disinfection, TE storage, Aerobic Digestion and Centrifuge dewatering of surplus sludge. Seeb STP commenced operations in June 2014 and it is currently as of April 2016 treating approximately 40,000 m3/day.
")
52 SEEB STP OCU Centrifuge SBR 4 SBR 3 SBR 2 SBR 1 TE Tank B A D C B A 4 DIGESTERS (1 future) FUTURE UF x 6 cells 10,000 m3 CHAMBER FOG TE Tank-2 FUTURE D C B A D C 4 DIGESTERS (1 future) MPS 1


53 SEEB STP - SBR Pumping Station Pre-Treatment Secondary Treatment Tertiary Treatment Treated Effluent RAW SEWAGE MPS-1 Screen, Grit & FOG S B R UF System TE Tank TE Emergency Sea Outfall Sludge Treatment Aerobic Digestion Aerated Buffer Tank Centrifuge FUTURE Sea Outfall
54 SEEB STP Huber Screen SBR Basin UF Cells OSHG Centrifuge OCU
55 TREATED EFFLUENT REUSE

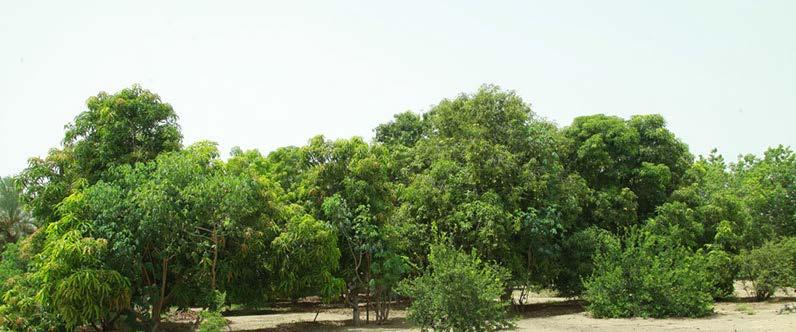
56 A Greener Muscat Haya Water supplies treated effluent for a wide range of irrigation purposes across the Muscat area, including parks, public green areas, golf courses to keep them green and pleasant for the public. Treated water reuse also reduces dependence on groundwater or desalinated water sources ensuring the maximum use of renewable water resources.
57 Treated Effluent Networks Area GM, Amerat & Qurayat Bousher Seeb Total Length (km) 37.2 km km km km
58 Haya Water STPs Sewage Inflow, TE Consumption and Overflows Jan Apr ,000 50,000 40,000 Haya Water STPs Average YTD Flows (m3/d) Sewage Inflow TE Consumption Overflow 133, , , ,000 20,000 10,000 0 Darsait Jibroo Amerat Quriyat HAG New Ansab Old Ansab Sarooj Bousher Manuma Seeb M3/D Sewage Inflow TE Consumption Overflow (Sea outfall/wadi)
59 TE Produced vs TE Consumption Seeb Area M3/d 45,000 40,000 35,000 30,000 25,000 20,000 15,000 10,000 5,000 0 Jun Jul Aug Sep Oct Influent Nov Dec TE Network From June 2015 to Apr 2016, 185,577 m3 of TE have been disposed to the sea only at Seeb Area. Jan Feb Mar Apr


60 Treated Effluent Facilities TE Storage tank Al Ansab STP TE Pumping Stations Al Ansab STP Al Ansab TE Tank


61 Treated Effluent Facilities Al Khoud TE PS


62 Treated Effluent Facilities Al Khoud TE Balancing Tank


63 Treated Effluent Facilities Al Khoud TE Filling Station
64 Treated Effluent Storage Area Storage Availability Capacity (m3) GM, Amerat & Qurayat Bousher Seeb Darsayt STP TE tank Qurayat STP TE HAG STP Amerat STP TE Al Ansab STP TE tank Qurum Reservoir SAQ STP TE tank Seeb STP TE tanks Al Khoud TE PS Mabella TE PS Al Khoud TE Balancing Tank Mabella TE Balancing Tank 3, ,000 3, ,000 14,000 12,000 4,000 Future TOTAL STORAGE CAPACITY 72,000
65 COMPOSTING PLANT KALA
66 KALA First project in the Sultanate of Oman to be CDM registered in the field of Waste Management. First-of-its-kind composting project in the Middle East. Global recognition to the waste water management initiative undertaken by Haya Water Brand Enhancement. Global recognition of Haya Water s environmental role. Carbon revenue earned through sale of carbon credits will cover a part of the cost in operating the compost plant (175,000 credits over ten years). Encourage implementation of similar projects in Oman and the region. Support the country in reducing the Green House Gas emissions. 66 of 12


67 Receiving and Weighing of Raw Materials Shredding of Green Waste 67

68 Open Windrow System H2O Heat CO2 Raw Material & O2 Compost Organics + Oxygen + Microbes = CO2 + H2O + New Biomass + Energy 68


69 Windrow Turning & Aeration Windrow Turning & Aeration Oxygen concentrations of above 5% required for optimum composting conditions. Windrow Temperature Monitoring 69
70 Heavy Metals MECA & USEPA Standards MECA Maximum concentration limits (mg/kg) Kala Compost Aug (mg/kg) Kala Compost Sep (mg/kg) Kala Compost Oct.2014 (mg/kg) Cadmium (Cd) Chromium (Cr) Copper (Cu) Lead (Pb) Mercury (Hg) Molybdenum (Mo) Nickel (Ni) Selenium (Se) Zinc (Zn) Pathogens US EPA Pathogens Standard Kala Compost Aug Kala Compost Sep Kala Compost Oct.2014 Fecal Coliform <1000 MPN/g DS < 1.94 < Salmonella < 3 MPN/4g DS < 0.28 < 0.29 < 0.30 Viable Healminth Ova < 1/4g DS


71 Kala Compost Packaging Kala Compost Packed in: 1. Biodegradable Polyethylene Bags size 10 liters with handle. 2. Biodegradable Polyethylene Bags size 20 liters. 3. Biodegradable Polyethylene Bags size 50 liters. 71
72 Quantity of Materials Treated in 2015 Biosolids S.N LOCATION Jan Feb Mar Apr May Jun Jul Age Sep Oct Nov Dec TRIPS Total Weight Ton. 1 Al Ansab STP ,334 2 Darsait STP ,521 3 Quriyat STP Seeb STP ,839 Total 37,054 Bulking Agents Item Jan Feb Mar Apr May Jun Jul Age Sep Oct Nov Dec TRIPS Total Weight Ton Green Waste ,336 3,380 Horse Bedding Scrap Wood Total 3,827 Kala Compost Production Item Jan Feb Mar Apr May Jun Jul Age Sep Oct Nov Dec Total Bags 50 liters 13,670 40,030 30,128 35,134 25,079 13,918 22,965 35,066 46,929 40,136 40,194 38, ,412
73 HAYA WATER SERVES THE SOCITY AND PROTECTS THE ENVIRNMENT Reduced Carbon Footprint i. One of the by-products of the Haya Water project has been the creation of the Kala Composting Plant that is located at Al Amerat. This enables the efficient reuse of sewage biosolids, and green waste and converts them to compost that can be used for agriculture, landscaping and for individual gardens enabling a reduction in the overall production of harmful greenhouse gases. ii. As a result today 100 per cent of all sewage biosolids generated by the company s water reuse treatment project is treated and converted to compost instead of being dumped into a landfill site. As a result, Haya Water was registered by UNFCCC under Clean Development Mechanism (CDM). 73 of 12


74 Haya Water Contribution to the Environment 74

75 Thank You