Refining Nitrous Oxide Emission Factors Measurements & Modelling
|
|
|
- Albert Ryan
- 5 years ago
- Views:
Transcription


1 Refining Nitrous Oxide Emission Factors Measurements & Modelling Gary J. Lanigan 1, Karl G. Richards 1 & Bob Rees 2 1Teagasc, Johnstown Castle, Wexford, Ireland 2 Scottish Agricultural College, Edinburgh, Scotland. Nairobi 24 26Sept. 2012

2 Global N 2 O emissions Agriculture-sourced nitrous oxide contributes to > 5% of global emissions Principally driven by fertiliser N, animal deposition & indirect emissions Due to nitrification and partial denitrification of mineral N in the soil 62% natural 38% anthropogenic Total emissions Denman et al 2007, IPCC 17.7 ( ) Tg N/y
3 Current & projected N 2 O emissions Population Current N 2 O emission (Gg) Current per capita emission of N 2 O (g) Projected population growth Projected N 2 O emission 2050 (Gg) Africa Asia Europe Latin America & Caribbean N America
4 Calculating N 2 O emissions Emissions = Activity Data x Emission Factor Where: Total ij = A j x Ef ij Total ij = the emissions (tonnes) of gas i from a particular livestock type j A j = the number of animals per livestock type j ( 000/yr) Ef ij = the emission factor associated with gas (kg N 2 O-N kg N applied)
5 Calculating N 2 O emissions
6 EF 4 Concentrates Soils Livestock Meat Crop residues EF 1 F SN F ON EF 3 Pasture Excreta Frac graz Milk Fertilizer Silage Frac gasm Landspreading Housing EF 5 Manure management
7 Generating emission factors Need to cover as many variables as possible N response, soil texture, climate (temperature & moisture). Require at least one year of data Sampled frequently enough to cover temporal variation Higher tiers introduce more flexibility into inventories allows more mitigation options to be accounted
8 Excreted N Requires N excretion rates for different animal categories Collect population data from livestock population characterisation; Determine the annual average nitrogen excretion rate per head (N ex (T)) for each defined livestock species/category T Tier 1 N ex(t) = N rate (T) x TAM 1000 x 365 Total animal mass Default excretion rate Tier 2 N ex(t) = N intake (T) x (1 N retained (T) ) Based on Gross Energy and Crude Protein Based on milk production/ weight gain
9 Factors influencing N 2 O from agricultural soils N 2 O production ph temperature mineral N anaerobicity (moisture) available C Factor
10 Tier 2 ON PRP Cattle Pigs Sheep Cattle Pigs Sheep Solid Liquid Dung Urine Spatial (soils) variation Spatial (soils) variation Temporal (seasonal) variation Temporal (seasonal) variation

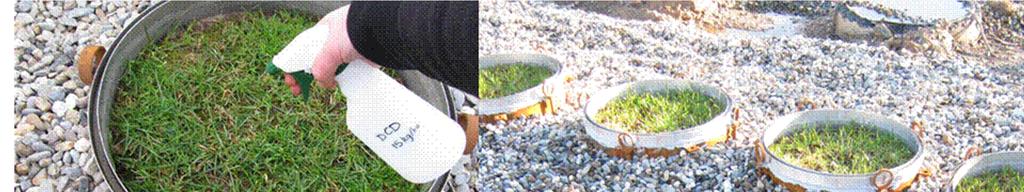
11 Measurement options Static/Automatic Chambers Eddy covariance Field/plot scale Lysimeters & 15 N tracing Modelling


12 Chamber techniques Chambers placed on collars Samples removed by syringe and stored in exetainers Analysed post hoc on a gas chromatograph with Electron Capture Detector Flux calculated as C/ t
13 Chamber Techniques Important: Soil temperature and soil moisture must be measured concurrently Need to take a minimum of three time points for linear slope response, four for non-linear response Keep gaps between measurements to a minimum MORE INTERPOLATION = GREATER UNCERTAINTY pressure vent
14 Elton Control Elton Fertiliser Elton Fertiliser & Urine 0 21/05/05 25/05/05 29/05/05 02/06/05 06/06/05 10/06/05 14/06/05 18/06/05 22/06/05 26/06/05 30/06/05 04/07/05 08/07/05 12/07/05 Sampling date 13/05/05 17/05/05 09/05/05 05/05/05 f & u y = x R 2 = /05/05 f 20/06/05 f 23/04/05 27/04/05 01/05/05 N2O em ission (µg m -2 hr -1 N2O-N) N2O (ppb) Time (mins)

15 Chamber techniques Advantages Technically the cheapest and most widespread method Samples can be stored but results not available immediately Can cover a large number of treatments Disadvantages Only point measurements as N 2 O is episodic, peaks may be missed Non- continuity of measurement means that gaps are linearly interpolated leading to greater uncertainty Unless coupled directly to a GC or other detector no real time measure of flux No spatial integration
16 Emission factors effect of soil type Emission factor (kg N 2 O-N kgn applied) Cambisol Fluvisol Cambisol Fluvisol Gleysol Arable Grassland


17 Do you need to measure across a whole year
18 Effect of N type on emission factor Cumulative fluxes (gn ha -1 ) Liquid Sludge Cattle Slurry Compost Sludge Slow Release Zero N Control Julian days from first application


19 Automated chambers Automated chambers capture temporal variation Less issues with interpolation between datapoints But more expensive and may reduce number of treatments analysed Real time measurements if coupled with photo-acoustic gas analysers or FT-IR QCL or TDL systems Samples can be collected in Tedlar bags integrated value over a longer time period

20 Slurry and Manure management 6 5 mg N 2 O-N m 2 h control shallow injection surface broadcasting Jul 30-Jul 02-Aug 05-Aug 08-Aug 11-Aug 14-Aug 17-Aug 20-Aug Manure management has a major impact on emissions Method of application can significantly reduce NH 3 emissions but increase N 2 O emissions Chadwick et at, Animal Feed Science and Technology, 166,
 to calculate a flux If 2 molecules of N 2 O")

21 Eddy Covariance Uses the co-variance between vertical windspeed and other factors (CO 2, H 2 O, N 2 O etc) to calculate a flux If 2 molecules of N 2 O move down at a given speed in one moment, and 3 move up the next moment, we know the net movement if 1 molecule. Multiply by vertical windspeed and we get a flux!
22 Eddy Covariance Data is high resolution more accurate cumulative values Spatially integrated over a large area Ideal for model constraint Expensive Area or footprint being measured over can be very large Must be flat! Cannot look at many variables Data interpretation can be difficult Jones et al Atmos. Meas. Tech. Discuss., 4,
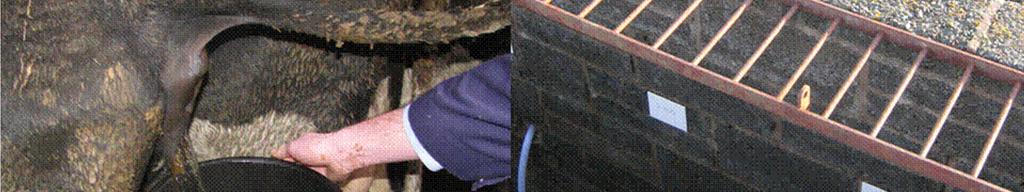
23 Pasture, paddock and range emissions Spatial and temporal variability in these systems are very high Two approaches: Deploy enough chambers to capture variability Need to know rate of excreted N to generate emission factor exclosure
24 Temporal Emissions Profile Grazed plots N 2 O (g N 2 O-N ha -1 d -1 ) GG+FN GWC+FN GWC-FN 50 Li et al Aug 03-Dec 13-Mar 21-Jun 29-Sep
25 Temporal profile background emissions N 2 O (g N 2 O-N ha -1 d -1 ) Grass Grass/clover Jul 14-Oct 22-Jan 02-May 10-Aug 18-Nov
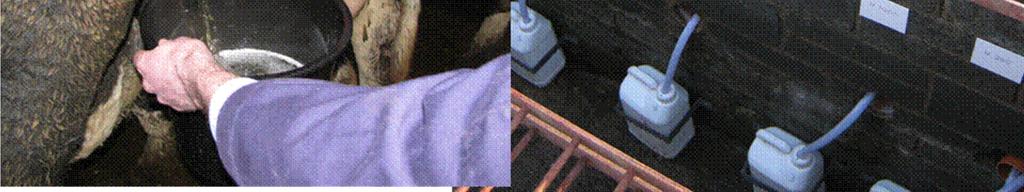
26 Pasture, Paddock & Range Apply urine and faecal N of different rates to an area Combine with a urine distribution model Dennis et al Y = X


27 Lysimeters Enable measurement of leach N which is a source of indirect emissions Allows for a full N balance Powerful tool when used in conjunction with 15 N isotope techniques

28
29 Urine N response curve N 2 O Selbie et al. 2012

30 Urine N response curve leached N Important in order to quantify indirect emissions Selbie et al. 2012
 Ammonia source of")

31 Landspreading accounting for indirect emissions (volatilisation) Ammonia source of indirect emissions To measure volatilisation rates acid trapping micromet. Techniques or dynamic chambers
32 Landspreading accounting for indirect emissions (volatilisation) GHG emissions (CO 2 -eq ha -1 ) CAN CH4 N2O direct N2O indirect DoY
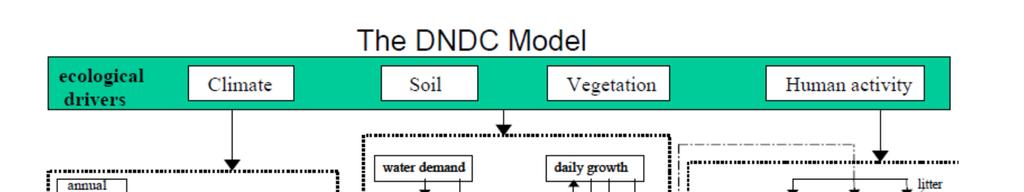
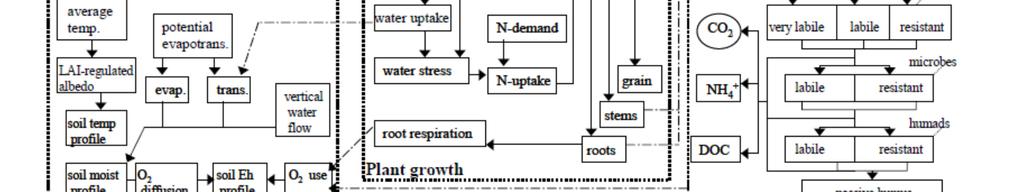
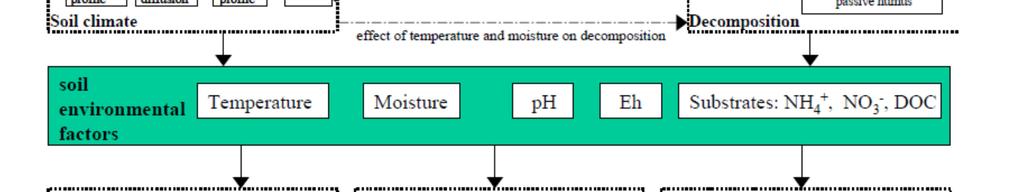
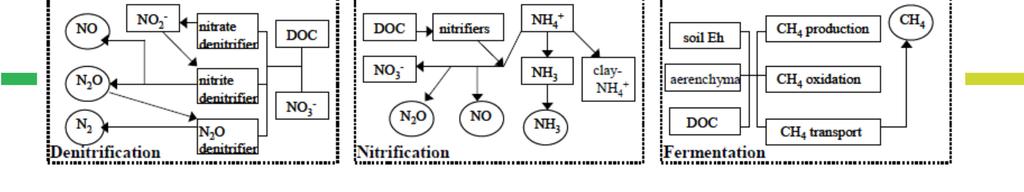
33 Models Process-based computer models of soil C and N biogeochemistry allow us to mathematically simulate the C and N cycles These models operate at a daily time step and consist of two components. The first component, consisting of the soil climate, crop growth and decomposition submodels, predicts soil temperature, moisture, ph, redox potential (Eh) and substrate concentration profiles driven by ecological drivers (e.g. climate, soil, vegetation and anthropogenic activity). The second component, consisting of the nitrification, denitrification and fermentation submodels, predicts NO, N2O, N2, CH4 and NH3 fluxes based on the modelled soil environmental factors.
34
35 Temporal Emissions Profile Grazed plots N 2 O (g N 2 O-N ha -1 d -1 ) GG+FN GWC+FN GWC-FN Aug 03-Dec 13-Mar 21-Jun 29-Sep
36 Temporal Emissions Profile Grazed plots GG+FN 300 N 2 O (g N 2 O-N ha -1 d -1 ) GWC+FN GWC-FN Measured Modelled Aug 03-Dec 13-Mar 21-Jun 29-Sep
 16 14 12 10 8 6 4 2 0 Measured Simulated Milk production GG+FN GWC+FN GWC-FN G-B WC-B 16 14 12 10 8 6 4 2 0 Milk Production (t ha")
37 Modelling assessment of options and regional variation Good comparison between measurements and models in terms of cumulative emissions temporal profiles are more problematic Can be used to assess regional variation in emissions N 2 O Emissions (kg N ha -1 yr -1 ) Measured Simulated Milk production GG+FN GWC+FN GWC-FN G-B WC-B Milk Production (t ha -1 yr -1 )
38 Model Inputs Climate Mean daily temp Min daily temp Max daily temp Precipitation Windspeed Wet deposited N Atm ammonium conc atm CO2 Conc rate of CO2 increase Fertilisation Date of application Application method (depth) Application rate N inhibitor applied Date of application Manure type Application rate C/N ratio Soils Land-Use Texture Bulk density Ph Clay content WFPS Wilting Point Water layer retention depth SOC Depth of uniform SOC Rate of SOC decrease with depth Very Labile litter pool Labile litter pool Resistant litter pool Active humus Recalcitrant humus Initial soil nitrate (0-5 cm) Initial soil ammonium (0-5 cm) Microbial activity Slope Grazing No. of grazing periods Start and end Grazed hours per day Intensity No. silage cuttings Silage yields
39 Outputs Ecosystem N balance N demand and uptake N leached N runoff N volatilised N2O NO N2 N uptake by vegetation N stored soil ammonium and nitrate daily N assimilation and soil mineralization Ecosystem C balance soil CO2 respiration DOC Methane C stored actual yield growth rate (daily only) Water balance Transpiration soil evaporation Leaching Runoff water storage (end of run) Potential Water demand and uptake by vegetation Daily available water Daily water table depth DAILY WFPS (per each soil depth) Grazing Grazed C and N Dung C and N urine N Volatilisation from grazing
40 Summary Regardless of technique important to dissaggreate between a) different N type and b) different soil type Development of higher tier emission factors is urgent in order for flexibility in inventories - so mitigation options can be included High quality activity data (N excretion rates) is imperative Modelling (Tier 3) allows for option testing and climate-proofing of strategies


41 Acknowledgments AGhgRI-I Agricultural GreenHouse Gas Research Initiative for Ireland