Wind Energy 101: The Power in Wind
|
|
|
- Elinor Payne
- 5 years ago
- Views:
Transcription

1 Wind Energy 101: The Power in Wind

2 Wind Basics Wind is actually solar energy! Wind is the flow of gases on a large scale resulting from the heating and cooling of Earth and its atmosphere as well as the planet s rotation. Types of Wind Global-Scale Winds Synoptic-Scale (Regional) Winds Mesoscale (Local) Winds


3 Global Winds Areas of rising and sinking vertical air motions that set up the semi-permanent pressure zones. the subtropical high pressure cells inter-tropical convergence zone sub-polar lows Major bands of horizontal winds that direct the movement of air masses. including the polar easterlies mid-altitude prevailing westerlies easterly trades of the tropics

4 Regional Air Masses The mix of land and water on Earth's surface leads to the regional production of air masses with differing characteristics. Air masses are large, relatively uniform blocks of air that have taken on the characteristics of the underlying surface.

5 Regional Fronts & Jet Streams

6 Local - Lake and Sea Breezes


7 Local - Mountain and Valley Breezes Bernoulli Principle Decrease in fluid pressure means increase in fluid speed.
8 The Power in Wind Power is a reference to the potential instantaneous output of a device measured in in Kilowatts (kw). Energy is a reference to the output of a device over time measured in in Kilowatt Hours (kwh). The power in wind can be described using the following equation: ρ = Air Density A = Area v = Wind Velocity/Speed P = 1/2ρAv 3

9 The Power in Wind Air Density Density of Air at Standard Atmospheric Pressure Changes with air temperature. Temperature (ᵒC) Temperature (ᵒF) Density of Dry Air (kg/m 3 ) Changes with pressure. Density will decrease with increased humidity

10 The Power in Wind Area Area is proportional to the power available in wind. Increasing the area by a factor of 2 will increase the available power by a factor of 2!
11 The Power in Wind Wind Speed: As wind speed increases, power increases by a factor of 3. P = 1/2ρAv 3 Example: Consider two sites. One site with a wind speed of 10 mph and another site with a wind speed of 12 mph. P 2 /P 1 =(V 2 /V 1 ) 3 P 2 = (V 2 /V 1 ) 3 P 1 P 2 = (12/10) 3 P 1 P 2 = 1.73P 1 There is only a 20% increase in wind speed, but a 73% increase in available power between the sites.
12 The Power in Wind Height: Wind speed, and therefore the power in wind, is affected by height.
 Rule of thumb: install turbine 20-30 ft higher than anything within 500")
13 The Power in Wind Turbulence Obstacles create turbulent wind Decreased performance breaks lift Increased wear and tear (maintenance costs) Rule of thumb: install turbine ft higher than anything within 500 ft
14 Wind Energy 101: Wind Turbines
15 Wind Turbine Terminology The Industry: defines by generating capacity Small wind < 100 kw, Large wind > 100 kw The Public: defines by physical size How big/tall is it? How many turbines? Net-metered Grid-connected, grid-tie Nameplate capacity: rated maximum output Capacity factor: Ratio of energy generated by system over potential the system could have generated if it ran at 100% nameplate capacity over the same period. Efficiency: Ratio of energy generated by a system over the potential the system could have generated if it captured 100% of the available resource.
16 How does it work? Wind Turbines: A wind turbine captures the kinetic energy in wind converting it to mechanical energy via the spinning rotor and then to usable electrical energy by way of the alternator. Kinetic Energy Mechanical Energy Electrical Energy Component Rotor Gearbox Generator Converter Efficiency 45-52% 95-97% 97-98% 96-99% Betz Limit: The theoretical maximum amount of kinetic energy that can be captured by a wind turbine is 59.3%.
17 Types of Turbines Size & Capacity Category Nameplate Capacity Description Onsite Community Utility 10 kw (residential) 500 KW (commercial) 10 MW < 50 MW 50 MW These systems are small, either stand-alone or net metered, and would probably involve only 1 turbine. Community-scale projects are typically either net metered or connected to the local distribution network, but could be connected to transmission. These projects are typically owned by and serve the community. They would probably involve less than 5 turbines. In the Midwest, there are community wind systems that are also utility scale using our definition. Industrial-scale wind power projects are most often developed by a company that either will own or sell the project for the purpose of realizing a return on their investment. An industrial-scale wind power project equal to or greater than 50 MW nameplate capacity is subject to the full approval process by the Commonwealth s State Corporation Commission.

18 Types of Turbines Size & Capacity


19 Types of Turbines Drag vs. Lift Drag Lift Tip Speed Ratio: The ratio between the rotational speed of the blade tip and the actual speed of the wind.
20 Types of Turbines HAWTs & VAWTs Horizontal Axis Wind Turbine Vertical Axis Wind Turbine Efficient Durable Proven Design Require a Yaw System Innovative/Modern Quiet Less affected by turbulence Can be installed on roof or short tower Easy to access electronics/generator Lower cut-in speed Accepts winds from any direction Aesthetically pleasing, Sexier
21 Types of Turbines HAWTs & VAWTs Horizontal Axis Wind Turbine Vertical Axis Wind Turbine Efficient Durable Proven Design Require a Yaw System Innovative/Modern Quiet Less affected by turbulence Can be installed on roof or short tower Easy to access electronics/generator Lower cut-in speed Accepts winds from any direction Aesthetically pleasing, Sexier
22 Types of Turbines Upwind vs. Downwind Upwind Downwind Eliminates potential for tower shading. Require a yaw mechanism to orient into the wind. Rotors must be more rigid. Over-speed protection generally by furling, mechanical braking, or electromagnetic braking, or blade pitching. Can have influence of tower shading. Orient themselves into the wind via coning. Rotors can be more flexible Over-speed protection generally by mechanical braking, electromagnetic braking, or blade pitching
23 Types of Turbines Active vs. Passive Yawing Active Yaw Control Passive Yaw Control Utilizes an electrical yawing mechanism using data acquired from onboard sensors and computers to automatically or manually orient into the wind. Orients itself into the wind via mechanical system built into the design and engineering of the turbine.


24 Types of Turbines - Over-speed Protection Furling Blade Pitching Electromagnetic & Mechanical Braking


25 Types of Turbines Number of Blades Cheaper Less frequent flickering Lower noise Balance Issues Can generate more lift Balanced Rotor More blades costs more $$$ Possible wake effects Heavier The Compromise

26 What Turbine Goes Where Onsite Systems

27 What Turbine Goes Where Community Wind Systems

28 What Turbine Goes Where Community Wind Systems A 660-kW community system in Hull, MA, less than 10 miles from Boston.

29 What Turbine Goes Where Utility Wind Systems Bear Creek Wind Power Project near Wilkes-Barre, PA, as seen from the PA Turnpike. These are 2.0 MW Gamesa Turbines.

30 What Turbine Goes Where Utility Wind Systems Wind Farm in West Texas

31 What Turbine Goes Where Utility Wind Systems Middelgrunden Offshore Wind Farm - Denmark
32 Wind Energy 101: Siting
33 Phases of Wind Project Development Prospecting Phase Early Preliminary Analysis on potential sites. Lease Blocks (Offshore) Planning Phase (1 5+ years) Project Proposals Permitting Environmental Assessment Wind Resource Assessment Financial Planning Project Layout Interconnection Agreements Time in this phase differs depending on scale of project. Community Outreach/Acceptance Construction Phase (1 2 years) Operations and Maintenance Decommissioning Dismantle or Refurbish equipment at end of typical life cycle.

34 How Do You Site a Turbine Wind resource Current land use Environmental impacts Government regulations Cost of wind farm Distance to nearest transmission source and nearest load Road access Economic payback Community opinion Aesthetics Noise Flicker issues Spacing of turbines Much, much more! Mountaineer Wind Energy Center, WV


35 What Turbine Goes Where Class 1 = m/s Class 2 = m/s Class 3 = m/s Class 4 = m/s Class 5 = 7.5+ m/s


36 Finding your Wind Resource Real Data Meteorological Tower, Personal Weather Station, Sodar, Lidar Archived Weather Data/Airport Data

37 Siting Issues Shadow Flicker can occur when any moving object comes between a viewer and a light source to create recurring shadows. In the case of wind turbines, this can happen each time a blade passes in front of the sun In general, shadow flickering occurs for only a few minutes near sunrise and sunset. Significant difference in shadow flickering between utility-scale wind turbines and small wind energy systems. Smaller towers Faster RPM Mountaineer Wind Energy Center, WV

38 Siting Issues - Noise Ambient Noise the combined noise from all sources both near and far. Considered normal. Intrusive Noise any noise that exceeds the ambient noise level at a given location. What makes a noise intrusive? Time of day Situational circumstance Sensitivity of the listener Decibels 10 x intensity of 0 decibels = 10 db 100 x intensity of 0 decibels = 20 db 1000 x intensity of 0 decibels = 30 dbon Etc What is noisy is relative to the observer


39 Siting Issues Birds & Bats Wind Turbines are known to kill birds as well as bats. Important to consider the types of birds being impacted Ongoing research investigating impacts and mitigation techniques at existing facilities. Bat impacts not as well understood at this time. Siting is key for new facilities! Not the same for small wind turbines! Shorter towers Smaller rotor diameter Faster RPM Wind Turbines are known to kill birds.


40 Other Siting & Environmental Challenges Do wind farms cause habitat fragmentation? Depends on location and species considered. Not necessarily just avian life. Can wind farms have indirect effects on wildlife? Depends on location and species considered. Recent research implies effects aren t necessarily negative. Do Wind Turbines/Wind Farms effect property values? 2009 study by Lawrence Berkley National Laboratory Transmission Lines If nearest transmission is > 10 miles to be profitable Road Access Particularly an issue with mountain sites. Ice Throw Exaggeration Land Use Protected Lands National Parks Shipping Lanes Military Operations

 Sea")


41 Offshore vs. Onshore More wind Less complex terrain Bathymetry (depth) Sea bed geology Selection of turbine and foundation structure Wind farm design and cable laying Reduced social impacts (visual, noise, shadow flicker, etc) Increased cost More maintenance Both onshore and offshore development required

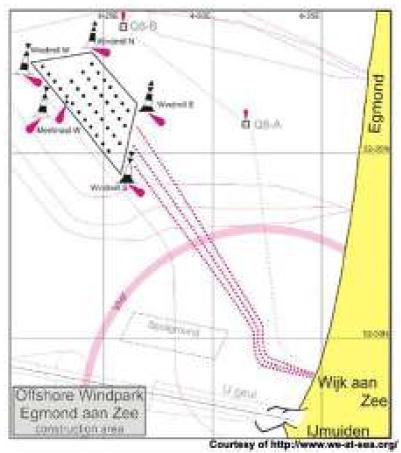


42 Wind Farm Layouts


43 Environmental Impacts An Environmental Impact Statement (EIS) as defined by the National Environmental Policy Act (NEPA) is necessary to ensure minimal impact to the marine environment. Marine and coastal habitats of importance Sandbanks Mangroves Seagrasses Coral reefs Large shallow inlets and bays Submerged or partially submerged sea caves Birds, bats and marine life noise and vibration during construction phase Destruction of important habitats for birds, bats and marine life Marine life noise and vibration during operation phase Effects of EMFs from subsea cables on marine life Other
44 Other Impacts and Marine Traffic Related Barriers Bunkering Zones Military impact on radar and navigation and other operations Port Approaches and Shipping Lanes Nature Reserves Restricted Areas Fishing and Fish Farming Archaeological sites, shipwrecks and areas of historical significance Boating, yachting and other tourism and recreational activities More expensive than conventional sources of energy and onshore wind Driving factors behind cost Distance to shore more cabling, deeper waters Foundation structures Offshore substations Cost to upgrade ports, build roads, upgrade electrical infrastructure onshore