Central Washington Biomass Energy Workshop
|
|
|
- Hugh Rose
- 5 years ago
- Views:
Transcription

1 Central Washington Biomass Energy Workshop April 29, 2015 Brent J. Sauder Director, Strategic Partnerships University of British Columbia


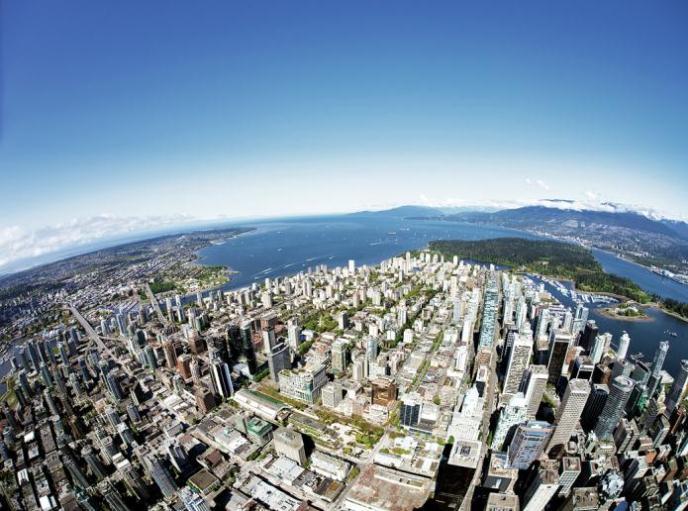
2 Welcome to UBC s Point Grey Campus

3 Targets Greenhouse Gas Emissions at UBC


4 Teaching and Research Excellence Independent Municipality Innovation and Commercialization Leader Independent Utilities Supportive Provincial policies Enablers of Innovation 4

5 Project Drivers: Aging infrastructure Increasing Energy Need GHG Commitment
6 Technology Driver


7 The Team UBC Operations, Faculty, Students, Researchers; with industry partners: Nexterra, General Electric, BCHydro; and the local community: UNA, SHHS UBC project partners include: BC Bioenergy Network BC Ministry of Energy, Mines BC Ministry of Forests BC Hydro Western Economic Diversification City of Vancouver FP Innovations GE Energy Natural Resources Canada Nexterra Systems Corp. Sustainable Development Technology Canada 7

8 What were the social licence barriers of the BRDF? biomass sourcing building siting truck traffic air emissions


9 Fuel (Biomass) Sourcing Fuel is ground & chipped waste wood: Sawmill residuals Furniture/carpentry offcuts Municipal trimmings Land clearing operations Uses 2-4 trucks per day for 12,500 dry tonnes per year. 9


10 Housing Childcare Housing Social License: BRDF Siting Childcare The site was chosen to be a first of its kind in BC, for a social license, to demonstrate a biomass/cogeneration facility in a high density urban setting Secondary consideration for site was the close proximity to Marine Drive and operational support


11 Above & beyond: Ambient Air Monitor Emission Dispersion Study showed Marine Tower 5 as the most likely residential building for air emission impact June 2012, UBC proactively installed a real time Ambient Air Monitor on Marine Tower 5 Automatic s alerts if air quality limits are exceeded 24 hour average PM 2.5 < 25 µg/m 3 or 1 hour NO 2 < 107 ppb Air emissions remain well below Metro Vancouver limits 11


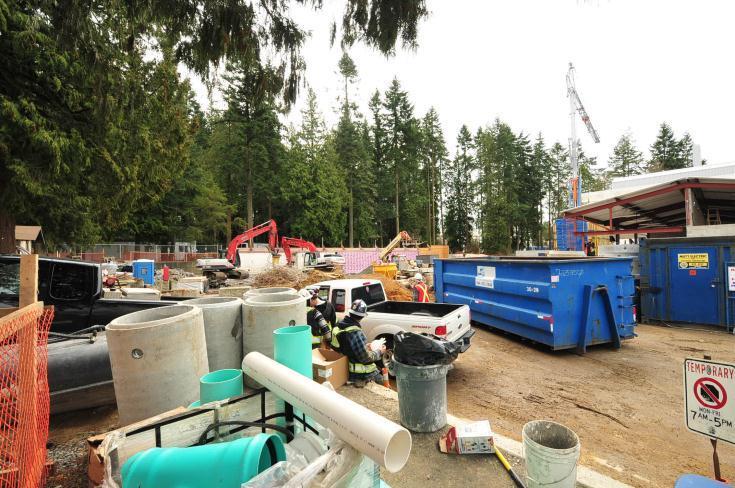
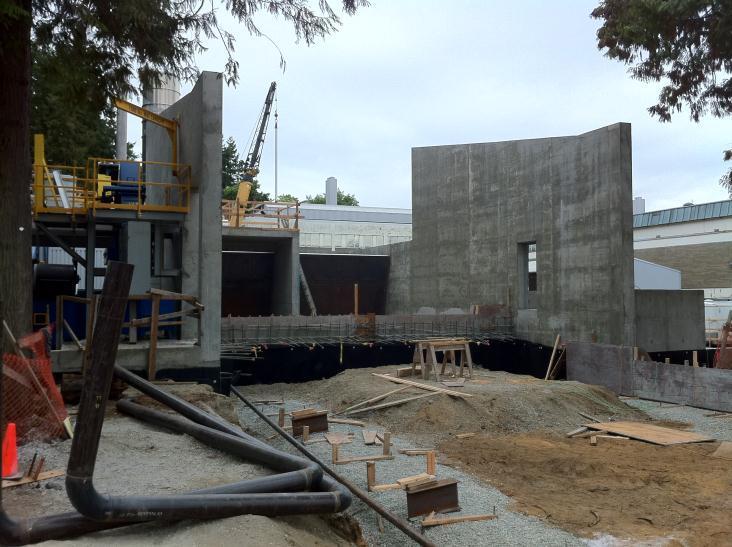


12 Bioenergy Facility

13 How has the BRDF performed? 2 MVA contribution to electrical capacity constraint issue. Mitigated peak capacity of powerhouse boilers (originally approved to be replaced in 2008/09) Etc

14 BRDF Air Emissions (Performance) Permit Requirements Dryer Boiler Engine Permit Test Permit Test Permit Test PM Particulate Matter NO x Nitrogen Oxides VOC Volatile Organic Compounds Opacity 5% <5% 5% 0% 5% <5% Verified by 3 rd party testing (Al Franco) Unless otherwise noted, all units are in mg/m3
15 ENHANCED PERFORMANCE: BRDF Biomass Thermal Biomass Cogeneration Biomass Thermal & RNG Cogeneration Steam Boiler Heat Recovery Steam Generator (HRSG) Hot Water Engine Heat Recovery 6.0 MWt (20,000lbs) 1.5 MWt (5,000lbs) MWt (4,600lbs) - 1 MWt 6.0 MWt (20,000lbs) 1.4 MWt (4,600lbs) 1 MWt Electrical Energy - 2 MWe TOTAL 6 MW 5.9 MW 2 MWe 10.4 MW* Note 1MWt = 1 MegaWatt (thermal) = 3,333lbs steam *75% increase in energy production
 $11.1/GJ $8.5/GJ Revenue generated $3.2M $3.9M break-even forecast 2 2026 2028 1.")
16 BRDF PERFORMANCE BRDF Project Remaining principle ($8.15M loan) Original Business Case $8.15M The Current Situation FY15 Forecast $7.4M Annual O&M cost $1.4M $1.1M Annual fuel input cost 1 $0.8M $2.6M Price of Natural Gas (2015) $11.1/GJ $8.5/GJ Revenue generated $3.2M $3.9M break-even forecast Fuel Input costs are considerably higher due to 1) the use of renewable natural gas as the primary fuel for cogen, and 2) the plant is now operating in full thermal and cogen modes simultaneously. 2. The break-even forecast is extended by 2 years due to 1) the delayed completion of the project, and 2) our unsuccessful efforts to reliably produce electricity from syngas. Steam Produced (MWh) Portion of Campus Thermal load from the BRDF GJ of natural gas offset Tonnes CO2 offset Electricity Produced (MWh) FY15 thermal only 34,000 18% 146,000 GJ 6,880 9,800 Photo Credit: Don Erhardt


17 PERFORMANCE: LESSONS LEARNED Requires a higher biomass fuel quality than expected (<30% moisture content) Syngas clean up process equipment failures. Requires several system upgrades & yet to be resolved Higher operational costs than expected e.g. people, maintenance and materials
18 Other Outcomes Community Trust Research Asset Reference Site Culture of Innovation


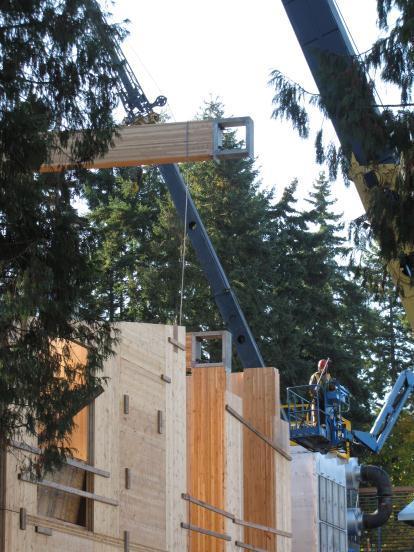
19 Drove Marketability of Canadian CLT Provided detail imbedded in the Manufacturing Chapter of the CLT Handbook Handbook provides Standards to realize: Manufacturing of CLT in Canada Use of Canadian Fibre Construction of CLT structures in Canada 19
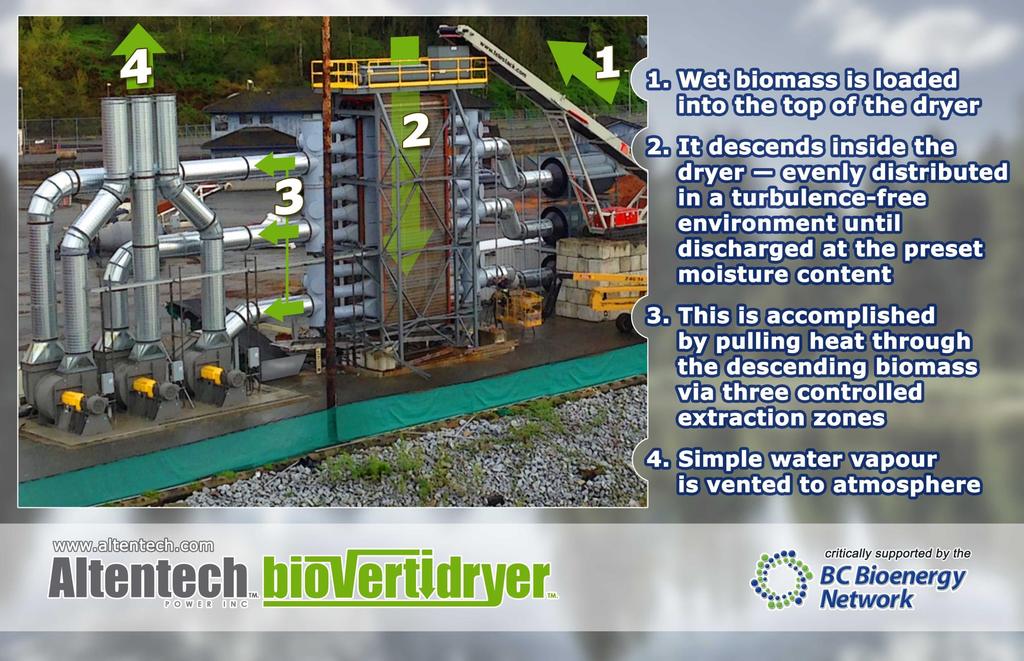
20 New Technologies Thermo-Chemical Processes Gasifiers Pyrolysis Ancillary Processes Dryers Char/Ash recovery/utilization
21

22 NEXT STEPS: Continue to work with FortisBC to reduce the cost of renewable natural gas. Continuous improvement to operations and efficiency. Pre-feasibility study of expanded biomass operation to meet 2020 greenhouse gas reduction target.