May 16-18, 2017 Sheraton Philadelphia Society Hill Hotel Philadelphia, Pennsylvania.
|
|
|
- June James
- 5 years ago
- Views:
Transcription


1 VISUALIZATION OF UPPER KLAMATH LAKE WQX WATER QUALITY DATA Anthony Falzone, FlowWest Megan Skinner, The Klamath Tribes 2017 Exchange Network National Meeting INNOVATION AND PARTNERSHIP May 16-18, 2017 Sheraton Philadelphia Society Hill Hotel Philadelphia, Pennsylvania
2 ABSTRACT The Klamath Tribes have been collecting environmental data in the Upper Klamath Basin for decades. To harness the potential power of the Klamath Tribes rich collection of water quality data, the Klamath Tribes have developed an Exchange Network Node and a dashboard to visualize and disseminate water quality data to stakeholders and practitioners of ecosystem management in the basin. To facilitate collaboration and analysis of data, the Klamath Tribes developed a Tableau Dashboard for data visualization, exploration, and analysis. This presentation will provide an overview of the work flow to develop the Exchange Network Node, the Klamath Tribes water quality dataset, and of the dashboard for data visualization. 2

3 Upper Klamath Basin 3
4 Klamath Tribes The Klamath Tribes of Oregon Klamaths Modocs Yahooskin Have lived in the Klamath Basin of Oregon, from time beyond memory The Klamath Tribes Aquatics Program has been monitoring lake and river water quality since 1990 Since 2006, the Sprague River Water Quality Lab (SRWQL) has analyzed all water nutrient and algal toxin samples in-house 4
5 FlowWest Technology consultant for water quality data management, synthesis, and visualization Worked with the Klamath Tribes to develop the Upper Klamath Lake Water Quality Database and visualization dashboard 5
6 Problem The Klamath Tribes have been collecting environmental data for decades, but needed to develop a data management, sharing, and analysis framework A rapid and collaborative workflow was needed for the more efficient and effective integration, management, quality assurance, and sharing of water quality data Needed to enhance and streamline the Tribes ability to share data to enhance ecosystem restoration and management 6
7 Solution Develop Klamath Basin Environmental Data Exchange Network and visualization tools Implement systems and tools to efficiently acquire, manage, assure quality, share, and collaboratively analyze environmental data in the Upper Klamath Basin Enhance and streamline the Tribes ability to share data with collaborators for ecosystem restoration 7
8 Datasets Dataset Period of Record Geographic Extent Lake Upper Klamath Lake & Agency Lake Tributary Tribs to Upper Klamath Lake Sprague River Sprague, Sycan, Whiskey Ck Phytoplankton Upper Klamath Lake & Agency Lake Zooplankton Upper Klamath Lake & Agency Lake Sampling Sites Sampling Type (#) 11 Water Quality 6 Water Quality 9 Water Quality 11 Phytoplankton 11 Zooplankton 8
9 Datasets Dataset Sampling Type Parameters Lake Water Quality Max. depth, Secchi depth, profile depth, photosynthetically active radiation, temp., conductivity, DO, ph, % DO saturation, oxidationreduction potential, total phosphorus, phosphate as soluble reactive phosphorus, ammonium nitrogen, nitrate nitrogen, nitrate+nitrite nitrogen, total nitrogen, silica, chlorophyll a, phaeophytin Tributary Water Quality Discharge, depth, temp., conductivity, DO, ph, % DO saturation, total phosphorus, phosphate as soluble reactive phosphorus, ammonium nitrogen, nitrate nitrogen, nitrate+nitrite nitrogen, total nitrogen, silica, total suspended solids, turbidity Sprague River Water Quality Discharge, depth, temp., conductivity, DO, ph, % DO saturation, total phosphorus, phosphate as soluble reactive phosphorus, ammonium nitrogen, nitrate nitrogen, nitrate+nitrite nitrogen, total nitrogen, chloride, silica, total suspended solids, turbidity Phytoplankton Phytoplankton Genus, species, biovolume std, percent biovolume standardized, cell density std, % cell density std, natural unit density, % natural unit density Zooplankton Zooplankton Genus, species, biomass, percent biomass, abundance, percent abundance 9

10 Dataset Extents 10

11 Work Flow 11

12 Data in WQX 12


13 Big Data Analytics & Visualization Data Integration Work Flow Knowledge Management 13
14 Tableau is a leader in the field of data visualization and produces a family of interactive data visualization products Interactive Tableau dashboard allows for the visualization of the water quality data that goes beyond static charts to create multi-faceted views of data explores relationships between different analytes and data collected at different sample sites Easy to use and no programing experience required to modify dashboards 14

15 Upper Klamath Basin Dashboard Analyte 1 Chart Sample Site Location Map Analyte 2 Chart USGS Hydrology Chart 15

16 Map of Monitoring Locations 16
17 Time Series of Flow Data 17

18 Comparison of Analytes (DO & ph) 18

19 Selectable Time Series 19

20 Select Site and ToolTip 20

21 Select Multiple Sites 21
22 QA/QC Dashboard Purpose: Identify and correct errors on a quarterly basis to streamline the year end QA/QC process What is it? Series of interactive charts and dashboards for each analyte Identifies outliers outside of range of expected values (based on historical data) Added value: Increase the understanding of water quality parameters and field conditions for Klamath Tribes field techs 22
23 QA/QC Dashboard Components Dashboards comparing results of select analytes from the Sprague River, tributaries, and Upper Klamath Lake datasets Time series charts of each analyte shown with the expected range of values for each analyte 23

24 Outliers Across Three Datasets 24
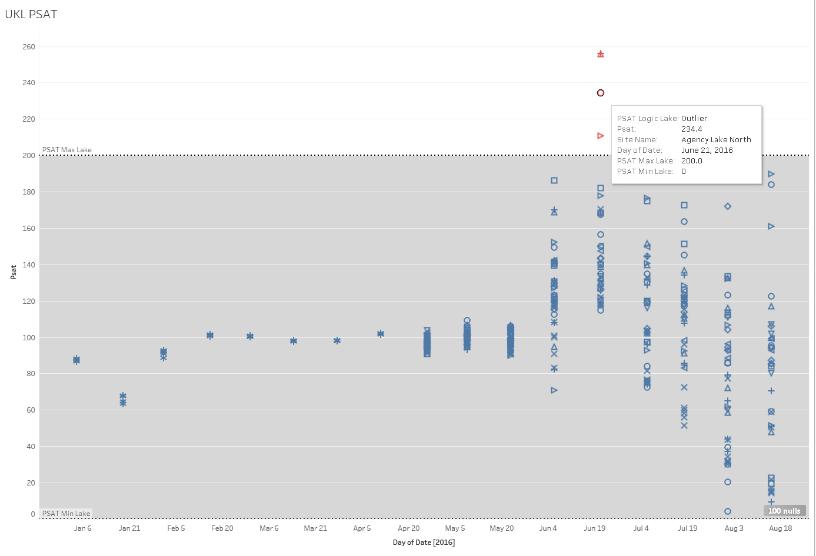
25 Identification of Outliers 25

26 Questions Anthony Falzone Megan Skinner