Draft Land Use, Scenario Planning, & Sustainability Technical Report. Summary
|
|
|
- Tobias Burns
- 5 years ago
- Views:
Transcription

1 ` Draft Land Use, Scenario Planning, & Sustainability Technical Report Summary

2 Introduction In 2006, the Genesee County Metropolitan Planning Commission (GCMPC) performed an analysis of the past and current land use trends in Genesee County. Since this time, staff has worked to produce county-wide population and employment projections out to the year With the completion of these projections, staff has taken the land use analysis to the next step by developing future land use trends for the County. The 2006 analysis proved to us that urban sprawl had been occurring at a very rapid rate in Genesee County for the past thirty-five years. While the population from 1978 to 2006 actually decreased by about 1%, developed land in the county increased by 85%. During this same time period over 90,000 acres of farmland, forests, open range, and wetlands had been developed. Land use trends in the county relied heavy on land consumption with the majority of development occurring on agricultural lands and other open spaces. While new development during this time period was largely residential; commercial and industrial expansion was also occurring (see Appendix A: A Changing Landscape). This analysis also revealed that a disproportionate amount of this development was occurring in the rural townships while a lack of growth was occurring in the core urban districts of the county. Most recently, an economic downturn between 2005 and 2010 has played a significant role in communities throughout Genesee County. After a significant reduction in employment, the 2040 Socioeconomic Projections indicate a gradual increase in employment county-wide from 2010 forward. An increase in employment would impact the built environment with the construction of new buildings or through the redevelopment and the renovation of older urban structures. GCMPC staff has developed four (4) separate scenarios to explore various development possibilities (scenarios) and how these possibilities could affect Genesee County s transportation system. 1

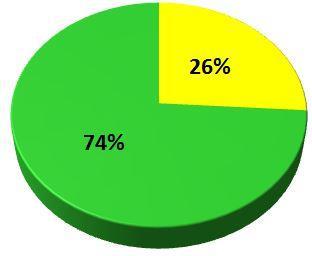
3 2040 Built Environment Projection To expand on the analysis completed in 2006, GCMPC has projected the Built Environment out to the year During the development of the 2006 analysis, the County s base year population totaled 449,150 residents. When calculating the 2040 Built Environment, the base year had decreased to 425,790. A challenge faced during projections was the immense population loss in the City of Flint. The City of Flint alone has had a population decrease of on average 20,000 residents per decade since The large loss in population will more likely be observed in land consumption with occupancy of existing structures first, followed by new development. In the upcoming scenarios, staff has developed three alternative scenarios where the City of Flint s population numbers are stabilized, contrary to current 2040 projections. The built environment made up of residential, commercial, industrial and other developments is still expected to grow at a significant rate. By 2040, it is projected that developed land in Genesee County will have increased by 104% since the first inventory was completed in At the same time, the county is expected to lose 37% of undeveloped land farmland, forested lands, rangelands, and wetlands. In the 1980 s and 1990 s, heavy land consumption was concentrated in the townships. The 2040 projection shows this trend continuing. In the townships alone, over 97,000 acres of undeveloped land will have been developed since This amount, coupled with the growth expected to occur in the cities, climbs the total amount of undeveloped land consumed in the county to nearly 111,000 acres. Growing Pains Below is a survey of high growth areas in Genesee County. Notice the immense amount of land development occurring in these areas, while the populations tend to increase by much smaller amounts. In fact, all but four townships in the county consumed land at a rate twice as fast as the population growth, or faster. 2


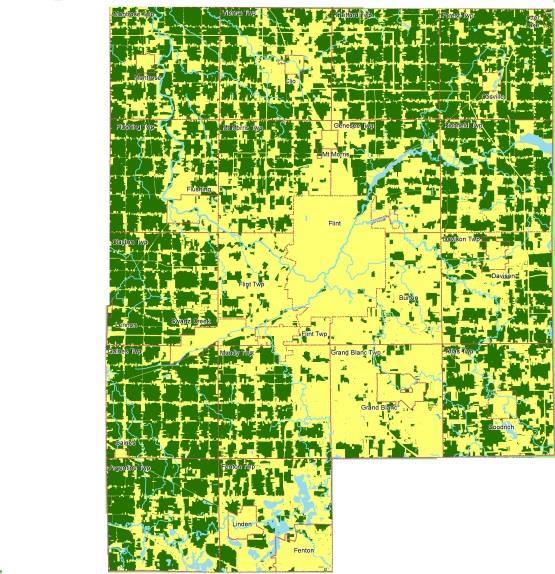
4 Land Use Trend: (Projected) 3


5 Scenario Planning Scenario Planning offers a way for Genesee County to explore various development possibilities (scenarios) and how these possibilities could affect the transportation system; more specifically, the levels of congestion that different development patterns may create. It allows planners and decision makers the ability to identify policies that can adapt to changes in development, population, employment and traffic congestion. This method of planning allows Genesee County a glimpse into our potential future depending on how and to what degree development occurs. Each scenario generates different effects on the transportation system. These scenarios are coded into the Travel Demand Model and the outputs of each can be compared for their different levels of congestion and environmental factors. The elements that change from scenario to scenario is population and levels of employment per traffic analysis zone (TAZ). The results from this exercise will be used to help make decisions during project development. Development of Scenarios Staff developed four scenarios for the 2040 Long Range Transportation Plan which includes Status Quo, Sustainable Growth, Hyper-Growth and Sustainable Hyper-Growth. Each scenario is described in detail below: Status Quo Scenario This is the business as usual scenario. This scenario shows population shifting away from the older urbanized areas to suburban and rural undeveloped areas. It uses the current population and employment growth rates that were approved by the Genesee County Metropolitan Alliance for use in the 2040 Long Range Transportation Plan which is a 15% growth in employment and -0.6% decline in population from 2010 to Sustainable Growth Scenario* This scenario uses the same employment and population growth rates as the Status Quo scenario. Growth is clustered near urbanized areas as a result of urban reinvestment and suburban planning. 4

, with the development patterns of the")
6 Hyper-Growth Scenario* This is the economic boom scenario. It shows inflated growth in population and employment with dispersed development. A 30% growth rate in employment and 30% growth rate in population were utilized to project into the year Sustainable Hyper Growth Scenario* This is the urban reinvestment and economic boom scenario. This scenario combines the increased growth of the Hyper Growth Scenario (30% growth rate in employment and 30% growth rate in population by the year 2040), with the development patterns of the Sustainable Growth Scenario which clusters development in and around urbanized areas. *For the Sustainable Growth, Hyper Growth, and Sustainable Hyper Growth scenarios, the City of Flint s population was held at 2020 projected levels. 5


7 2040 Growth Scenarios Status Quo Scenario Sustainable Growth Scenario Hyper Growth Scenario Sustainable Hyper Growth 6
8 2040 Scenarios At A Glance Evaluation Factors Status Quo Sustainable Growth Hyper Growth Sustainable Hyper Growth Urban & Built Up Land Area (acres) 218, , , ,359 Lost Farmland & Open Space (acres) 20,281 11,071 34,130 11,574 Increased Infrastructure Costs $$$ $ $$$$ $$ Increased Need for Public Services High Low Very High Medium Impervious Surface Extensive Increase Slight Increase Extensive Increase Average Increase Population 423, , , ,838 Employment 212, , , ,683 Daily Hours of Traffic Delay 7,679 7,341 9,769 9,144 Daily Vehicle Miles Traveled 11,828,444 11,701,426 12,702,831 12,409,275 Congested Lane Miles of Roadway Lane Miles of Road LOS D or Greater % population reached (within a ¼ mile radius) by Fixed-Route Transit ( ) 22.2% 37.2% 35.0% 43.9% NOx Emissions 4,559 4,524 4,934 4,827 VOC Emissions 4,898 4,875 5,325 5,229 Model Analysis In the summer of 2014, the official population and employment projections were approved for use in the 2040 Long Range Transportation Plan (summary table located in appendix, full methodologies can be found in the Transportation Model Technical Report of the 2040 LRTP). These projections were the basis for the Status Quo scenario. These socioeconomic projections were developed using current U.S. Census data, local building permit information, and the latest forecasting measures. The Status Quo scenario best represents the current policies and regulations in our local units, as well as the changes that will emerge on our roadways if growth and development continue to occur based upon existing trends. Official projections based upon sound methodology and approved processes must be in place to defend against any legal challenges that may occur in relation to this Long Range Transportation Plan. These projections, and the Status Quo scenario that they produce, are the official, approved forecast for Genesee County and have been utilized to project deficiencies on the county transportation system using the Travel Demand Model. While the projections used for the remaining scenarios may not be as concrete as those used for the Status Quo scenario, sound methodology was used develop these valuable planning tools. These what if scenarios can be used to peer into the future and help direct decisions about how we want that future to look and feel. 7
9 Genesee County Vision The scenario planning exercise has given us basic data that enables staff, other local planning officials, and transportation agencies to continue dialogue on the ways that transportation and land use are linked and how to manage both effectively and cooperatively. There are a number of indicators used to describe these four scenarios. Based on the findings, each scenario predicts a different development path and raises different quality of life issues for Genesee County residents. If the Status Quo land consumption is allowed to continue, more and more agricultural resources and other valuable lands estimated at over 20,000 acres will make way for residential homes and strip commercial developments by the year As this pattern continues, negative impacts like an increase in infrastructure costs, increased public service needs, reductions in air quality, and more time spent in the car may occur. The Hyper Growth scenario is used to illustrate more intense negative impacts that stem from sprawl development. A lack of responsible growth standards and development guidelines only fuel this consumption pattern. It is certain that there are more efficient ways to utilize land in our county, and with more efficient land use, can come a higher quality of life for area residents. The Sustainable Growth scenario offers a much more efficient way to handle growth in Genesee County. Not only does this scenario preserve over 9,000 acres of undeveloped land and maximize the use of infrastructure we already have in place, but a number of other positive outcomes are possible as well. The redevelopment of our urbanized areas in place of sprawling subdivisions and strip malls will keep infrastructure costs down, keep the need for costly new schools and public services to an absolute minimum, decrease the amount of vehicle miles we travel on a daily basis, improve air quality, and increase the population reached by the primary transit system. These are all positive outcomes of an improved development strategy. With more efficient development standards and zoning practices in place, the effects of a Hyper Growth scenario would be much more positive as illustrated in the Sustainable Hyper Growth scenario. 8
10 Future Development Recommendation Sustainable Growth Scenario The four growth scenarios presented in this report have helped shed light on the potential positive and negative impacts on our land, air, roadways, and even our pocketbooks. While capacity deficiencies are based on the Status Quo scenario, the motivation for creating the scenarios was to help formulate a vision of how and where future development should occur in Genesee County. Of the four scenarios evaluated, the Sustainable Growth development scenario was deemed the best as it could potentially preserve over 9,000 acres of farmland and open space, keep costs for new infrastructure and public services down, and concentrate the population reached by the primary transit system. This particular scenario weighs heavily on the positives in a majority of the evaluation categories. In an effort to move toward the Sustainable Growth scenario in the future, the following recommendations have been provided. A number of these recommendations were provided by Governor s Land Use Leadership Council in o Strengthen and direct development towards existing communities. o Encourage cities, villages, and townships to work together and adopt common goals for future development. o Encourage local units to update zoning ordinances and master planning documents and seek commonality with other local units of government to promote smarter growth standards and development guidelines. o Encourage transportation system maintenance and improvements on the existing infrastructure, while minimizing costly expansion of the system. o Preserve open space, farmland, natural beauty, and critical environmental areas. o Provide a variety of transportation choices. o Take advantage of compact development design. o Foster distinctive, attractive communities with a strong sense of place o Create walkable neighborhoods 9