Algarve surface and groundwater quantity and quality data assessment
|
|
|
- Noreen Norris
- 5 years ago
- Views:
Transcription


1 Algarve surface and groundwater quantity and quality data assessment MARSOL Water Quality workshop - Algarve Demonstration Site Conceição ago, Edite Reis Faro, 25 June 2015

2 Rivers, artificial lakes and aquifers systems
3 Hydric Ressources - Quantity Artificial lakes maximum storage capacity Artificial Lakes Water use Maximum storage capacity (x 10 6 m 3 ) Arade Irrigation 26,9 Bravura Irrigation and water supply 32,3 Beliche Irrigation and water supply 47,6 Funcho Irrigation 46,6 Odeleite Irrigation and water supply 117 Odelouca Water supply 157 The surface flow is calculated with data from hydrometric stations and flow measurements Runoff (Algarve river basin management plan) hm 3 /year Available groundwater ressources 388 hm 3 /year (Algarve river basin management plan).
4 Surface water Quantity monitoring network Hydrometric monitoring network There are 45 hydrometric stations in the Algarve region that measure river flows. From those, 23 stations have the main objective of measuring the in and out flows of aquifers, in order to calculate the contribution of rivers for the aquifers recharge. These stations have automatic sensors that continuously measure the rivers flow rate.

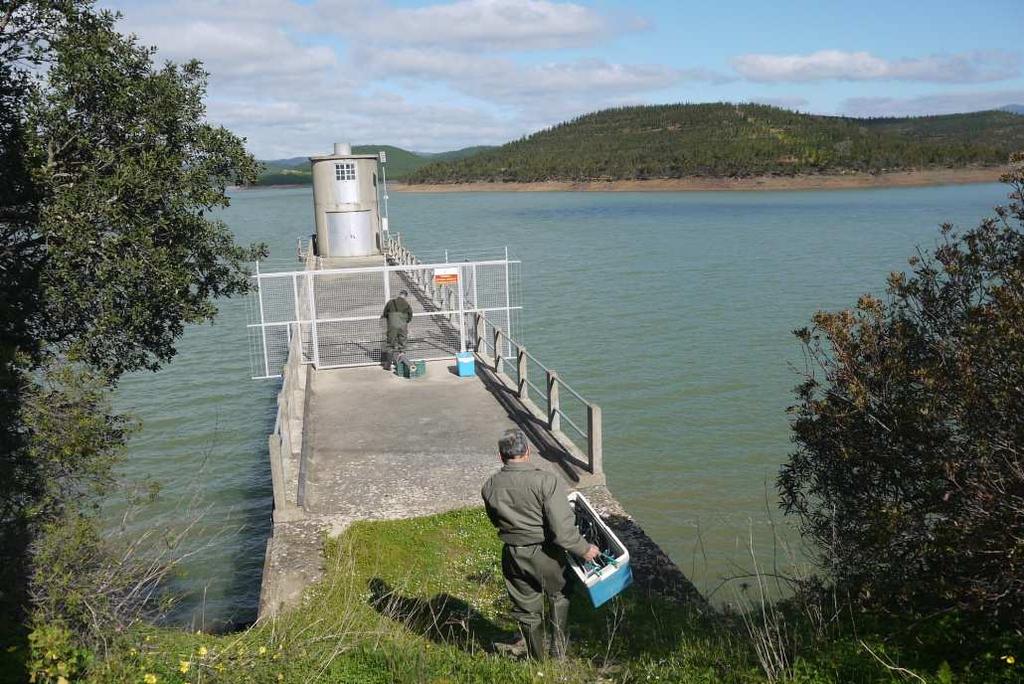
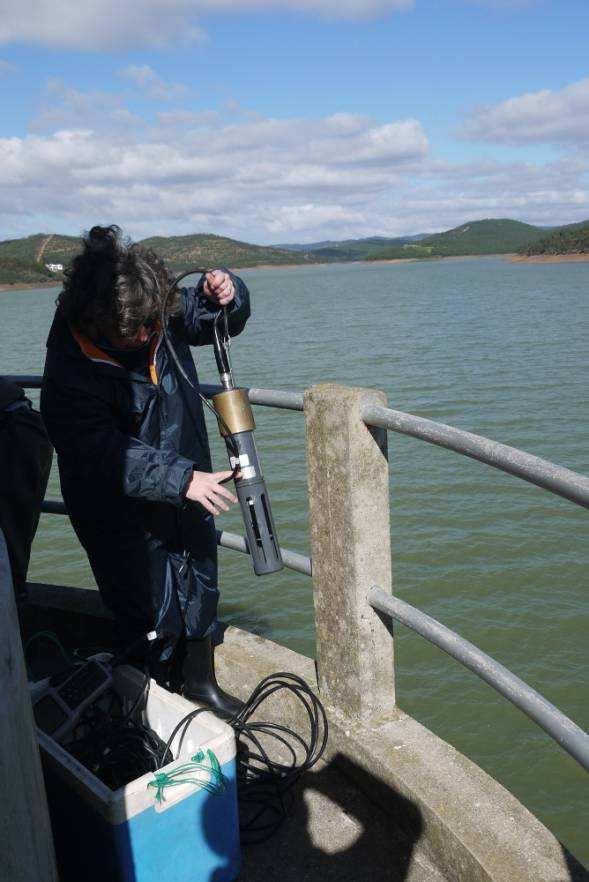
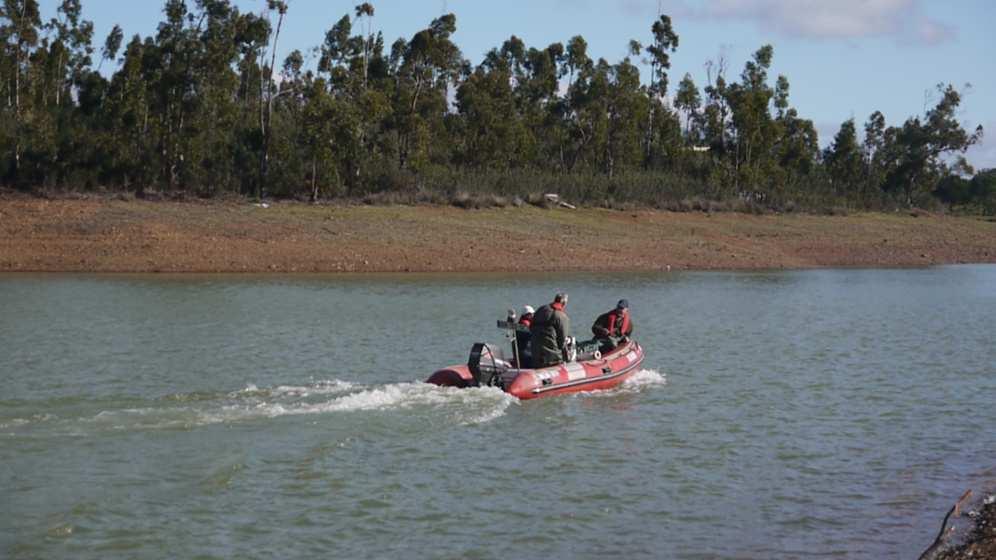
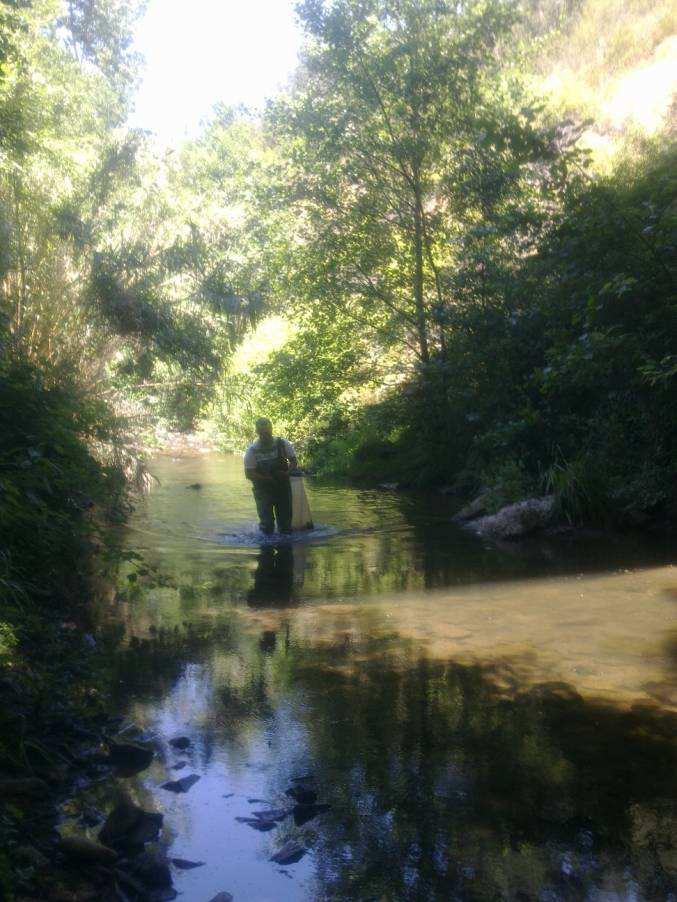
5 Surface water Quantity monitoring network The following photos show some flow measurements in rivers of Algarve

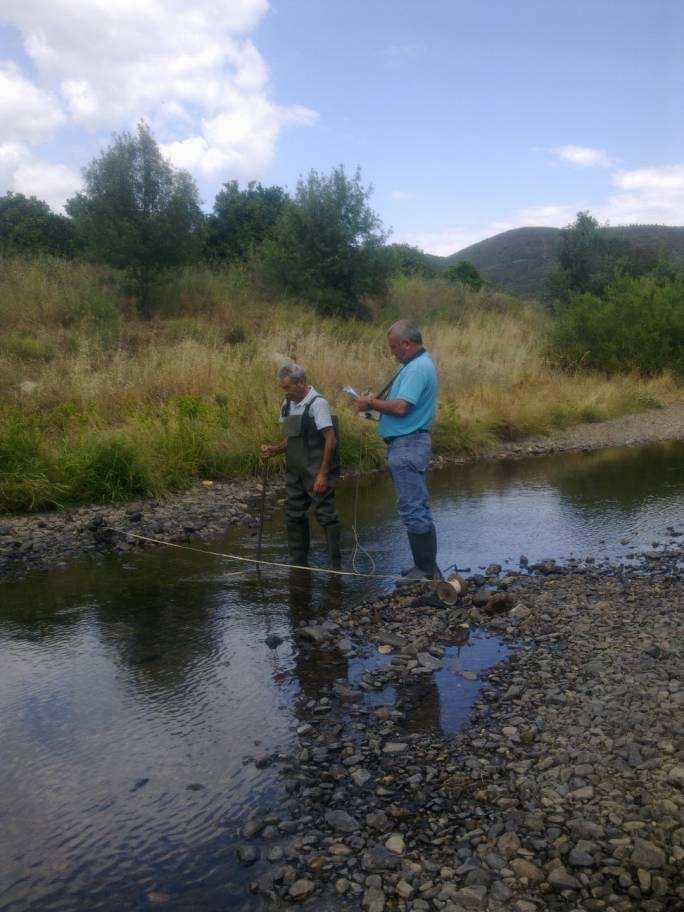
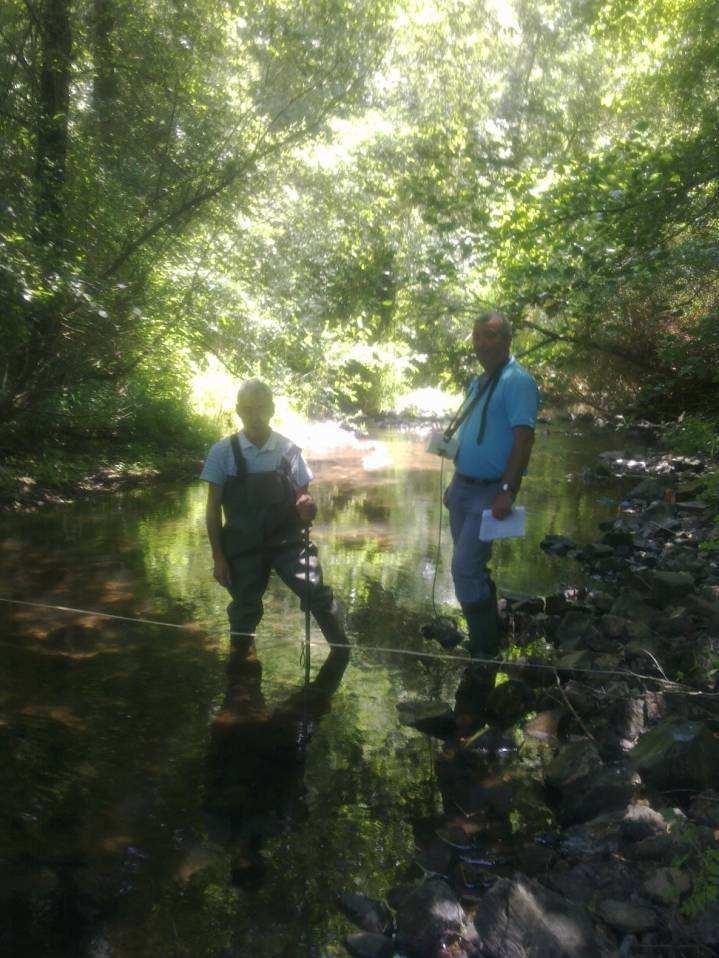
6 Surface Water - Quantity
7 Surface Water Quality Monitoring Network The monitoring network was designed so as to provide a coherent and comprehensive overview of ecological and chemical status within each river basin and to classify the water bodies: Natural surface water body Heavily modified and artificial water bodies Excelent (High) ood Moderate Poor Bad ood Moderate Poor Bad
8 Surface Water Quality Monitoring Network Ecological state E, Biological quality elements E M P B E M E M P B E E M P B E M M Specific pollutants E M P B Physico-chemical quality elements M M M M M Hydromorphological quality elements E E E E M E, E, E, E, E, E E E M Elements with worst classification Excelent (High) ood Moderate Poor Bad Water body status The worst classification of ecological and chemical status Chemical state Hazardous substances and Priority substances with European standards < < < < < Substances with worst classification ood Less than ood

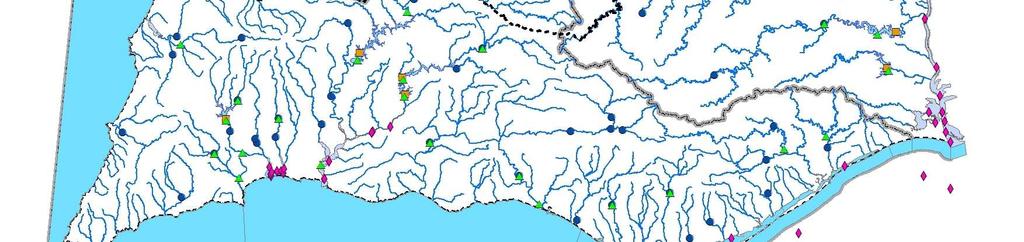
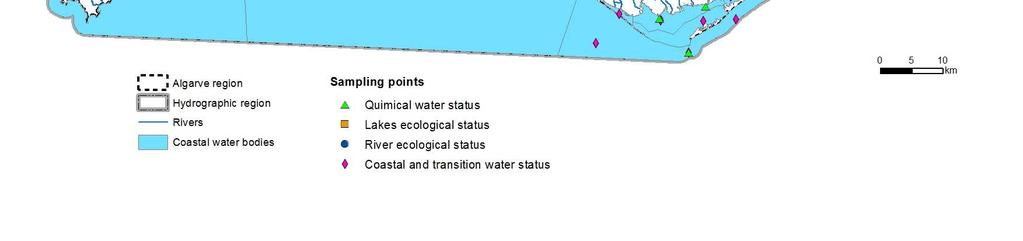
9 Surface Water Quality Monitoring Network


10 Surface Water Quality Monitoring Network Lakes monitoring network


11 Surface Water Quality Rivers monitoring network

12 Surface Water Quality It has been developed a research project to classify the ecological status of lakes located south of Tejo river, based on phytoplankton element. The classification of the status of water bodies is different from the 1st cycle. In the 2nd cycle, are used more biological elements, because they were inter-calibrated by the European Commission working groups. For this reason, some water bodies have worst their scores.
13 Surface Water Quality No. Water bodies Category lobal state Worst classification 7 RW Excelent (High) 69 RW+LW ood 13 RW Moderate Phytobenthos, Benthic invertebrate, Nutrient, Oxygenation 7 RW Poor Phytobenthos, Benthic invertebrate 2 RW No information 4 TW ood 3 TW Moderate Fish, Phytoplankton 1 TW Poor Fish, Phytoplankton 1 TW No information 3 CW Excelent (High) 4 CW ood 5 CW Moderate Benthic invertebrate, Nutrient

14 Surface Water Quality
15 roundwater From the 70 s on, with the tourist and agricultural development, there was a groundwater quality degradation (increased concentrations of chlorides and nitrates in some aquifer systems). Until the end of the 90 s, groundwater is only source for urban water supply and irrigation. After the construction of the Funcho, Beliche, Odeleite and recently Odelouca dams, groundwater was replaced by surface water, leading to the shutdown of municipal groundwater wells.

16 roundwater Quantity public and private extraction wells
17 roundwater Quantity monitoring network The piezometric monitoring network to measure the hidraulic heads in 167 piezometers in differents aquifers systems on monthly basis. About 20 piezometers are equipped with automatic sensors with continuous measures. The flow discharge of springs are measured monthly and, in some aquifers, in 30 springs, once each three months.
18 roundwater Quantity monitoring network
19 roundwater - Quantity The groundwater bodies are in quantitative good status, (according to Water Framework Directive) but one of them (Vale do Lobo subsystem Campina de Faro aquifer system), that is in poor status, because there are many extractions for irrigation (agriculture and golf), and as is near to the sea, may occur seawater intrusion.
20 roundwater Quantity
21 roundwater Quantity Now the quantitaty situation groundwater ressources is good. The hidraulic heads are near to the average data series (these data results of about 30 years of observations). Some aquifers of east Algarve, in the area of irrigation perimeter (the main source is surface water from Odeleite Beliche dams), the hidraulic heads are very near from the maximum values of data series. The surface irrigation water constitutes an additional recharge in summer, and the interseasonal oscillations desapear. In the last years, after 2012 the amount of precipitation is lower than the average to the region, and increase the torrential rainfall events.
22 roundwater Quantity 602/311 - Várzea rande 9,00 8,00 7,00 6,00 5,00 4,00 3,00 Evolution of the hidraulics heads in Almadena Odeáxere aquifer system 2,00 1,00 0,00 Cota do nível da água (m) Anos Evolution of the hidraulic heads in Luz Tavira aquifer /143 - Fazenda S. José Nível piezométrico (m) system. After 2002 there are influence from the irrigation with surface water. Anos
23 roundwater Quantity The Querença Silves is the bigger and the most important Algarve aquifer system, is in good status now. The hidraulic heads are near to the average of data series. In several dry years the aquifer system is in his sustainability limit, that theoretically, the increase of extractions should be forbidden, but in average or wet years this aquifer support an increase of extractions without compromising his sustainability.
24 roundwater Quantity /215 - Canal de Silves Cota do nível da água (m) Anos Cota do nível da água (m) 2016 Evolution of the hidraulics heads in discharge zone of the Querença Silves aquifer system 597/96 - Monte Sobreirinha Evolution of the hidraulics heads in recharge zone of the Querença Silves aquifer system Anos
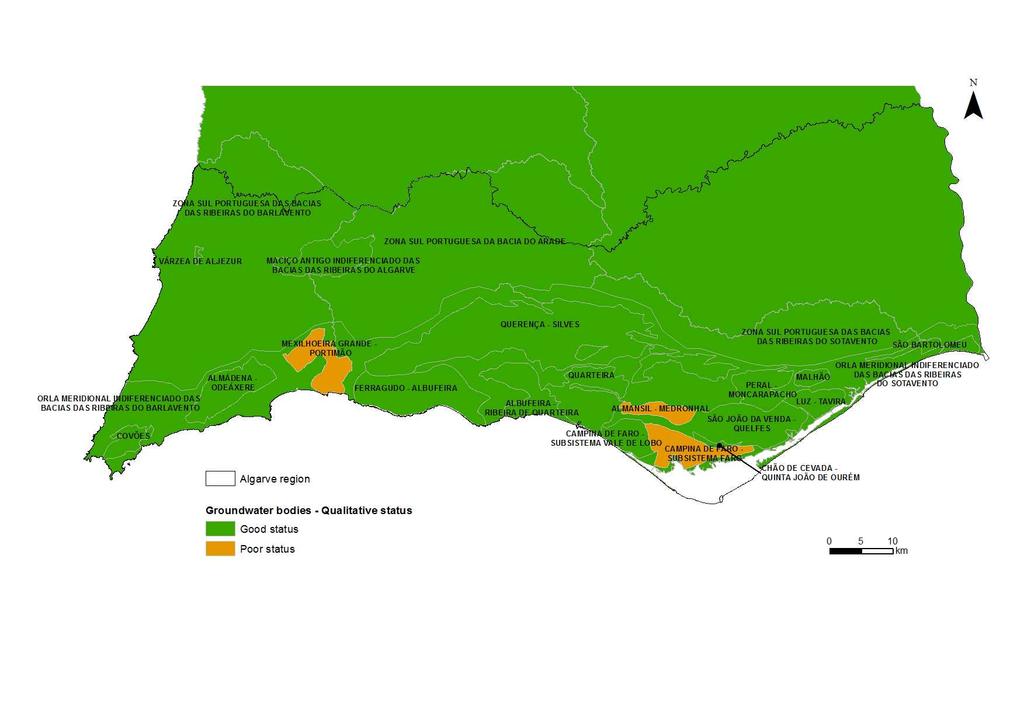
25 roundwater - Quality The groundwater quality monitoring network to have 150 sampling points (boreholes, wells, springs) in different aquifers systems. The samples are collected twice a year and are analysed for physical and chemical parameters. The main problems of groundwater quality are the high concentrations of chlorides and nitrates. The reason for high concentrations of chlorides could be the seawater intrusion and /or dissolution of salts from diapiric formations existing in depth, which are spread all over the region, normally associated with fault zones. The cause of nitrates high concentration are the agriculture activity and domestic effluents. Agriculture has been a major land use in the Algarve region. The aquifers systems with major problems are Campina de Faro and Luz Tavira. These aquifers were designated nitrates vunerables zones (the according Nitrates Directive), because they have the nitrates concentrations above 50 mg/l.
26 roundwater - Quality- monitoring network
27 roundwater - Quality 611/201 - Campina de Faro Cloretos (mg/l Cl) 400 Nitratos (mg/l NO3) Evolution the chloride and 300 nitrate concentrations in 200 Campina de Faro aquifer 100 system 0 Concentrações (mg/l) Data de colheita 608/067 - S. Pedro Cloretos (mg/l Cl) Evolution the chloride and 500 Nitratos (mg/l NO3) Concentrações (mg/l) nitrate concentrations in Luz Tavira aquifer system Data de colheita
28 roundwater - Quality