Quality Management in Construction Projects. Dr. Nabil El Sawalhi
|
|
|
- Calvin Nichols
- 5 years ago
- Views:
Transcription
1 Quality Management in Construction Projects Dr. Nabil El Sawalhi 1
2 Quality Definition The American Society for Quality (ASQ) glossary defines quality as A subjective term for which, each person has his or her own definition. In technical usage, quality can have two meanings: 1. The characteristics of a product or service that bear on its ability to satisfy stated or implied needs. 2. A product or service free of deficiencies. 2
3 The International Organization for Standardization (ISO, 1994a) defines quality as the totality of characteristics of an entity that bears on its ability to satisfy stated or implied needs. 3
4 Definitions of quality are 1. Philip B. Crosby Conformance to requirements not as goodness nor elegance. 2. W. Edward Deming Quality should be designed into both product and the process. 3. Armand V. Feigenbaum Best for customer use and selling price. 4
5 4. Kaoru Ishikawa Quality of the product as well as after-sales services, quality of management, the company itself, and the human being. 5. Joseph M. Juran Quality is fitness for use. 6. John S. Oakland Quality is meeting customer s requirements. 5
6 a common definition of quality. It is mainly related to the manufacturing, processes, and service industries: Meeting the customer s need Fitness for use Conforming to requirements 6
7 Quality in construction Quality is the fulfillment of project responsibilities in the delivery of products and services in a manner that meets or exceeds the stated requirements and expectations of the owner, design professional, and constructor. Responsibilities refer to the tasks that a participant is expected to perform to accomplish the project activities as specified by contractual agreement and applicable laws and licensing requirements, codes, prevailing industry standards, and regulatory guidelines. 7
8 Requirements are what a team member expects or needs to receive during and after his or her participation in a project. 8
9 Why quality in construction is different Quality of construction is more difficult to define. First of all, the product is usually not a repetitive unit but a unique piece of work with specific characteristics. Secondly, the needs to be satisfied include not only those of the client but also the expectations of the community into which the completed building will integrate. 9
10 Quality in construction Construction project quality is the fulfillment of the owner s needs per defined scope of works within a budget and specified schedule to satisfy the owner s/user s requirements. 10
11 Quality Inspection inspection is a specific examination, testing, and formal evaluation exercise and overall appraisal of a process, product, or service to ascertain if it conforms to established requirements. It involves measurements, tests, and gauges applied to certain characteristics in regard to an object or an activity. The results are usually compared to specified requirements and standards for determining whether the item or activity is in line with the target. Inspections are usually nondestructive. 11
12 Some of the nondestructive methods of inspection are Visual Liquid dyed(colored) penetrate Radiography Ultrasonic Thermography 12
13 Inspection accuracy Inspection accuracy depends on 1. Level of human error 2. Accuracy of the instruments 3. Completeness of the inspection planning Human errors in inspection are mainly due to Technique errors Inadvertent(not planned) errors Conscious errors Communication errors 13
14 Most construction projects specify that all the contracted works are subject to inspection by the owner/consultant/owner s representative 14
15 Quality Control Quality control as the process employed to consistently meet standards. The control process involves observing actual performances, comparing it with some standards, and then taking action if observed performance is significantly different from the standard. 15
16 Control involves a universal sequence of steps as follows: 1. Choose the control subject, that is, choose what we intend to regulate. 2. Establish measurement. 3 Establish standard of performance, product goal, and process goals. 4. Measure actual performance. 5. Compare actual measured performance against standards. 6. Take action on the difference. 16
17 Quality Control Tools The following are the most commonly used quality control tools for a variety of applications to improve the quality process: 1. Cause-and-effect diagram 2. Check sheet 3. Control chart 4. Data collection 5. Flow chart 17
18 6. Histogram 7. Pareto analysis 8. Pie chart 9. Run chart 10. Scatter diagram 18
19 Cause-and-effect The cause-and-effect diagram is also called an Ishikawa diagram or fishbone diagram. It is used to organize and graphically display multiple causes with a particular effect. Figure 1.4 illustrates an example of a cause-andeffect diagram for bad concrete (failure to comply with design concrete strength). 19
20 20
21 Check sheet A check sheet is a structured list, prepared from the collected data, to indicate how often each item occurs. Table 1.2 illustrates a Check sheet for approval record 21
22 22
23 Control chart The control chart is the fundamental tool of statistical process control. It is a graph used to analyze variation in a process. By comparing current data to historically determined lines, one can arrive at a conclusion regarding whether the process is stable or is being affected by special cause of variation. There are many types of control charts. Each is designed for a specific kind of process or data. 23
24 A control chart is employed to distinguish between the existence of a stable pattern of variation and the occurrence of an unstable pattern. Figure 1.5 illustrates sound level results of an audiovisual system. 24
25 25
26 Data collection Data collection objectives are to Identify the problem Report the problem Verify the problem Analyze the problem Correct the problem 26
27 Flowchart A flowchart is a pictorial tool that is used for representing a process in sequential order. Flowcharts can be applied at all stages of the project life cycle. Figure 1.6 illustrates a flowchart for concrete casting. 27
28 28
29 Histogram The histogram is a pictorial representation of a set of data. It is created by grouping measurements into cells, and it displays how often the different values occur. Figure 1.7 illustrates a histogram for manpower for a period of one month. 29
30 30
31 Pareto analysis Pareto analysis is a graphical representation of frequency of occurrence. Pareto charts are used to identify those factors that have the greatest cumulative effect on the system, and thus, less significant factors can be screened out from the process. Pareto analysis can be used at various stages in a quality improvement program to determine which step to take next. Figure 1.8 illustrates a Pareto chart for variation cost. 31
32 32
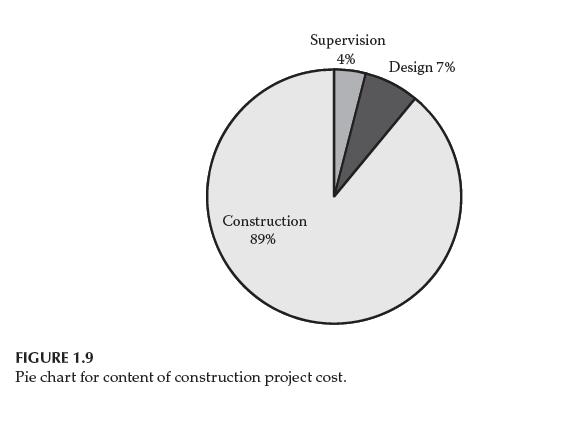
33 Pie chart The pie chart is a circle divided into wedges to depict proportion of data or information in order to understand how they make up the whole. The portions of entire circle or pie sum up to 100%. Figure 1.9 illustrates the contents of construction project cost. 33
34 34
35 Run chart The run chart is a graph plotted by showing measurement (data) against time. Run charts are used to know the trend or changes in the average and also to determine if the pattern can be attributed to common causes of variation, or if special causes of variation were present. Figure 1.10 illustrates a run chart for manpower at a site for a particular week. It is similar to the control chart but does not show control limits. 35
36 36
37 Scatter diagram The scatter diagram is a plot of one variable versus another. It is used to identify potential root cause of problems and to evaluate cause and-effect relationship. Figure 1.11 illustrates a scatter diagram for length versus height of rods. 37
38 38