SOUTH DAKOTA DEPARTMENT OF TRANSPORTATION
|
|
|
- Alexina Maxwell
- 5 years ago
- Views:
Transcription

1 SOUTH DAKOTA DEPARTMENT OF TRANSPORTATION PERFORMANCE MEASURE 2016 ANNUAL REPORT Per SDCL

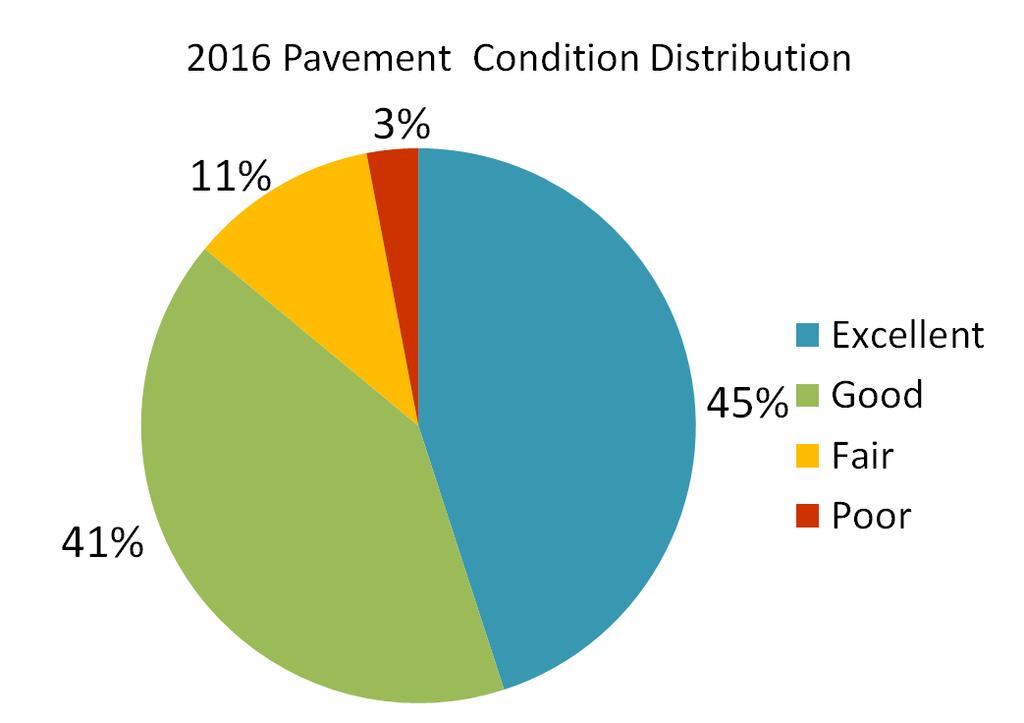
2 PAVEMENT CONDITION Leading up to and during the 2015 Legislative Session, the Department worked with the Legislature s summer study committee and the House and Senate Transportation Committees to establish long term targets for pavement conditions on South Dakota s state highway system. One of the primary purposes of identifying target goals was to determine the annual investment necessary to maintain pavements at the targeted conditions. While not officially adopted, there was general acceptance of the Department s proposed Target Pavement Condition shown in the chart below. Higher targets could have been suggested, but achievement of a higher level could result in the removal or improvement of pavements before the end of their useful service life. In order to maximize the return on investments of funds spent on our pavements, it is necessary to allow a portion of the state highway miles to naturally deteriorate to a condition rating below the good classification. In doing so, the Department can strive towards maximizing the useful service life of the pavement by using many different treatment options prior to the need for replacement or major rehabilitation. 2
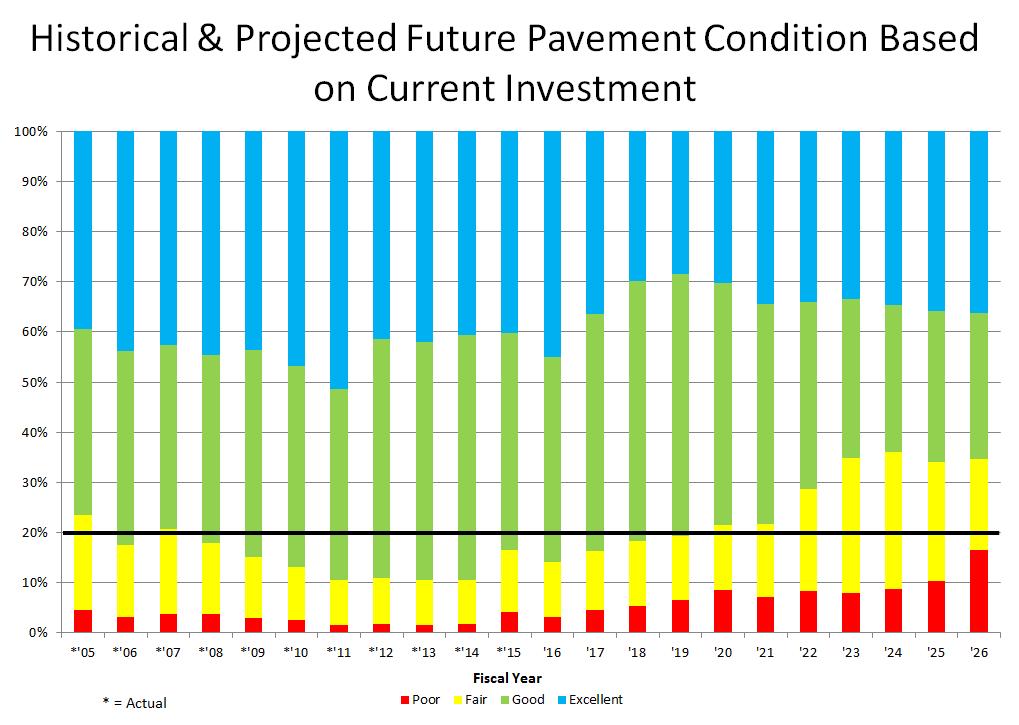
3 Protecting and maintaining the overall condition of our state highway system is one of the most important functions of the Department. The Department has over 8,800 roadway miles under its jurisdiction. The replacement value of these pavements is estimated at approximately $15 billion. To manage these pavements, the Department utilizes a sophisticated and objective, data-driven system to assist in maintaining our pavements in the most efficient manner possible. By looking at the current and future condition levels, the Department is able to annually review its investment plan and make recommended modifications to the Statewide Transportation Improvement Program (STIP), which is reviewed and approved by the South Dakota Transportation Commission. With over 8,800 roadway miles on the state system, projected significant changes and future pavement conditions require a long term investment plan and a significant financial commitment. If, for example, the Department were to manage pavements on a reconstruction basis only and invest only in pavements, it would take a minimum of 37 years to reconstruct the state highway system (this would not include reconstruction of bridges). Since the design life of a pavement varies depending on type, the investment strategy of only reconstructing pavements would result in a poorly maintained highway system. In addition, limited highway funds would be inefficiently used. Instead, the Department attempts to use the right treatment at the right time to maximize use of our highway funds and get the most benefit from the investments spent on our facilities. One tool used to collect objective pavement data annually is the spider van. The van travels at near highway speed and collects thousands of data points from each square inch of pavement. These pavement surveys are performed for nearly every mile of state highway and are done on an annual basis. This data, along with historical information of the roadway layers and projected performance curves, is used to create a projected condition for each segment. The current and projected conditions can then be reported and tracked. This data shows the percentage of the state system that would be in any particular condition range in various years, thereby allowing the Department to modify its investment plan to achieve the highest rate of return targets. Like any asset, pavements are most economically maintained when they are in relatively good condition. As the overall condition of the system degrades, investment opportunities become limited and much more costly. By maintaining the system in relatively good condition, a wide variety of cost effective treatments are available. At the time of the passage of Senate Bill 1, with uncertainty as to the future of federal highway funding, it was understood the additional state funding alone would not be sufficient to maintain pavements at target levels for the long term. However, due to the combination of existing conditions exceeding target levels plus the additional funding to be realized from the federal aid program and additional state funds into the state highway fund, it is anticipated the decline of our pavement conditions will significantly slow as these funds are directed to pavements. The current condition of our state highway system pavements slightly exceeds the target levels as discussed above. The following graphs, which are from reports generated using the Department s pavement management system and associated data, reflect the historic and forecasted pavement conditions. 3
4 4
5 BRIDGE CONDITION The Department has historically maintained a philosophy that preservation of our bridges is a high priority and thus, investing as required to ensure they remained in good condition. The overall condition of our bridges, as measured by a structure health rating, continues to be high. Projections indicate that this trend will continue as investment in structures will continue to be a priority. Over the course of the last several years the Department has reported the condition of our structures as Structure Health Index as indicated in figure 4. The national reporting requirements of structures are changing. With the newly collected data, reporting will change to reflect the percentage of structures in good, fair, or poor condition. The Department has set a goal to maintain 95% state owned structures on the National Bridge Inventory in good or fair condition. The graph below shows the past status and future expectations on this goal based on current and anticipated investment levels. 5
6 Reported conditions on state highway structure conditions are based on reports prepared utilizing data contained in the Department s AASHTOWare Bridge Management program. 6
7 HIGHWAY SAFETY Working with our partners at the Department of Public Safety, Highway Patrol and Office of Highway Safety, in 2013 the Department established a goal of reducing fatal and incapacitating injury crashes by 20% by Since 93% of accidents involve some driver behavioral elements, there is not a direct correlation between these performance measures and the Department s efforts at maintaining our roads and bridges in a safe condition. However, the safety of travelers is important enough that it warrants tracking to ensure the partnership effort required to impact the measure is working effectively. The most common fatal crash in South Dakota is a single vehicle, single occupant crash resulting from the vehicle leaving the roadway and rolling. The two biggest contributors to these fatalities are alcohol and seatbelt use. As of September 26th, there had been 75 fatal crashes in South Dakota resulting in 86 fatalities (down 10% from 2015). Of the fatalities, 69% involved unbelted occupants while in 3.4% seatbelt use was unknown. Only 16 fatalities involved belted occupants. Alcohol was involved in 37 (up 15.6% from 2015) of the fatalities. Highway fatal crashes decreased to 116 in 2015, down 9 crashes or 7.2% from South Dakota s fatality rate per 100 million vehicle miles traveled has been trending downward over the long term. In 7
8 2015 it was 2.12, down from 2.22 in 2005, but still almost twice the national average of 1.08 in 2014, the latest figure available. All data regarding highway crashes is derived from data compiled by the Department of Public Safety s Office of Accident Records ( 8
9 CUSTOMER SATISFACTION The Department periodically conducts comprehensive Customer Satisfaction surveys. The surveys measure public satisfaction with a large variety of the services the Department provides for the traveling public. The results from these surveys help measure the Department s performance as perceived by its customers and users of the state highway system. In addition, results from the survey also assist with determining customer priorities, influencing the Department s investment strategies to help meet the highest priorities for the traveling public. 9
10 One of the most important services provided by the Department for travelers is winter maintenance activities (i.e. snowplowing). Outside of highway construction/maintenance costs, this is one of the areas of highest investment of state highway funds. As can be seen from historic results from past customer satisfaction surveys, the public s satisfaction with winter maintenance activities varies significantly from year to year. It is difficult to correlate these results with any particular factor, as the Department s winter maintenance activities have not changed significantly in recent years in terms of hours or operation or numbers of available snowplow operators and equipment. 10
11 One new addition to the last two customer satisfaction surveys was the gathering of specific information from contractors to help gauge the working the relationship between the Department and its highway construction partners in the contracting industry. The results obtained from the most recent survey were disappointing and unexpected. Over the last few years, the Department has worked closely with the Associated General Contractors (AGC) and its members on attempting to improve the existing working relationship and find ways to strengthen the partnership effort to most effectively and efficiently complete highway construction projects in a safe and cost effective manner while ensuring a high quality finished product. As a result of the recent survey results, the Department will need to explore with AGC to identify additional opportunities to improve this score in the future. The full results from the Department s most recent Customer Satisfaction Survey can be accessed at link: 11
12 WORKFORCE DEVELOPMENT Recruiting and retaining a high quality workforce is essential to the Department s success and ability to achieve any of the established strategic goals. With the highly technical nature of our work, it s imperative that we can recruit and retain high quality employees. Although recruitment of high quality employees is important, for many job classifications it takes a significant amount of time to train the new employee before they can begin making a significant contribution to the Department s overall performance. Therefore, retaining those new employees through the initial employment period is critical in developing a high quality workforce. The Department recently established a new goal of retaining more than 85% of all new hires for the first 18 months. Studies have shown that 98% of new employees make the decision to stay with the organization within the first year. Further data indicates that 43% of new employees leave within the first 18 months, but with a formal onboarding program this number can be reduced to 18%. New employee onboarding is described as a comprehensive approach to bringing on new hires that goes beyond simple orientation. Onboarding plans are intended to make new employees familiar with the overall goals of a company and support them as they embark on early projects all in an effort to achieve the perception of success (and productivity) quickly. The ultimate payoff is to reduce turnover and encourage workers to stay with an organization for a longer tenure. Due to the importance of this issue, the Department has in place a number of ongoing programs to help new employees be successful and comfortable in the Department, hopefully increase the likelihood of them remaining long term employees. These programs include: New employee orientation New employee onboarding program Engineer-in-training program Formal mentoring program for selected employees Comparative data is not yet available on this measure. The first set of data gathered shows that in FY2015, 82.25% of our new hires were still employed with the Department after 18 months. In addition to employee engagement, recruitment, retention and workforce development, the Department encourages a culture of safety while employees are performing their job duties. Simply recruiting and retaining a high quality workforce is not enough if those employees are off the job due to work related injuries. One of the measures we track for monitoring our safety performance is lost time injury rate. Lost time is any time away from work regardless of length of time. The rate is based on injuries per 100 employees and has been relatively flat for the last three years. Our overall goal is 3.83 for December This calculation method is a standard way of measuring and allows us to benchmark with other states. 12
13 Data supplied by the Bureau of Human Resources. The Department tracks and monitors numerous other performance indicators. More information can be found by viewing the following link: 13