The Growth Initiative Value Tools and the Ultimate Report Card. Smokey Garrett
|
|
|
- Job Leonard
- 5 years ago
- Views:
Transcription
1 The Growth Initiative Value Tools and the Ultimate Report Card Smokey Garrett
2 Smokey Garrett Arlington, Texas Regional Director, Operating Principal of Multiple Market Centers 2
3 Tell Keller Williams University what you think! Simply enter into any mobile device to complete your evaluation for this session. 3

4 The Four Conversations 4
5 The Wall of Value The Wall of Value works two ways The Wall of Value works two ways: if you do show value, the wall is like a fortress that protects your net and your profitability. If you are not showing value, the wall actually works against you it repels net and repels profit. 5


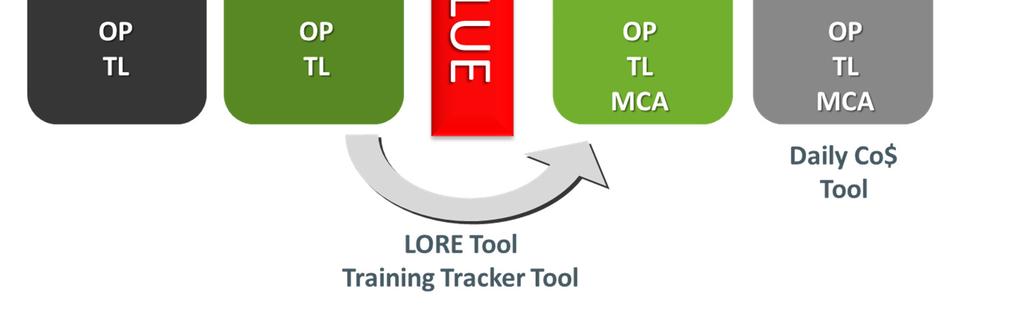
6 The Growth Initiative Tools 6


7 Value Tools Trend Tool Measures Market Center performance over time relative to itself, the local market, the Region, and KWRI. The Language of Real Estate (LORE) Attracts Cappers by providing evidence that your Market Center helps associates businesses. Training and Tracking (T 2 ) Demonstrates how Market Center training increases associate productivity. 7
8 Trend Tool YOU ARE HERE 8
9 Trend Tool Overview The value the Market Center has provided agents in the last 90 days What the next 90 days are going to look like for the agents and the Market Center Where the Market Center needs to focus now to improve those results for the agents and the Market Center in the next 90 days 9


10 What is the Trend Tool? The Multi-Year Trend tool tracks monthly performance for 41 metrics. Some are report cards for the past 90 days. Some are vision tools for the next 90 days. Combine with Cap Management, Gross Goals worksheet, and Pipeline tool to tie recruiting activities to performance. 10
11 Trend Categories 1. Total Agent Count 2. Recruiting Appointments 3. Gross Agent Gain 4. Net Agents 5. Closed Units 6. Closed Units per Agent 7. Closed Sales Volume 8. Sales Volume per Agent 9. Listings Taken 10. Listings Taken Volume 11. Listings Sold 12. Listings Sold Volume 13. Contracts Written 14. Contracts Written Volume 15. Closed GCI 16. GCI % of Closed Sales Volume 17. GCI per Closed Unit 18. GCI per Agent 19. Average Sale Price 20. Paid on Volume 11
12 Trend Categories (cont.) POV % of Closed Sales Volume 22. POV per Agent 23. Company Dollar ( Co$ ) 24. Co$ percentage of GCI 25. Co$ per Unit 26. Co$ per Agent 27. Approved Expenses 28. Expense % of GCI 29. Expense % of Co$ 30. Expense per Unit 31. Expense per Agent 32. Owner Profits 33. Profit % of GCI 34. Profit % of Co$ 35. Profit per Unit 36. Profit per Agent 37. Royalties 38. Royalties % of GCI 39. Royalties per Unit 40. Royalties per Agent 41. Profit Share

13 Multi-Year Trends Tool (Sample) 13
14 How Do We Use the Trend Tool? 1. Compare the numbers 2. Share the numbers 3. Grow the numbers 14
15 First Compare Compare your Market Center s numbers to: Your Region Keller Williams Realty as a whole 15
16 Then Share Share the results at: Staff meetings Team meetings ALC meetings Market Center investor group meetings 16
17 Grow the Numbers Points to consider 1. How do our numbers compare to last month? Last year? Why? 2. How do our numbers compare to the Region s? Keller Williams Realty s? Why? 3. What are the report card metrics for the last 90 days? 4. What are the vision metrics for the next 90 days? 5. What does this tell us we need to do differently? 6. How does this match up with our Cap Management, Gross Goals, and Pipeline strategies? Do we need to make adjustments? 7. Which of these numbers are value stories/opportunities we can share? 17
18 Truth: It s units, not volume! 18
19 Language of Real Estate YOU ARE HERE 19
20 LORE Overview An appointment setting and conversion tool that provides evidence that the Keller Williams value proposition will help a recruit grow their business. A focus tool that points out where the Market Center should focus its training efforts. 20
21 What Is the LORE? Answer: A monthly report that shows how your Market Center is doing for eight key numbers in our industry. 21
22 LORE Eight Key Metrics 1. Closed Units 2. Closed Sales Volume 3. Listings Taken 4. Listings Taken Volume 5. Listings Sold 6. Listings Sold Volume 7. Contracts Written 8. Contracts Written Volume 22
23 How Do We Use LORE? 1. The Value the story we can share externally about the successes our agents are experiencing 2. The Opportunity the story about how we can improve the successes our agents are experiencing 23
24 Truth: Top producers speak a different language from other agents; it s the language of numbers. 24
25 Truth: LORE is about creating curiosity. 25
26 LORE Preparation Four Steps 1. Find the month-over-month change from your MLS or Board of Realtors. 2. Find the month-over-month change from your Multi-Year Trends report. 3. Find the difference between your Board and your Market Center. 4. Develop your talking points. 26


27 LORE in Recruiting 1. What are you doing in your Market Center that is leading to such dramatically different results for your agents? 2. How can I be a part of it! 27

28 Quality and Quantity You have to recruit Cappers to do Cap Management. LORE gives you something powerful to say to set appointments with Cappers. LORE gives you a reason to talk with top talent every month. 28
29 Tell Everyone On recruiting calls In recruiting appointments On social media sites On a wall in your Market Center (training room, TL s office, etc.) At Market Center sales meetings At Market Center staff meetings At Market Center investor meetings 29
30 Truth: By focusing on the top agents and using LORE, you will automatically attract other Cappers/agents! 30
31 LORE in Your Market Center Gives the Team Leader confidence Evidence creates curiosity in the minds of recruits Market Center leaders understand their business Investors understand financial health and how to help Associates become local real estate economists Director of First Impressions has a great script Indicates where to focus your training calendar Increases retention associates get engaged 31
32 Training Tracking YOU ARE HERE 32
33 Training Tracking Overview A standards and expectations setting tool about the training your agents will attend An attendance booster for your training A recruiting tool to provide evidence of benefit for our training A retention tool for agents who understand the value Keller Williams provides 33
34 What Is T 2? 1. The Value the story we can share externally about the successes our agents are experiencing 2. The Opportunity the story about how we can improve the successes our agents are experiencing 34
35 Truth: Everybody wants to be counted! 35
36 Step 1: Implement Training (cont.) Each month your training calendar should include: One major Keller Williams training event each week An Ignite session every single day (follow the course format!) Dynamic, eventful team meeting each month with a powerful training moment An ALC meeting each month with a training component for top producers (attracts other associates as well) 36
37 Step 1: Implement Training Reasons for low attendance 1. The training being offered doesn t show value 2. Agents don t see the value How can we fix this? 1. Market Center leadership, investors, and ALC review training calendar. 2. How is our current training calendar driving (or not) the results we seek? 3. What are we going to do differently? 37
38 Truth: It s not build it and they will come, but rather provide and prove value, and they will come. 38
39 Step 2: Take Attendance KWRI training (Mega Camp, Family Reunion, etc.) KW MAPS Coaching Keller Williams Regional KWU training Market Center KWU training (including Market Center team meeting and ALC meeting) 39
40 Step 3: Convert to a Spreadsheet 1. Create a spreadsheet accounting for each KWU Market Center training and event held. 2. Track each associate s attendance using sign-up sheets. 40
41 41 Training Tracking Spreadsheet (Sample) Ignite 1 Ignite 2 Ignite 3 Ignite 4 Ignite 5 Ignite 6 Ignite 7 Ignite 8 Ignite 9 Ignite 10 Ignite 11 Ignite 12 Ignite 13 Ignite 14 Ignite 15 Ignite 16 Ignite 17 Ignite 18 Ignite 19 Ignite 20 Ignite 21 TLAW 1 TLAW 2 TLAW 3 TLAW 4 Tech 1.0 Tech 2.0 Tech 3.0 Tech 4.0 Dual Career Listing Presenation Winning in a low inventory How to write a solid contract Sell more listings Meet n Greet Team Meeting ALC Meeting Committee Meetings Total Classes attended Roster Mega Mary Buyer Bonnie Seller Sally Rookie Robert Techy Tommy Dual Donnie
42 Step 4: Pull the Numbers 1. MCA creates productivity comparison of GCI and/or closed units for two groups: a. Those who attended at least two training classes per month b. Those who didn t 2. After 90 days, a clear pattern of productivity will emerge. 42
43 Step 5: Communicate the Numbers Social media 33 Touches Recruiting calls Recruiting appointments And any other way you or your agents communicate with other agents! 43
44 Truth: It s a growth process. 44
45 Questions to Consider 1. Are classes growing faster than agent count growth? 2. What does our attendance tell us about the effectiveness of our training? 3. Does our messaging around training prove value? 4. Is our training action based? 5. Do we have training for all levels? 6. Does our training highlight the benefit of being with KW? 7. Are our trainers both credible AND great trainers? 8. Do our trainers teach the materials and not war stories? 9. Is training focused on opportunities identified by LORE and the Trend tool? 45
46 Daily Company Dollar Tool YOU ARE HERE 46
47 Daily Co.$ Overview A vision tool See how Co.$ is growing and predict where you might end up at the end of the month. Focus on fixing issues with transactions to retain associates and commissions. Visibility into what is impacting Co.$ and what adjustments should be made. 47
48 Question: When do we as business owners turn profitable in any given month? 48
49 What Is the Daily Co.$? DAILY COMPANY $ TOOL 5/6/2014 $14, TOTAL RECEIVED $60, OUTSTANDING PENDING TO CLOSE $75, BEST CASE $62, FALLOUT EST 20% PROJECTION $52, LAST YEAR $83, GOAL 49
50 What Is the Daily Co.$? (cont.) Total Transactions closed, entered in system, and Co.$ deposited Outstanding Co.$ for transactions projected to close in the current month Best Case Total plus 100 percent of Outstanding Co.$ Fallout Total plus 80 percent of Outstanding Co.$ to account for transactions that will not close. (You can change the formula to represent your numbers.) Last Year Last year s Co.$ for the same period Goal Co.$ that was budgeted for the period 50
51 Truth: The Daily Co.$ allows you to see the BIG picture of what s happening with the revenue, so you can then drill down and find out why. 51
52 How Do We Use the Daily Co.$? What is our expense need this month? What is our goal for Break-even Day? What day are we actually tracking toward right now? Is Break-even Day is getting earlier or later from month to month? If earlier, what are we doing that is leading to this? How can we improve on that? If later, is this a training issue, recruiting issue, or both? Is our fallout percentage decreasing or increasing? Why? 52
53 Truth: The Growth Initiative tools work together as one thought process to grow your Market Center! 53
54 Thank You! Please complete an evaluation for this session. Use any mobile device! To download a free copy of this presentation: