2014 NWPMA Conference
|
|
|
- Roger Stevenson
- 5 years ago
- Views:
Transcription

1 2014 NWPMA Conference Asset Management The Big Picture Factors contributing to asset management Status of asset management in state DOTs Current TAM initiatives Future trends Presented By: Katie Zimmerman, P.E., Applied Pavement Technology, Inc.


2 Factors Impacting Transportation Agencies

3 The Times They Are a Changin More focus on preserving existing assets Targeted efforts to improve agency efficiency & effectiveness New legislation supporting performance- based decisions Circa 1964
4 Agencies Have Adopted TAM Principles 1 POLICY DRIVEN 2 PERFORMANCE-BASED 3 EVALUATES OPTIONS 4 DATA DRIVEN 5 TRANSPARENT
5 TAM Helps Manage Assets Effectively Tradeoff Analysis Policy Goals & Objectives Budgets Expectations Goals & Investments Are Aligned With Performance Data Resource Allocations Performance Monitoring Improvement Programs & Delivery
6 MAP- 21 State Performance Management- (1) IN GENERAL- A State shall develop a risk- based asset management plan for the National Highway System to improve or preserve the condition of the assets and the performance of the system.
7 MAP- 21 (cont) (4) PLAN CONTENTS- A State asset management plan shall, at a minimum, be in a form that the Secretary determines to be appropriate and include- - (A) a summary listing of the pavement and bridge assets on the National Highway System in the State, including a description of the condition of those assets; (B) asset management objectives and measures; (C) performance gap identification; (D) lifecycle cost and risk management analysis; (E) a financial plan; and (F) investment strategies.

8 MAP- 21 National Goal Areas Safety Infrastructure Condition Congestion Reduction System Reliability Freight Movement & Economic Vitality Environmental Sustainability Reduced Project Delivery Delays
9 Other MAP- 21 TAM Requirements Minimum standards for States to use in developing and operating bridge & pavement management systems Measures for States to use to assess the condition & performance of pavements on the Interstate & NHS Minimum service levels for the condition of pavement on the Interstate system Minimum service levels of no more than 10% of the total bridge deck area on the NHS classified as structurally deficient
10 Asset Management Implementation in the States
11 General Observations (NCHRP Synthesis 439) Organization - 60% of respondents had an asset management group Data In addition to pavements, 70 to 90% collected data on signs, guardrail, culverts, & lighting Decision Making Still focused primarily on pavements & bridges, formal consideration of risk is rare Documentation Few agencies in 2013 had developed Asset Management Plans
12 Completed Inventories (From NCHRP Synthesis 439) Pavements & bridges 100% Signs 77% Guardrail 63% Culverts 60% Roadway lighting 49% Pavement markings 33% Earth retaining walls 27%

13 Status of Asset Management (2013)
14 TAMP Status (2013) Today, draft TAMPS can be found on the FHWA website for Colorado, Georgia, Minnesota, New York State, Pennsylvania, Utah, and Wyoming DOTs (see plans.cfm)
15 Current TAM Initiatives Gap Analysis Target Setting Life Cycle Assessments Risk Management Financial Sustainability
16 Gap Analysis
17 Gap Analysis Where are you today? Where do you want to be? What gaps exist between the two?

18 Gap Analysis Rating Areas

19 Comparing to Best Practice Example: Agency policies encourage a business- oriented, customer- focused approach to asset management Current rating? Desired rating? Initial Stages Best Practice
20 Outputs Identify Gaps in Practice Small Gap Large Gap

21 Gaps Inform Your Implementation Plan (taken from the Colorado DOT Draft TAMP)

22 Sample Implementation Plan Content (taken from the Colorado DOT Draft TAMP)

23 Gap Analysis Tool Microsoft Excel platform with form- based user interface Dual workbook approach Master workbook used to create surveys, manage data, & view results Rater survey workbook used by individual raters to rate assigned criteria


24 Rater Survey Each survey group rating sheet includes only the criteria selected for that group Criteria can be included in as many survey groups as desired

25 Rater Surveys With Status Bars

26 Import Survey Screen

27 Results Groups


28 Assessing Results Graphs Spider Charts Export Tables
29 User s Guide Survey Setup Helps evaluate what portions of the survey should be sent to each group Assessment Areas Elements This Element Evaluates: At a Minimum, Send This Element to These Groups: 1: Policy Goals and Objectives 1.a. Goals and Objectives 1. b. Agency Policies The extent to which agency goals & objectives are based on quality data, are monitored, and are aligned with good asset management practices The existence and use of policies supporting asset management practices Executive leadership Asset managers Asset management Policy Performance measurement Same as 1.a.plus: Planning and programming Finance
30 User s Guide Assistance - Results Assessment Area Elements Included Improvements to Consider Helpful Resources Policy Goals and Objectives Goals and Objectives Agency Policies Review the process used to establish agency goals and look for ways to better incorporate asset management practices Evaluate whether performance measures are tied to agency objectives Establish an asset management policy Chapter 2, AASHTO Transportation Asset Management Guide A Focus on Implementation National Highway Institute (NHI) Course A, An Introduction to Transportation Asset Management Asset Management Practices TAM Framework Leadership Support for TAM Asset Management Plan Development Lifecycle Management Document existing business processes and look for areas of improvement Confirm agency objectives for asset management Establish links between asset management and executive leadership Prepare/update an asset management plan Identify strategies for accounting for maintenance trade-offs associated with capital investments AASHTO Transportation Asset Management Guide A Focus on Implementation National Highway Institute (NHI) Course A, An Introduction to Transportation Asset Management NHI Course B, Developing a Transportation Asset Management Plan FHWA Asset Management Website (
31 Distribution Through AASHTO Excel Spreadsheet User s Guide Quick Setup Guide Reference Files
32 Target Setting

33 Setting Performance Targets

34 Life Cycle Assessments Initial Costs

35 What is a Life- Cycle Assessment? Analytical technique used to assess total cost of asset ownership associated with construction, inspection, maintenance, and disposal
36 Concept Transport Scotland
37 Concept Transport Scotland
38 Concept Transport Scotland
.")
39 Pavement Life Cycle Results Agency s current policy saves approximately $17 Billion when compared to the worst- first strategy (over entire inventory). The desired strategy will result in savings of approximately $600 million over the current strategy (over entire inventory).

40 Risk Management Risk is the effect of uncertainty on objectives (ISO) Risk management is a systematic process to identify risks that may impact agency objectives, to analyze their consequences, and to develop ongoing measures to address them (Adapted from New South Wales Government Asset Management Committee)
41 Risk Management Steps Set Context Identify Analyze Evaluate Address Monitor
42 Types of Risk Enterprise Risk Agency Risk Affects the agency s ability to accomplish the its mission and achieve strategic goals Owned by Chief Executive Program Risk Affects the agency s ability to achieve program objectives Owned by Program Manager Project Risk Affects the successful accomplishment of project objectives Owned by Project Manager
43 Types of Risk Risk Type Financial Risk Information Risk Considerations Is future funding adequate to achieve our targets? What is the impact of inflation on our purchasing power? Do we have tools to predict and manage asset conditions for the next 10 years? Asset Risk Are key assets such as poor- performing pavements or bridges a continuing risk to asset management targets? Are specific functional classes particularly vulnerable? Operational Risk Decision Risk Is our project delivery mechanism reliable enough to meet our asset condition performance targets? Do we have a sound preventive maintenance program? Do we have sound contracting mechanisms to ensure material and construction quality? Does our project selection process identify appropriate candidates and treatments? Climate Risk Will increased climate- related events have a noticeable impact on asset conditions or level of service? Source: FHWA/AASHTO Webinar on Approaches to Integrating Risk into TAM Programs and Plans
44 Identify Risk Statements Consists of a defined event and its impact Represents one risk event Helps analyze likelihood and impact Example: If (RISK EVENT) happens then (CONSEQUENCE) will happen to (WHAT OR WHOM), causing (RESULT).
45 Analyzing Risk Likelihood of event Consequence of event High Consequence Medium Low High Medium Low Likelihood High
46 Establish Risk Likelihood Ratings Ranking Likelihood Frequency Score Very High or Almost Certain Near Certainty (90%) Likely to occur within the year 5 High or Likely Highly Likely (70%) Likely to occur within 2 years 4 Moderate Likely (50%) Likely to occur within 3 to 5 years 3 Low or Unlikely Unlikely (20-30%) Likely to occur within 6 to 10 years 2 Very Low or Rare Remote (10%) Not likely to occur for 10 or more years 1
47 Establish Risk Consequence Ratings Consequence Score Catastrophic Impact on System Performance 5 High/Large Impact on System Performance 4 Moderate/Noticeable Impacts on System Performance 3 Low/Some Noticeable Impacts on System Performance 2 Insignificant/Little Noticeable Impacts on System Performance 1
48 Risk Consequence: Asset Value & Economic Impact Factors/Considerations Score Greater than 50% of the budget controlled at the decision level 5 30% to 50% of the budget controlled at the decision level 4 15% to 30% of the budget controlled at the decision level 3 5% to 15% of the budget controlled at the decision level 2 Less than 5% of the budget controlled at the decision level 1
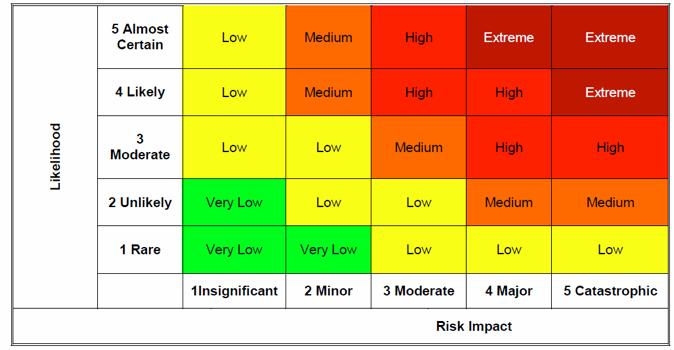
49 Risk Map
50 Risk Mitigation Strategies Terminate Transfer Treat Tolerate Take Advantage Eliminate threat posed by the risk Shift risk to third party Take steps to reduce probability and/or impact of risk Deal with the risk, monitor it, lack of options due to Opportunity External funding or partnership

51 Example NY State DOT
52 Risk Can Be Used To: Set priorities Assign resources Improve communication with stakeholders Increase the likelihood of organizational success Reduce agency liability
53 Financial Sustainability
54 Financial Sustainability Investing at levels equal to annual depreciation Investment Level Annual Depreciation
55 Future Trends
56 Future Trends It is important to have strong leadership and a clear strategy in place Executives have to facilitate the organizational change needed to support a data- driven culture MAP- 21 is helping to provide a reason for making the change Have to think of asset management as more than just tracking pavement and bridge condition
57 Future Trends Executive leadership is very outward focused Managing the flow of goods and service for economic development Addressing quality of life issues Technical staff are very inwardly focused Need better links between these levels and better ways of telling the story Historic funding allocations will not exist in the future. Funding has to be more aligned with shifts in system use.
58 Future Trends The role of transportation agencies is evolving to include serving as a facilitator (or server) of information so users can decide how they will use the system Miami Dade County Transit access to service information vs service levels Successful agencies will figure out how to use data to put trends and indicators in customer s hands.
59 Future Trends Data and information have to be managed as an asset that has value Data must be market- oriented vs. system oriented decisions based on functionality and value of the link What is the dollar volume carried on the system? What is the target level for the lowest cost of ownership? Model is changing from a DOT- driven conversation to a customer- driven conversation
60 Pavement Management Is Key to TAM Tradeoff Analysis Policy Goals & Objectives Budgets Expectations Performance Monitoring Resource Allocations Improvement Programs & Delivery

61 Future Areas of Focus
62 Research Initiatives Underway Cross- asset optimization (NCHRP) TAMP templates and pilots (FHWA/NCHRP) Workforce development & skill building (FHWA/AASHTO) Risk- Based Asset Management Guidelines (NCHRP) Financial Sustainability Guidance (FHWA)

63 Resources Available FHWA Website FHWA/AASHTO Asset Management Webinar Series


64 Questions? Katie Zimmerman at: (217)