City of Hamilton Annual. Employment Survey 2016 AND 2017 TABLES AND CHARTS
|
|
|
- Josephine Summers
- 5 years ago
- Views:
Transcription

1 City of Hamilton Annual Employment Survey 2016 AND 2017 TABLES AND CHARTS
2 Table of Contents KEY HIGHLIGHTS... 2 CITY-WIDE EMPLOYMENT... 4 EMPLOYMENT BY AREA... 9 HAMILTON URBAN GROWTH AREA... 9 EMPLOYMENT LAND AREAS...12 POPULATION-RELATED EMPLOYMENT...20 EMPLOYMENT BY CITY OF HAMILTON S SIX COMMUNITIES...22 EMPLOYMENT DENSITY...31 MAP...33 EMPLOYMENT SURVEY NOTES...34 INDEX...37
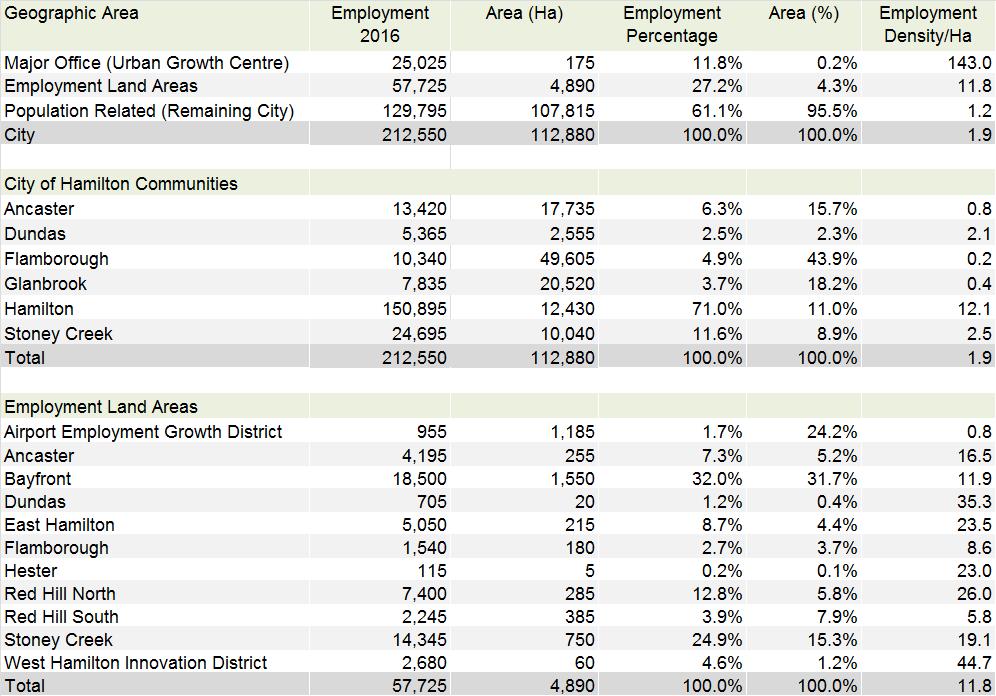
3 KEY HIGHLIGHTS The City of Hamilton s 2017 employment survey reported a total of 215,850 jobs in the City of Hamilton. This is an increase of 1.5% or 3,325 jobs from the previous 2016 employment survey, which reported 212,555 jobs. 62% or 134,645 of these jobs are full time, 30% or 63,845 of them are part time jobs, and the remaining 8% or 17,360 jobs are seasonal employment (2017). The work activity percentage proportions in 2017 were similar to those in In 2017, the largest industry category, at 17.8% or 38,355 jobs was in the health care and social assistance sector. This was also the largest job sector in the 2016 employment survey, consisting of 18.2% or 38,790 jobs. The educational services (13.2%), retail trade (13.1%) and manufacturing (12.5%) sectors were made up of 83,690 jobs and were consequently the next three largest industry sectors based on the 2017 employment survey. These same sectors made up 81,430 jobs in 2016, an increase of 2.7% or 2,260 jobs between 2016 and The accommodation and food services sector increased by 2,425 jobs, to 19,285 in 2017, up from 16,860 in This is the greatest increase in any industrial sector with respect to the number of overall jobs in the City. Of the 20 industrial sectors, 11 sectors experienced a combined loss of 4,315 jobs from 2016; compared to 9 industrial sectors which grew by 7,640 combined jobs, for a net increase of 3,325. Less than 1% of all businesses with 500 or more employees made up 22% of all jobs, whereas the majority, or 45% of all businesses with 1 to 4 employees, made up 6% of all jobs. In Hamilton s Urban Growth Centre there was an increase of over 300 jobs in 2017, up from 25,025 jobs in the 2016 annual employment survey. Hamilton s Urban Growth Centre s 25,350 jobs represent a 12% share of the City s overall employment. The proportion of full time, part time and seasonal employment work activity in the Hamilton s Urban Growth Centre remained relatively stable. The majority, or 69% of all jobs were full time, while a quarter of them were part-time, and the remaining 5% were seasonal. Employment in the City s Employment Land Areas remained comparably stable with 57,555 jobs in This area experienced a small decline of 170 jobs from 57,725 in Employment in the Employment Land Areas represented 27% of the overall City employment. 2 P age
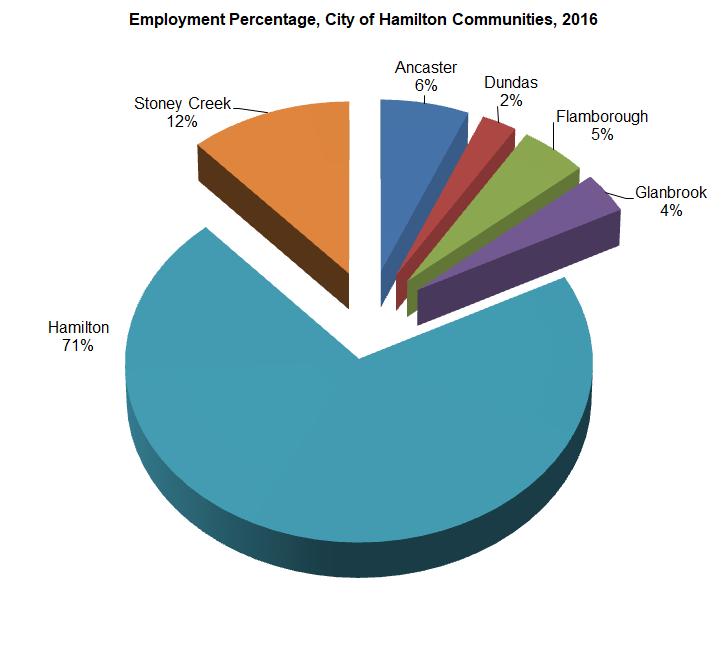
4 Population related employment, that is, employment which falls outside of Hamilton s Urban Growth Centre and Employment Land Areas represented 62% or 132,945 of overall employment in the City in The Community of Hamilton had the largest employment with 71% of all jobs, followed by the Community of Stoney Creek with 11%, the Community of Ancaster with 6%, the Community of Flamborough with 5%, the Community of Glanbrook with 4%, and the Community of Dundas with 3%. 3 P age

5 CITY-WIDE EMPLOYMENT Table 1 Chart 1 4 P age

6 Table 2A Table 2B 5 P age
7 Chart 2A Chart 2B 6 P age

8 Chart 3A Chart 3B 7 P age
9 Chart 4 Employment and Business Counts by Business Size, City of Hamilton, P age
10 EMPLOYMENT BY AREA HAMILTON URBAN GROWTH AREA Table 3A Chart 5A 9 P age

11 Table 3B Chart 5B 10 P age

12 Chart 6 Employment and Business Counts by Business Size, Hamilton Urban Growth Centre, P age

13 EMPLOYMENT LAND AREAS Table 4A 12 P age
14 Table 4B 13 P age

15 Table 5A 14 P age

16 Table 5B 15 P age
17 Chart 7 Employment By Industry, by Employment Lands Areas, P age
18 Chart 7 Employment by Industry, by Employment Lands Areas, 2017 continued 17 P age

19 Chart 8 City of Hamilton Annual Employment Survey 2016 and 2017 Tables and Charts Chart 9 Employment and Business Counts by Business Size, Total Employment Land Areas, P age

20 Chart 10 A Chart 10B 19 P age


21 POPULATION-RELATED EMPLOYMENT Table 6 Chart 11 Employment Percentage by Industry, Population-Related Employment, P age
22 Chart 12 City of Hamilton Annual Employment Survey 2016 and 2017 Tables and Charts Chart 13 Employment and Business Counts by Business Size, Population-Related Employment, P age

23 EMPLOYMENT BY CITY OF HAMILTON S SIX COMMUNITIES Table 7A 22 P age
24 Table 7B 23 P age
25 Chart 14A Employmet by Industry, by City of Hamilton s Six Communities, P age
26 Chart 14B Employmet by Industry, by City of Hamilton s Six Communities, P age

27 Table 8A 26 P age

28 Table 8B 27 P age

29 Chart 15A Chart 15B 28 P age


30 Chart 16 Employment and Business Counts by Business Size, by City of Hamilton s Six Communities, 2017 Ancaster Dundas Flamborough 29 P age


31 Chart 16 continued. Employment and Business Counts by Business Size, by City of Hamilton s Six Communities, 2017 Glanbrook Hamilton Stoney Creek 30 P age

32 EMPLOYMENT DENSITY Table 9A Employment Density by Geographic Area, 2017 Table 9B Employment Density by Geographic Area, P age
33 32 P age


34 MAP City of Hamilton Annual Employment Survey 2016 and 2017 Tables and Charts City of Hamilton, Hamilton Urban Growth Centre, Employment Land Areas and Communities Legend Hamilton Urban Growth Centre 33 P age
35 City of Hamilton Annual Employment Survey, 2016 and 2017 EMPLOYMENT SURVEY NOTES 1. All figures contained in the charts, and tables are derived from data records (business counts) where employment values are greater than The employment values reflect only those businesses which have completed the survey, either in person, by phone, on-line or via in 2016 or Business refers to the location at which employment was collected. Where a business has more than one location within the City, attempts are made to obtain the employment for each location separately. The better the representation as to where employment occurs the better the employment density calculations. This is not always possible and in these instances, all employment is assigned to the primary location. For the purpose of this survey and document, the term business, business counts or employment locations are interchangeable. 4. Employment data collected by the survey team are for those businesses which are clearly identified by signage. Employment is collected from residential or home businesses only where there is visible signage posted at the point of entry. Other mobile or transient type businesses without a permanent location may be missed. 5. Business counts refer to the total number of records or locations where employment is greater than 0. Business counts are not unique and should not be used to identify the number of businesses. For example, a business reporting employment at three different locations will be counted three times. 6. Full time employment refers to the number of people who work 30 hours or more a week at a business location. 7. Part time employment refers to the number of people who work less than 30 hours a week at a business location. 8. Seasonal employment refers to the number of people who work only for part of the year, (i.e. summer student employment, contract or temporary positions). 9. A business that did not participate will have an employment value of 0 and will not be reflected in any of the tables and/or charts. 10. A business identified as vacant will have an employment value of 0 and will not be reflected in any of the tables and/or charts. 34 P age
36 City of Hamilton Annual Employment Survey, 2016 and A business, organization or agency with volunteers and no paid employees will have an employment value equal to 0 and will not be reflected in any of the tables and/or charts. 12. A business location where the employment value is greater than 0 will be assigned a 2017 North America Industrial Classification System Code (see item 16 below). 13. All values and totals identified in the tables and charts have all been rounded up or down by Employment refers to the number of jobs at each business location. 15. Business size refers to the number of employees or jobs within a certain defined category. For the purpose of this document, the size of the business categories are defined as the following, 1-4 employees, 5-9 employees, employee, employees, employees, employees and 500 employees or greater. Note: large organizations business counts will be assigned to the business size reported at their respective multiple locations North America Industrial Classification System Codes (Statistics Canada) 11 Agriculture, Forestry, Fishing and Hunting 21 Mining, Quarrying, and Oil and Gas extraction 22 Utilities 23 Construction Manufacturing 41 Wholesale Trade Retail Transportation and Warehousing 51 Information and Cultural Industries 52 Finance and Insurance 53 Real Estate and Rental and Leasing 54 Professional, Scientific and Technical Services 55 Management of Companies and Enterprises 56 Administrative and Support, Waste Management and Remediation Services 61 Educational Services 62 Health Care and Social Assistance 71 Arts, Entertainment and Recreation 72 Accommodation and Food Services 81 Other Services (except Public Administration) 91 Public Administration 17. In total, over 11,500 employment locations were surveyed. Larger businesses and/or organizations were contacted by phone, as they required more time to prepare their 35 P age
37 City of Hamilton Annual Employment Survey, 2016 and 2017 employment figures. The survey response rate is rather good with many businesses participating. 18. The Statistics Canada s National Industrial Classification Systems Code (NAICS) identifies the major employment sector is assigned to each business record. 19. Only those farms accessible to the public and having a storefront presence have been surveyed and will be reflected in the tables and/or charts. An attempt is made to contact all businesses in the City; however, farms are more difficult to approach as entry is not always feasible unless a storefront is present. The businesses missed would be a small percentage of total employment and the effect on the overall aggregate results for the City would be minimal. This, however, is not true if one is examining a smaller geographic area for which the missed businesses falls in. 20. The City of Hamilton s annual employment survey by no means reflects that of the Statistics Canada Census, which is conducted every five years. The methodology carried out by the census is more elaborate and is a survey completed by an individual, who, if receives the long census form, will identify their place of work during a week in May of the previous census year. The City of Hamilton s annual employment survey attempts to determine the number of jobs on behalf of the business owner. The difference being, if an individual holds 3 part time jobs at 3 different businesses, the total job count will be three, whereas, if the same individual responds the census survey place of work question, the individual can only respond to the 1 of 3 jobs having the most work hours. Because of this distinction and difference in data collection methodology, it is not recommended the annual employment survey be compared to that of the census. Statistics Canada s Place of Work for the City of Hamilton in 2016 was 203,330, with 187,545 having a usual place of work and 15,785 who worked at home Statistics Canada Census of Agricultural reports 885 farms for Hamilton Division. 36 P age
38 City of Hamilton Annual Employment Survey, 2016 and 2017 INDEX Tables and Charts Index Page Table 1 Employment and Employment Percentage by Industry, City of Hamilton, 2016 and Chart1 Employment Percentage by Industry, City of Hamilton 2016 and Table 2A Employment by Industry and by Work Activity, City of Hamilton, Table 2B Employment by Industry and by Work Activity, City of Hamilton, Chart 2A Employment by Industry and by Work Activity, City of Hamilton, Chart 2B Employment by Industry and by Work Activity, City of Hamilton, Chart 3A Employment Percentage by Industry and by Work Activity, City of Hamilton, Chart 3B Employment Percentage by Industry and by Work Activity, City of Hamilton, Chart 4 Employment and Business Counts by Business Size, City of Hamilton, Table 3A Employment by Industry and by Work Activity, Hamilton Urban Growth Centre, Chart 5A Employment by Industry and by Work Activity, Hamilton Urban Growth Centre, Table 3B Employment by Industry and by Work Activity, Hamilton Urban Growth Centre, Chart 5B Employment by Industry and by Work Activity, Hamilton Urban Growth Centre, P age
39 City of Hamilton Annual Employment Survey, 2016 and 2017 Chart 6 Employment and Business Counts by Business Size, Hamilton Urban Growth Centre, Table 4A Employment by Industry by Employment Land Areas, Table 4B Employment by Industry by Employment Land Areas, Table 5A Business Counts by Industry by Employment Land Areas, Table 5B Business Counts by Industry by Employment Land Areas, Chart 7 Employment by Industry by Employment Land Areas, Chart 8 Employment and Business Counts by Industry, Total Employment Land Areas, Chart 9 Employment and Business Counts by Business Size, Total Employment Land Areas, Chart 10A Employment Percentage by Employment Land Areas, Chart 10B Employment Percentage by Employment Land Areas, Table 6 Employment by Industry and by Work Activity, Population-Related Employment, Chart 11 Employment Percentage by Industry, Population-Related Employment, Chart 12 Employment and Business Counts by Industry, Population-Related Employment, Chart 13 Employment and Business Counts by Business Size, Population-Related Employment, P age
40 City of Hamilton Annual Employment Survey, 2016 and 2017 Table 7A Employment by Industry and by Work Activity, by City of Hamilton s Communities, Table 7B Employment by Industry and by Work Activity, by City of Hamilton s Communities, Chart 14A Employment by Industry, by City of Hamilton s Six Communities, Chart 14B Employment by Industry, by City of Hamilton s Six Communities, Table 8A Employment Proportion Percentage by Industry and by Work Activity, by City of Hamilton s Six Communities, Table 8B Employment Proportion Percentage by Industry and by Work Activity, by City of Hamilton s Six Communities, Chart 15A Employment Percentage, by City of Hamilton s Six Communities, Chart 15B Employment Percentage, by City of Hamilton s Six Communities, Chart 16 Employment and Business Counts by Business Size, by City of Hamilton s Six Communities, Table 9A 2017 Employment Density by Geographic Areas 31 Table 9B 2017 Employment Density by Geographic Areas P age

41 CITY OF HAMILTON ANNUAL EMPLOYMENT SURVEY 2016 AND 2017 TABLES AND CHARTS CONTACT INFORMATION Angela Monaco Senior Information Systems Planner GIS Planning ext.1222