Workforce Mobility and Skills in the UK Construction Sector
|
|
|
- Scarlett McKinney
- 5 years ago
- Views:
Transcription
1 Workforce Mobility and Skills in the UK Construction Sector South West Report September 2007 Prepared for: ConstructionSkills, Foras Áiseanna Saothair (FÁS) and COI COI Job Number: Prepared by: Susan Nicholson BMRB Social Research Telephone: Part of BMRB Limited (British Market Research Bureau) BMRB/SN/ BMRB is ISO9001 accredited, and is certified as working to the requirements of MRQSA/BS7911 market research quality standards
2 Table of Contents 1 Background, Objectives and Methodology Introduction Key objectives of the research Methodology Desk research Sampling Telephone survey Site visits Challenges Details of sites covered in the research Structure of the report Notes on tables Management Summary The profile of the workforce Qualifications and skills Mobility Profile, Work Status and Work Histories of the Construction Workforce Demographic profile of the sample Work status Occupational profile Years working in construction Construction employment Occupational switching and progression Qualifications and Skills Construction skill cards and certificates i
3 4.2 Construction qualifications held Working towards construction qualifications Managerial qualifications Summary of qualification and skills card status Competence/qualification level of the construction workforce Self assessment of skill level Mobility Worker origin Location of workplace, current and permanent residence Temporary accommodation Proportion of career spent in current location Travel to work distances Sub-sector mobility Leaving the industry Copyright: survey findings and deliverables are normally intended for use within the Client's organisation or its consultants and other associate organisations such as advertising agencies. The client should acknowledge BMRB as the source of the information with wording acceptable to BMRB. ii
4 1 Background, Objectives and Methodology 1.1 Introduction ConstructionSkills commissioned BMRB to undertake a survey of construction workers to provide reliable data on the nature of the workforce in the UK and the Republic of Ireland (ROI) with regard to their competence/qualification levels and the extent of occupational and geographic mobility within the workforce. This report presents the results of the survey conducted in the South West. A separate technical appendix is available which includes a full technical report and a copy of the questionnaire used. Where available, results from the 2007 survey have been compared with those from similar previous research conducted by IFF Research in Key objectives of the research The overall aim of the study was to provide reliable data on the nature of the construction workforce in regard to their competence/qualification levels and the extent of occupational and geographic mobility within the workforce. More specifically, the key objectives of the research were to examine: the qualification and skill levels of the construction workforce in the UK and ROI the extent to which the workforce in each region is constituted of workers originating or living in other parts of the UK (or further afield), and general mobility and travel to work issues the nature of the mobile workforce/ imported workforce in terms of their occupations and their competence/qualification levels the scale and extent of occupational mobility within the construction workforce to see how workers in construction occupations change or keep their occupations over time, and related to this the extent to which managers have received training specifically to enhance their managerial skills. The focus for the survey was on site-based manual occupations, thus excluding associated clerical and sales occupations and professions such as architects, surveyors and engineers. 1 Comparative findings should be treated as indicative only due to key differences in the types of sites visited in 2004 and The profile of sites visited showing differences by size and category are included in the technical report. 1
5 1.3 Methodology The key elements of the research approach were as follows: Desk research Prior to undertaking primary research a period of exploratory desk-based research was undertaken to examine the scope of information currently available; to identify other surveys and consultations to ascertain what can be learnt from these, and to ensure that any subsequent fieldwork was relevant and informed. The conclusions drawn from the desk research exercise were: there are studies covering similar issues to this study, however the target respondents of these studies tended to be employers the Labour Force Survey (LFS) is conducted among workers and covers similar issues as this study, however it is not specific to the construction industry there is little reliable information on the mobility of workers. The only exception is the LFS but it does not cover certain issues relevant to the construction workforce such as temporary accommodation, or where workers received training the desk research confirmed the need for detailed information from construction workers and for more information on workforce mobility in the UK and ROI. A copy of the presentation summarising the desk research exercise can be found in the technical appendix Sampling For the UK sample a list of current construction projects over 250,000 in value was drawn from Glenigan, an Emap service detailing current and forthcoming construction projects in the UK. From the projects identified as being eligible for inclusion in the survey (the steps taken to select eligible records from Glenigan are detailed in the technical report), a stratified random sample of 99 postcode districts (e.g. NR2) was drawn to produce a representative sample of locations across the UK. For each selected district six eligible projects were identified. Projects were selected on the basis of value, 35% of sites with a value of less than 1 million and 65% of sites with a value of more than 1 million. In 2004, the survey focused on sites valued at over 1 million and the sampling process aimed to ensure a mix of sites by stage of development (first six months, midway, last six months). In 2007 the requirement was to also sample sites under 1 million, so this criterion needed to be reconsidered in that light. The 2004 definition of stage of development clearly assumed quite large, lengthy projects, appropriate for sites with a minimum value of 1 million. With the introduction of smaller sites, some would be completely finished in six months. Therefore it was decided that an appropriate alternative definition would be to select according to value. 2
6 Quotas were set on the target number of sites for each region and by value. The target sample profile is described in the technical report Telephone survey A telephone willingness stage was conducted in order to recruit construction projects selected from Glenigan to take part in the research. Interviewers were instructed to identify the best person to speak to about arranging a visit to the construction site and to collect some headline information about the site. Full details of the information collected and number of interviews achieved is included in the technical report Site visits Once permission had been sought to interview at the particular site, the information was forwarded to a local face-to-face interviewer who contacted the site representative to arrange a date to visit. Interviews with construction workers were then conducted face-to-face on site. Interviewing normally took place in a canteen or site office during workers break periods. In around one in ten cases interviewers were only able to visit the site if they supplied their own Personal Protective Equipment. A selection of interviewers experiences of contacting and visiting sites is shown in the technical report Challenges Given the complex nature of this research project a number of challenges arose during the life of the project. Each issue is discussed in detail in the technical report. 1.4 Details of sites covered in the research The survey results presented in this report is based on fieldwork conducted in the South West from February to July This consisted of a total of 255 face-to-face interviews with site based workers obtained across 24 sites. At the analysis stage, weighting was applied to the data to ensure each nation/region was represented in its correct proportions based on the relative size of the construction workforce. Labour Force Survey figures were used for UK regions/nations, (average profiles from the period October 2006 June 2007). Unless otherwise stated, with the exception of base totals, the figures in this report are based on weighted data. Weighted, the South West accounted for approximately 8% of the UK/ROI workforce. Figures from the site managers interviewed at the telephone fieldwork stage indicated that there were 829 workers across the 24 sites. Using this figure it would appear that around 31% of the potential workforce took part in the research, however it should be noted that there were instances where on the day the site was visited many fewer workers were present than indicated by the site manager when first contacted. This was due to a number of factors, for example the site may have entered into another phase of the project by the time the interviewer was able to visit it. 3
7 The proportion of workers interviewed varied greatly, at some sites we interviewed all workers present, on other sites particularly where interviewing only occurred during short break times only a small proportion of workers were interviewed. 1.5 Structure of the report The report is structured as follows: Chapter 1 Chapter 2 Chapter 3 Chapter 4 Chapter 5 Background, Objectives and Methodology Management Summary Profile, Work Status and Work Histories of the Construction Workforce Qualification and Skills Mobility A separate technical report has been produced. 1.6 Notes on tables Where respondents can give multiple responses to a question, the sum of the individual responses may be greater than 100 per cent. Also the percentages in the tables do not always sum to 100 per cent due to rounding, and where percentages in the text differ to the sum of percentages in the tables, this too will be due to rounding. An asterisk ( ) in a table signifies a percentage that is greater than 0 but less than 0.5. A dash (-) signifies a cell where data has not been included due to too small a base size. N/A in a table signifies where we are unable to make a comparison with previous years as either the question wasn t asked or the data wasn t available. With the exception of base totals the figures referred to are weighted. The report contains some tables showing findings based on relatively small numbers of respondents (less than 70). Such low base sizes carry a greater risk of these figures being unrepresentative of the population in question and should, therefore, be treated as indicative only. Consistent with the 2004 report, only results based on 15 workers or more have been referenced in either tables or the text. 4
8 2 Management Summary ConstructionSkills commissioned BMRB to undertake a survey of construction workers to provide reliable data on the nature of the workforce in the UK and the Republic of Ireland (ROI) with regard to their competence/qualification levels and the extent of occupational and geographic mobility within the workforce. The survey results presented in this summary are based on fieldwork conducted in the South West from February to July This consisted of a total of 255 face-to-face interviews with site based workers obtained across 24 sites. This summary highlights the key findings for each of the major themes covered. Where available, results from the 2007 survey have been compared with those from similar previous research conducted by IFF Research in Detailed results are available in the body of the full report, and a full technical report is available containing full details of sampling and methodology. 2.1 The profile of the workforce The workforce in the South West had an older profile than that of the overall workforce with almost a third (31%) aged 45 or over compared with around a quarter (26%) of the UK/ROI workforce. Probably as a result of this older profile a higher proportion were also more likely to have more than 20 years experience (32% in the South West compared with 27% of the overall workforce). A wide range of occupations was covered in the research with the most prevalent being plant/machine operatives (18%), carpenters/joiners (16%) and bricklayers (15%). Together these occupations accounted for around half of the construction workforce interviewed in the South West. The South West had one of the highest proportions of self-employed workers in the UK (37%), almost three-fifths (59%) were employed directly by a company while just 4% worked for agencies which were most likely to be used for labouring/general operative positions (15% of these workers were employed by agencies). 2.2 Qualifications and skills The proportion of those in the South West who had either a construction skill card or certificate grew from 55% in 2004 to 70% in 2007, a rate of growth slightly higher than that seen for the overall workforce. As for the UK and ROI as a whole, the South West has seen particularly strong growth in the proportion of self-employed workers having one of these qualifications with almost three-quarters (74%) having one in 2007 compared to just over half (52%) in Comparative findings should be treated as indicative only due to key differences in the types of sites visited in 2004 and The profile of sites visited showing differences by size and category are included in the technical report. 5
9 In contrast, the proportion with a qualification relevant to construction other than a skill card or certificate fell from 2004 to 2007 (it remained relatively stable in the UK and ROI as a whole). Around half (49%) held such a qualification in 2007 compared to almost three-fifths (58%) in This decline is mainly due to a fall in the proportion of the directly-employed who hold this type of qualification. As for the UK as a whole workers in the South West were more likely to hold an NVQ or SVQ in 2007 than 2004 (46% had one in 2007 compared to 23% in 2004). However, the proportion holding City and Guilds qualifications in the South West had not fallen as quickly as the rest of the UK, perhaps due to the slightly older profile of the workforce. Over two-fifths (42%) still had a City and Guilds in 2007 compared to just under half (47%) who had one in Just over a fifth (21%) of workers in the South West said they had supervisory or managerial duties on site. The proportion of this group that had received training to improve their skills in this area had increased since 2004 (up to 45% from 24%) and was at a similar level to the rest of the UK and ROI. However, it was still the case that over half do not receive this type of training. The proportion of the workforce that were working towards a construction qualification (most commonly an NVQ or SVQ) was 16%, around the same level as for the UK and ROI as a whole. Around two-thirds of those working towards a qualification did not already have one. This means that a tenth of the overall workforce in the South West did not currently have a qualification but were working towards one. Those in the South West were slightly more likely than the workforce across the UK and the ROI to have said that they need more training and qualifications in their current job (17% vs. 13%). Just under a fifth (18%) felt they needed training in basic skills, a slightly lower proportion than for the UK and ROI as a whole (21%). In particular there seemed to be less of a need for training in reading, writing and speaking English perhaps due to the small proportion of workers in the region who come from outside the UK or ROI. There may be some potential demand for training from those who are looking to change their roles within the construction industry. Just over a tenth (12%) of those in the South West said they would like to change the work they do and the vast majority of them (93%) said that they would need further training and qualifications for their prospective new role. The relatively short time that workers are on site is a potential barrier to the uptake and delivery of training. Workers in the South West were slightly more likely to say they will stay at their site for no longer than three months than average (36% vs. 31%) although they were also more likely to say that they will stay at the same site for more than a year (24% vs. 20%). 6
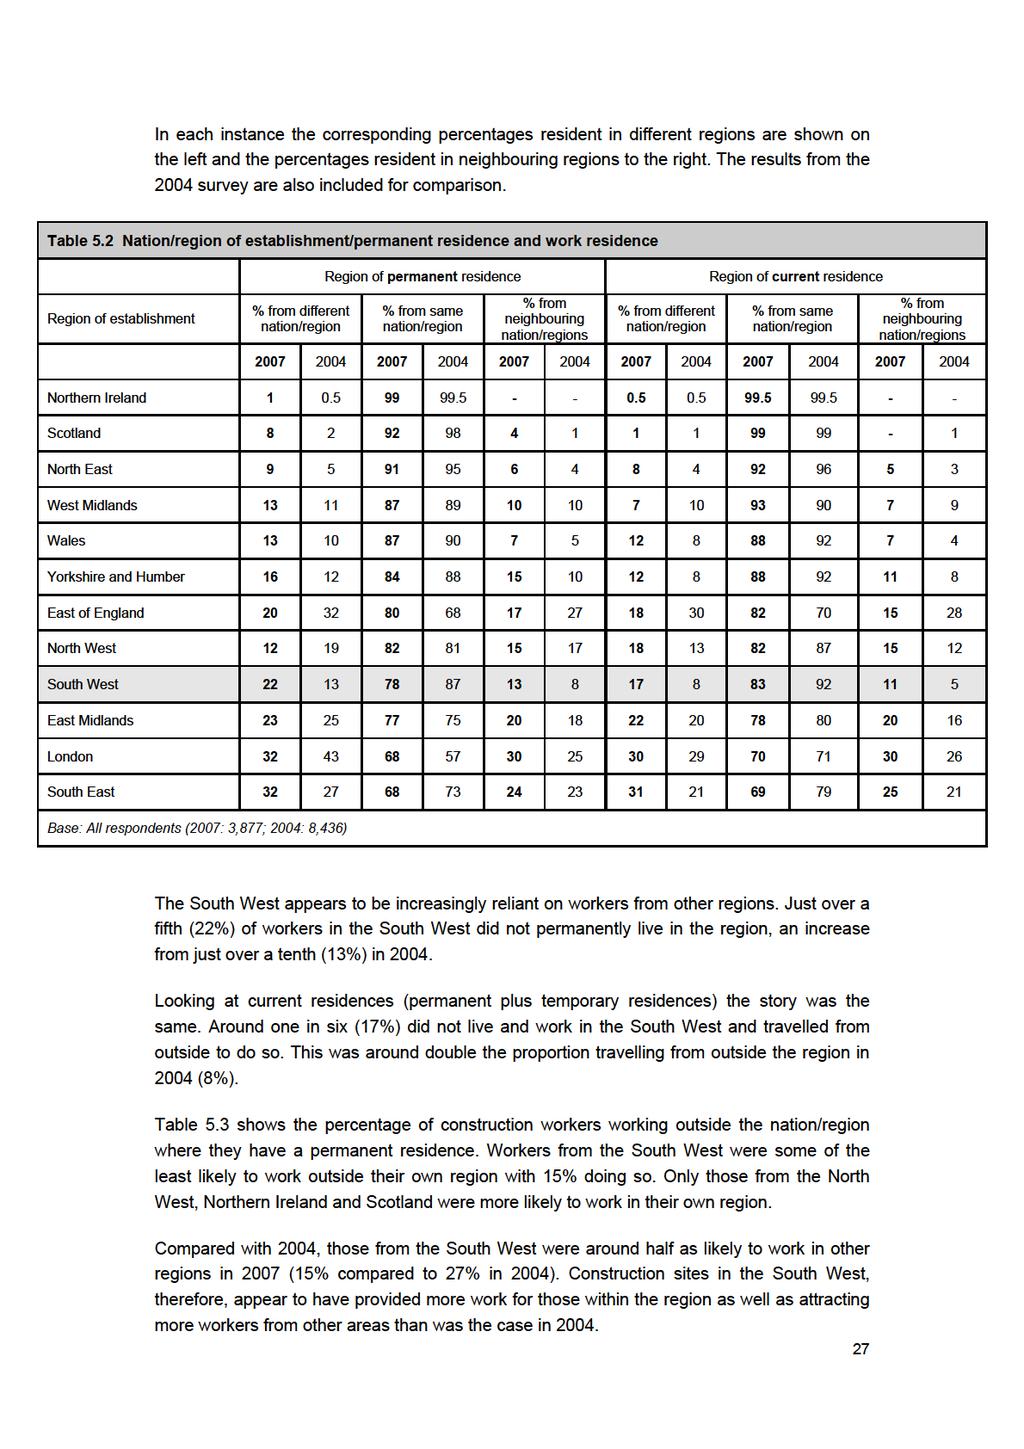
10 2.3 Mobility The South West had one of the lowest proportions of native workers across all regions (only the East of England, the South East and London had a lower proportion) with just three-fifths of workers coming from the region. However, a very small minority (1%) of workers in the South West came from outside the UK and ROI. Construction sites in the South West appear to have provided more work for both those within the region and outside of it in 2007 than was the case in Workers from the South West were some of the least likely to work outside their own region (15% vs. 27% in 2004). Also, just over a fifth (22%) of workers in the South West did not permanently live in the region, an increase from 13% in The average distance travelled to work was 21 miles, slightly lower than for the UK and ROI as a whole (24 miles). Workers in the South West were more likely than average to travel less than five miles to work (33% vs. 24% for the UK and ROI) but were just as likely to travel over 50 miles (11%). 7
11
12
13
14
15
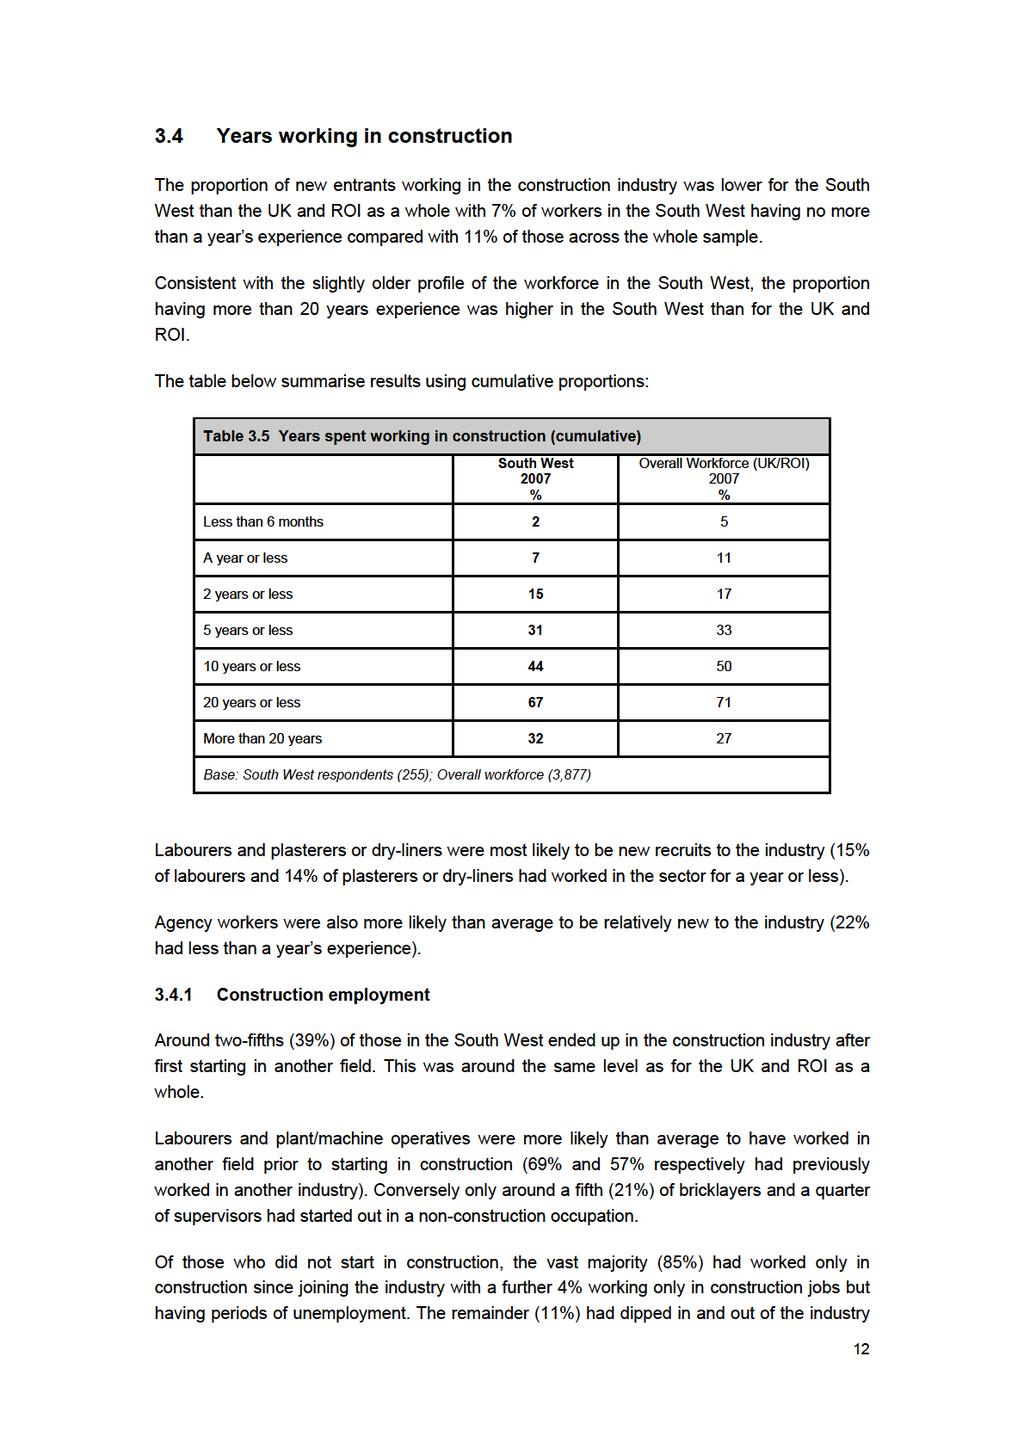
16 occasionally taking work in other fields. This was a slightly lower proportion than for the UK and ROI as whole (13%) Occupational switching and progression An area of particular interest in the research was the extent of switching between occupations within construction. To this end workers were asked if they had always worked in their current role/occupation, and if not, what their previous occupation had been. Around two-thirds (65%) of those in the South West said that they had worked in the same trade since joining the construction industry. This compares to a figure of 60% for whole of the UK and ROI. Bricklayers and labourers were the most likely occupations to have switched trades in the past, respectively two-fifths (42%) had previously had another role. 13
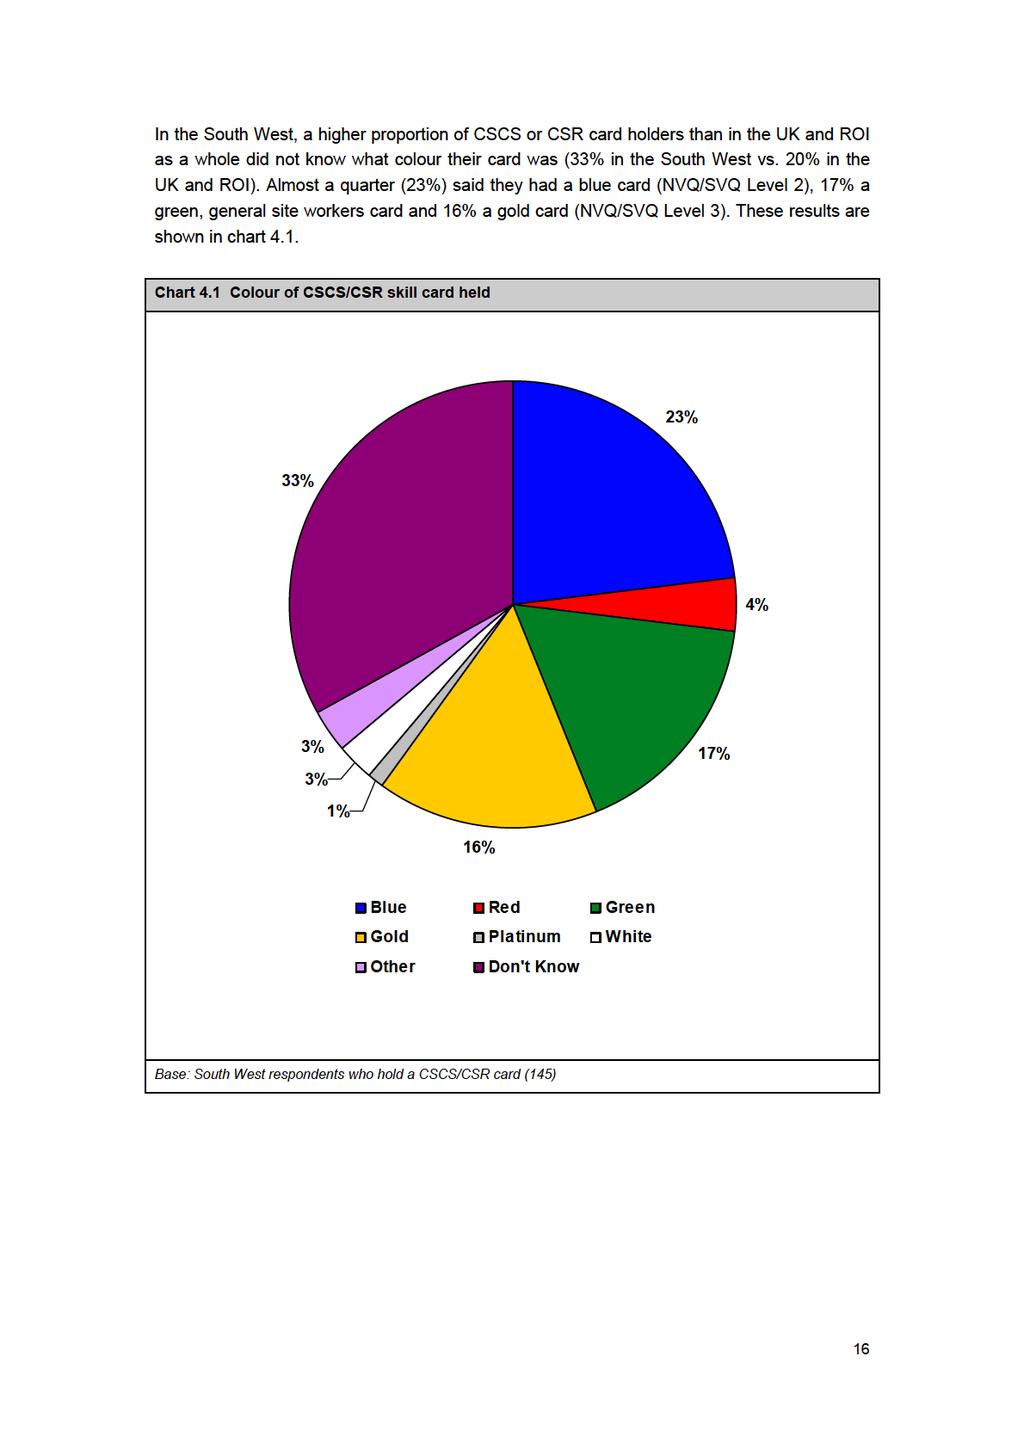
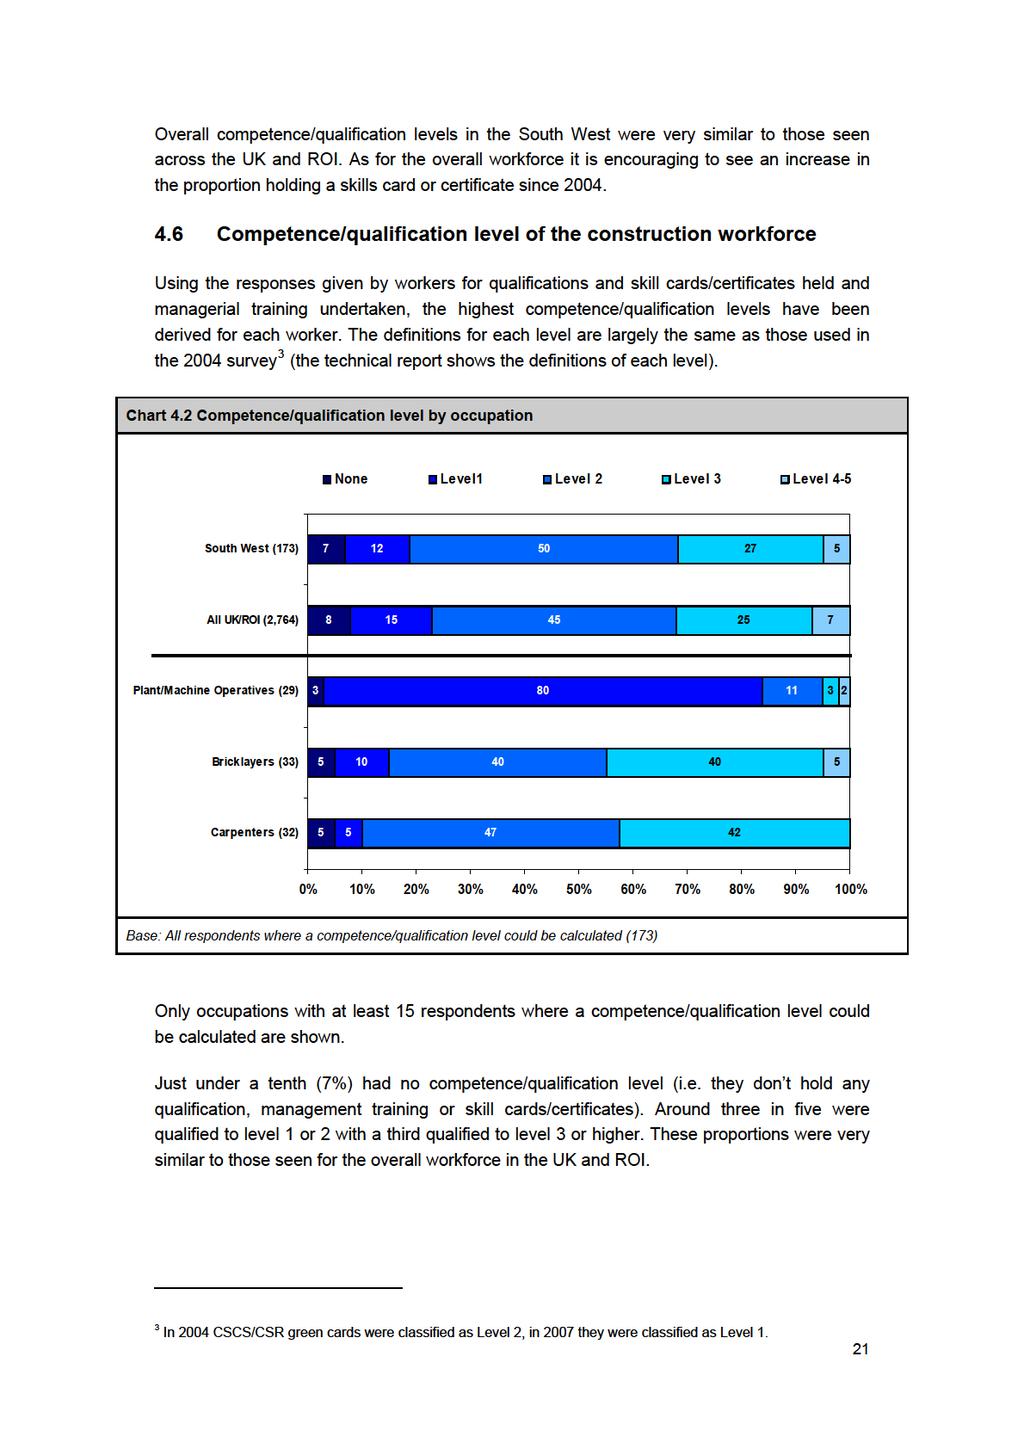
17 4 Qualifications and Skills A key objective of this research was to measure the competence/qualification levels of the construction workforce. A number of questions were asked to ascertain this: whether any construction skill certificate or card was held and if so which and, in the case of CSCS and CSR cards, to what level what formal qualifications relevant to the construction industry they held or were working towards, if any those with managerial or supervisory duties were asked about any training specifically designed to improve their managerial or supervisory skills or knowledge. We also asked workers to assess their own skills, including basic skills and whether they felt they needed more training to do their current job. 4.1 Construction skill cards and certificates There is a general move in the industry for all persons working on, or visiting, construction sites to have a construction skills card or certificate. Already, many sites won't let workers on without an appropriate card to prove their skills. And this is set to increase as the industrywide deadline approaches for a fully qualified workforce by The proportion holding a skill card or certificate had grown slightly more quickly since 2004 in the South West than in the UK and ROI as a whole. Seventy percent of workers in the South West said they held a skill card or certificate compared with 55% in Sixty-eight percent of the overall workforce across the UK and ROI had a skill card or certificate compared with 57% in year olds in the South West were more likely to have a skill card or certificate than average (67% vs. 62%). The South West has also seen strong growth in the proportion of self-employed construction workers with skill cards/certificates since Almost threequarters (74%) of these workers held a skill card/certificate compared with just over a half (52%) in In contrast the proportion of directly employed workers with a skill card or certificate had only increased by 10 percentage points (up to 68% from 58% in 2004). These increases mirror what was happening across the UK/ROI where the growth in self-employed workers with skill cards or certificates exceeded that for employees. 14

18
19
20
21
22
23
24
25
26
27
28 5 Mobility A key aim of the survey is to gain an understanding of geographic mobility of construction workers and to try to get a measure of which regions are net importers and which are net exporters. Another aim is to identify which types of workers (for example, by occupation and competence/qualification level) are particularly likely to be mobile. The results from this analysis clearly have a bearing on training planning, provision and investment. What constitutes a mobile worker is not straightforward. Potentially it includes those who live outside a region and travel in on a daily basis, those who live in temporary accommodation while working but whose permanent address is outside the region, those who have moved to the area on a semi-permanent basis, as well as those who received their construction training elsewhere but have now moved to the region on a permanent basis. Hence for the survey a number of questions were asked covering these issues. These were: where respondents were from originally whether they travel from their permanent address or a temporary address (and if temporary why they work in the current region) the proportion of their time working in construction which has been on sites within the region where they are currently working the miles they travel to get to the site each day whether when they finish this site they expect to get a job which allows them to commute on a daily basis from their permanent address. These areas are discussed in turn. In the last section we also look at how long workers are typically based at an individual site to give some idea of the frequency of moving between sites. Clearly workers may have spent their whole working life in one region and therefore appear relatively immobile, but if they move site frequently, providing training to these workers could be problematic. 5.1 Worker origin Workers were asked where they were from originally. As a measure of mobility clearly this is very broad, since people may have moved to a region on a permanent basis and done so many years ago for reasons other than their work. That said there are still some interesting differences between regions as far as importing and exporting workers is concerned, which are shown in table

29
30
31
32
33
34