ISE 320 Quality Control and Industrial Statistics CHAPTER 06 MEASUREMENT SYSTEM ANALYSIS (MSA) Engineering College, Hail University, Saudi Arabia
|
|
|
- Barrie Weaver
- 5 years ago
- Views:
Transcription
1 ISE 320 Quality Control and Industrial Statistics CHAPTER 06 MEASUREMENT SYSTEM ANALYSIS (MSA) Professor Mohamed Aichouni Engineering College, Hail University, Saudi Arabia Introduction on MSA To improve the quality of a production process, it is necessary to determine the sources of the variations, whether they are common or special causes variations. The variations in a production process are due either: to the actual differences between the parts produced (quality) or to the process used to assess the quality of the parts (Measurement System), or a combination of these two factors. 1
2 Introduction on MSA Measurement Systems Analysis is a key step to any process improvement effort. By understanding existing measurement systems a team can better understand the data provided by those systems and make better business decisions. MSA in Process Improvement If measurements are used to guide decisions, then it follows logically that the more error there is in the measurements, the more error there will be in the decisions based on those measurements. The purpose of Measurement System Analysis is to qualify a measurement system for use by quantifying its accuracy, precision, and stability. 2


3 MSA MSA in Modern Industry 6 3
4 MSA in Process Improvement 7 Measurement Systems Analysis MSA assesses the adequacy of a measurement system for a given application. When measuring the output from a process, consider two sources of variation: 1 - Part-to-part variation 2 - Measurement system variation If measurement system variation is large compared to part-to-part variation, the measurements may not provide useful information on the process. 8 4
.")
5 MSA for Quality Professionals 9 General requirements of all capable measurement systems Statistical stability over time. Variability small compared to the process variability. Variability small compared to the specification limits (tolerance). The resolution, or discrimination of the measurement device must be small relative to the smaller of either the specification tolerance or the process spread (variation). The measurement system should have resolution of at least 1/10th the smaller of either the 10 specification tolerance or the process spread. 5
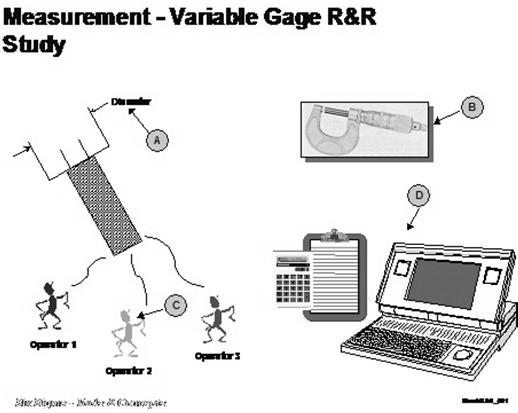
6 Characterization of Measurement Systems A measurement system can be characterized by: 1. Location (Average Measurement Value vs. Actual Value): (stability, Bias, linearity) 2. Variation (Spread of Measurement Values - Precision): Repeatability, Reproducibility 3. Stability Assessment 4. Repeatability and Reproducibility Assessment 11(Gage R&R) Accuracy Precision Measurement Systems Errors Measurement system errors can be classified into two categories: Accuracy the difference between the part s measured and actual value. Precision the variation when the same part is measured repeatedly with the same device. 12 6

7 Accuracy and Precision Efforts to improve measurement system quality are aimed at improving both accuracy and precision 13 Measurement Process Variations If we measure the same part repeatedly, chances are that there will be a variation in the results that we obtain. The measurement process is never perfect but there is always a possibility to reduce the measurement process variations: Measurement Process Variation : o : Variation du to Operator d : Variation due to measurement instrument 14 7

8 Possible Sources of Process Variation Observed Process Variation Actual Process Variation Measurement Variation Long-term Process Variation Short-term Process Variation Variation w/i sample Variation due to gage Variation due to operators Repeatability Calibration Stability Linearity repeatability and reproducibility are the primary contributors to measurement error Possible Sources of Process Variation (Gage R&R Analysis) 8
9 How Does Measurement Error Appear? LSL USL Actual process variation - No measurement error Observed process variation - With measurement error LSL USL Measurement System Terminology Discrimination - Smallest detectable increment between two measured values Accuracy related terms True value - Theoretically correct value Bias - Difference between the average value of all measurements of a sample and the true value for that sample Precision related terms Repeatability - Variability inherent in the measurement system under constant conditions Reproducibility - Variability among measurements made under different conditions (e.g. different operators, measuring devices, etc.) Stability - distribution of measurements that remains constant and predictable over time for both the mean and standard deviation Linearity - A measure of any change in accuracy or precision over the range of instrument capability 9
10 Gage Repeatability & Reproducibility -Analysis Practical Example The quality manager of a manufacturing plant wants to tests new wattmeters used to measure the active electric power generated by a newly designed generator. He takes a sample of 20 units of wattmeters labeled from A to T and designates one of his auditors (person) to test each one of them three times. The measurements are used to construct Xbar-R control charts to assess the variations in the 19 measurement system. Gage Repeatability & Reproducibility Analysis We need to construct the Xbar-R chart for the data to assess the measurement system

11 Gage Repeatability & Reproducibility Analysis Determine the mean and the Range for each part Determine the control limits Draw the charts Interpret the charts 21 Gage Repeatability & Reproducibility Analysis First determine the mean and the Range for each part Determine the control limits for Xbar chart: 22 11

12 Gage Repeatability & Reproducibility Analysis Interpretation: Each point on the control chart represents the average measurement of the gage (wattmeter). The Xbar chart shows that the points follow a normal pattern of variation and are all within the control limits. 23 Gage Repeatability & Reproducibility Analysis Interpretation (Cont..): It can be concluded from the Xbar chart that: 1. the variability around the mean is due to common causes and the operator is not having problems getting accurate results. 2. the measurement process is in-control and 3. that the gage used in the measurement process is precise 24 12

13 Gage Repeatability & Reproducibility Analysis Use of R chart to examine the extent of the variation in the same wattmeter. 25 Gage Repeatability & Reproducibility Analysis R chart The R-chart shows a random pattern with all the points being inside the control limits; this confirms that the gage used in the measurement process is generating consistent results


14 Minitab for Measurement Systems Analysis MSA in Minitab 14

15 Manufacturing / Practical Example ISE 320 Students 15

16 Additional Readings

17 Lecture Finished Any Question? No Conclusion Yes Ask questions Teachers answers "Quality truly begins with education and ends with education", K. Ishikawa (1990). Train your self (Google, YouTube, course webpage End (See you next lecture) 17