Project Management CTC-ITC 310 Spring 2018 Howard Rosenthal
|
|
|
- Candace Palmer
- 5 years ago
- Views:
Transcription

1 Project Management CTC-ITC 310 Spring 2018 Howard Rosenthal 1
2 Notice This course is based on and includes material from the text: A User s Manual To the PMBOK Guide Authors: Cynthia Stackpole Snyder Publisher: Wiley ISBN: , Copyright 2013 It also utilizes general information and figures from the PMBOK: A Guide to the Project Management Body of Knowledge (PMBOK 5 TH Edition) Publisher: Project Management Institute ISBN: , Copyright 2013 and A Guide to the Project Management Body of Knowledge (PMBOK 6 TH Edition) Publisher: Project Management Institute ISBN: , Copyright 2017 The course also includes and intersperses some materials, most often diagrams, provided by Mr. Wysocki s PowerPoint slides, at the website: And the book Effective Project Management - Traditional, Agile, Extreme 7TH Edition Authors: Robert K. Wysocki Publisher: Wiley ISBN: , Copyright
3 Lesson Goals Define what Project Quality Management is Describe effective Quality Management Discuss ISO quality standards The Plan-Do-Check-Act approach Describe quality measurement Discuss the differences between correlation and causation Describe the quality tools and how they are used 3

4 Project Management Process Groups and Knowledge Areas PMBOK Std V6 Table 1-1 4
5 5
6 Project Quality Management (1) Project Quality Management includes the processes and activities of the performing organization that determine quality policies, objectives, and responsibilities so that the project will satisfy the needs for which it was undertaken Project quality management is applied to the project and the product Quality processes and tools and techniques for the product are industry and product specific Software quality is far different than pavement quality Quality processes and tools and techniques for the project can be applied to most projects the same way Both must be planned into the project to ensure the result meets the customer expectations and fulfills the project objectives Many quality metrics deal with faults and failures 6
7 Project Quality Management (2) Underlying assumptions of Quality Management Customer satisfaction is a key component of project success Customer satisfaction can be described as conformance to requirements and fitness for use It is better to plan quality in and prevent defects and errors from occurring rather than to find errors during the inspection process The plan-do-check-act process as defined by Deming and Shewhart is the basis for quality improvement, but it is not explicitly identified in the quality processes Much of the investment in quality comes from the organization Quality processes and procedures, certifications, investment in proprietary quality methodologies (such as TQM or Six Sigma) are the responsibility of the organization It is the responsibility of the project to follow those processes 7
8 Project Quality Management (3) There are six levels of increasingly effective quality management The most expensive approach is to let the customer find the defects Can lead to warranty issues, recalls, loss of reputation, even bankruptcy on extreme cases Detect and correct the defects before the deliverables are sent to the customer as a part of the quality control process This has costs related to appraisal and internal failure Use quality assurance to examine and correct the process, not just the defects Incorporate quality into the planning and the designing of the project and product Create a culture throughout the organization that is aware and committed to quality in processes and products Provide a process of continuous process improvement Significant resources are spent to achieve and be certified at these higher quality levels 8
9 9
10 ISO Quality Standards (1) ISO 9000 Standards address quality An ISO 9001 quality management system will help you to continually monitor and manage quality across all operations It is the world's most widely recognized quality management standard, It outlines ways to achieve, as well as benchmark, consistent performance and service Companies spend enormous amounts of money to get certified in various International Standards Organization (ISO) processes They also spend lots of money training and certifying employees and preparing for reviews In the context of achieving ISO compatibility, modern quality management approaches seek to minimize variation and to deliver results that meet defined requirements. These approaches recognize the importance of: Customer Satisfaction Understanding, evaluating, defining, and managing requirements so that customer expectations are met. This requires Conformance to requirements (to ensure the project produces what it was created to produce) Fitness for use (the product or service needs to satisfy the real needs) Prevention over inspection Quality should be planned, designed, and built into not inspected into the project s management or the project s deliverables. The cost of preventing mistakes is generally much less than the cost of correcting mistakes when they are found by inspection or during usage 10
11 ISO Quality Standards (2) Continuous Improvement The PDCA (plan-do-check-act) cycle is the basis for quality improvement as defined by Shewhart and modified by Deming. In addition, quality improvement initiatives such as Total Quality Management (TQM), Six Sigma, and Lean Six Sigma could improve the quality of the project s management as well as the quality of the project s product Commonly used process improvement models include Malcolm Baldrige, Organizational Project Management Maturity Model (OPM3 ), and Capability Maturity Model Integrated (CMMI ) Management Responsibility Success requires the participation of all members of the project team Nevertheless, management retains, within its responsibility for quality, a related responsibility to provide suitable resources at adequate capacities. 11
12 Plan-Do-Check-Act For Continuous Quality Improvement (1) Plan The planning phase involves assessing a current process, or a new process, and figuring out how it can be improved upon Knowing the types of outputs that are desired helps to develop a plan to fix the process It is often easier to plan smaller changes during this phase so that they can be easily monitored and the outputs are more predictable Do The do phase allows the plan from the previous step to be enacted Small changes are usually tested, and data is gathered to see how effective the change is Check During the check phase, the data and results gathered from the do phase are evaluated Data is compared to the expected outcomes to see any similarities and differences The testing process is also evaluated to see if there were any changes from the original test created during the planning phase If the data is placed in a chart it can make it easier to see any trends if the PDCA cycle is conducted multiple times This helps to see what changes work better than others, and if said changes can be improved as well 12
13 Plan-Do-Check-Act For Continuous Quality Improvement (2) Act If the Check phase shows that the Plan phase which was implemented in the Do phase is an improvement to the prior standard (baseline), then that becomes the new standard (baseline) for how the organization should act going forward (new standards are thus said to be enacted) If the Check phase shows that the Plan phase which was implemented in Do phase is not an improvement, then the existing standard (baseline) will remain in place In either case, if the check phase showed something different than expected (whether better or worse), then there is some more learning to be done... and that will suggest potential future PDCA cycles Note that some who teach PDCA assert that the act phase involves making adjustments or corrective actions, but generally it would be counter to PDCA thinking to propose and decide upon alternative changes without using a proper plan phase, or to make them the new standard (baseline) without going through do and check steps Adjust The adjust phase is the alternative version of the act phase Once PDCA has been run multiple times, the process generally has enough information for it to be considered a new standard This is usually completed in the act phase The adjust phase allows the process to continue to be monitored after the changes have been implemented and fix them accordingly Doing this lets the PDCA cycle truly be for continuous improvement instead of changing a process and letting it become inefficient again 13

14 Plan-Do-Check-Act For Continuous Quality Improvement (3) 14
15 15
16 Project Quality Management - Processes Project Quality Management has three processes 8.1 Plan Quality Management The process of identifying quality requirements and/or standards for the project and its deliverables and documenting how the project will demonstrate compliance with quality requirements 8.2 Manage Quality The process of translating the Quality Management Plan into executable quality activities that can incorporate the organization s quality policies into the project 8.3 Control Quality The process of monitoring and recording results of executing the quality activities to assess performance and recommend necessary changes, as well as verify that quality requirement have been and are being met 16

17 Project Quality Management Overview PMBOK V6 Guide Figure

18 Quality Management Process Interactions PMBOK Guide V6 Figure
19 19
20 Quality and Grade Some key terms Quality The degree to which a set of inherent characteristics fulfills requirements Quality as a delivered performance or result is the degree to which a set of inherent characteristics fulfill requirements (ISO 9000) Grade Grade as a design intent is a category assigned to deliverables having the same functional use but different technical characteristics A category or rank is used to distinguish items that have the same functional use (e.g., hammer ) but do not share the same requirements for quality (e.g., different hammers may need to withstand different amounts of force) It may not be a problem if a suitable low-grade software product (one with a limited number of features) is of high quality (no obvious defects, readable manual). In this example, the product would be appropriate for its general purpose of use. It may be a problem if a high-grade software product (one with numerous features) is of low quality (many defects, poorly organized user documentation). In essence, its high-grade feature set would prove ineffective and/or inefficient due to its low quality. 20
21 Precision and Accuracy Precision Within the quality management system, precision is a measure of exactness For example, the magnitude for each increment on the measurement s number line is the interval that determines the measurement s precision the greater the number of increments, the greater the precision. Accuracy Within the quality management system, accuracy is an assessment of correctness For example, if the measured value of an item is very close to the true value of the characteristic being measured, the measurement is more accurate. Consider archery targets Arrows clustered tightly in one area of the target, even if they are not clustered in the bull s-eye, are considered to have high precision Targets where the arrows are more spread out but equidistant from the bull seye are considered to have the same degree of accuracy Targets where the arrows are both tightly grouped and within the bull s-eye are considered to be both accurate and precise Precise measurements are not necessarily accurate measurements, and accurate measurements are not necessarily precise measurements. The project management team should determine the appropriate levels of accuracy and precision for use in the quality management plan 21
22 Cost of Quality (1) Cost of Quality (coq) Cost of quality refers to the total cost of the conformance work and the nonconformance work that should be done as a compensatory effort because, on the first attempt to perform that work, the potential exists that some portion of the required work effort may be done or has been done incorrectly The costs for quality work may be incurred throughout the deliverable s life cycle Decisions made by the project team can impact the operational costs associated with using a completed deliverable. Post-project quality costs may be incurred because of product returns, warranty claims, and recall campaigns Because of the temporary nature of projects and the potential benefits that may be derived from reducing the post-project cost of quality, sponsoring organizations may choose to invest in product quality improvement These investments generally are made in the areas of conformance work that act to prevent defects or act to mitigate the costs of defects by inspecting out nonconforming units A Cost-Benefits analysis is often performed The issues related to post- project COQ should be the concern of program management and portfolio management such that project, program, and portfolio management offices should apply appropriate reviews, templates, and funding allocations for this purpose 22

23 Cost of Quality (2) Cost of Conformance Cost of Nonconformance Prevention Costs (Build a quality product) raining Appraisal Costs g to avoid failures Internal Failure Costs (F by k External Failure Costs (F by War k because of failures Figure 8-5. Cost of Quality PMBOK Figure
24 Correlation vs. Causation In order to properly use quality tools we need to understand the difference between correlation and causation Correlation A statistical measure that indicates the extent to which two or more variables fluctuate together A positive correlation indicates the extent to which one variable increases as the other increases A negative correlation indicates the extent to which one variable decreases as the other increases Causation The capacity of one variable to actually influence another Can be positive or negative Must be repeatable and have an objective reason that goes beyond correlation Arguments often exist over whether correlation truly indicates causation, or whether the correlation is a simple coincidence Climate change is a prime example Unemployment rates and minimum wage Simpler example Yellow cars have few accidents Is this due to the color of the car or the personality of the persons who buy that color car 24
25 25
26 A Few Defining Terms Prevention and Inspection Prevention is keeping errors out of the process Inspection is keeping errors out of the hands of the customer Attribute Sampling and Variable Sampling Attribute sampling measures whether or not the result conforms Variable sampling measures, on a continuous basis, the degree of conformity Tolerances and Control Limits Tolerance specifies the range for acceptable results Control limits identify the normal boundaries of common variation in a statistically stable process 26
27 The Seven Quality Tools Cause & Effect Diagram Flowcharts Checksheets Pareto Diagrams Histograms Control Charts Scatter Diagrams PMBOK Figure 8-7 There are seven tools used in quality control 27
28 Cause-and-Effect Diagrams (1) Cause-and-Effect Diagrams - also known as Fishbone or Ishikawa Diagrams The problem statement placed at the head of the fishbone is used as a starting point to trace the problem s source back to its actionable root cause. The problem statement typically describes the problem as a gap to be closed or as an objective to be achieved The causes are found by looking at the problem statement and asking why until the actionable root cause has been identified or until the reasonable possibilities on each fishbone have been exhausted Often prove useful in linking the undesirable effects seen as special variation to the assignable cause upon which project teams should implement corrective actions to eliminate the special variation detected in a control chart 28
29 Cause-and-Effect Diagrams (2) 29
30 Cause-and-Effect Diagrams (3) 30
31 Cause-and-Effect Diagrams (4) 31
32 Flowcharts (1) Flowcharts are referred to as Process Maps They display the sequence of steps and the branching possibilities that exist for a process that transforms one or more inputs into one or more outputs Flowcharts show the activities, decision points, branching loops, parallel paths, and the overall order of processing by mapping the operational details of procedures that exist within a horizontal value chain Flowcharts may prove useful in understanding and estimating the cost of quality in a process This is obtained by using the workflow branching logic and associated relative frequencies to estimate expected monetary value for the conformance and nonconformance work required to deliver the expected conforming output 32

33 Flowcharts (2) 33

34 Flowcharts (3) 34
35 Checksheets (1) Checksheets - also known as tally sheets May be used as a checklist when gathering data Used to organize facts in a manner that will facilitate the effective collection of useful data about a potential quality problem They are especially useful for gathering attributes data while performing inspections to identify defects For example, data about the frequencies or consequences of defects collected in checksheets are often displayed using Pareto diagrams 35

36 Checksheets (2) 36

37 Checksheets (3) 37
38 Pareto Diagrams (1) Pareto Diagrams A special form of vertical bar chart used to identify the vital few sources that are responsible for causing most of a problem s effects The categories shown on the horizontal axis exist as a valid probability distribution that accounts for 100% of the possible observations The relative frequencies of each specified cause listed on the horizontal axis decrease in magnitude until the default source named other accounts for any nonspecified causes Typically, the Pareto diagram will be organized into categories that measure either frequencies or consequences. 38
39 Pareto Diagrams (2) 39

40 Pareto Diagrams (3) 40
41 Pareto Diagrams (4) 41
42 Histograms (1) Histograms A graphical representation of how many times mutually exclusive events are observed in an experiment A special form of bar chart and are used to describe the central tendency, dispersion, and shape of a statistical distribution Unlike the control chart, the histogram does not consider the influence of time on the variation that exists within a distribution 42

43 Histograms (2) 43
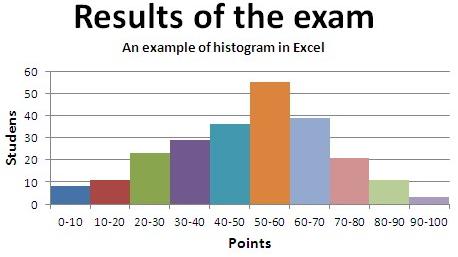
44 Histograms (3) 44
45 Control Charts (1) Control Charts Used to determine whether or not a process is stable or has predictable performance Upper and lower specification limits are based on requirements of the agreement They reflect the maximum and minimum values allowed There may be penalties associated with exceeding the specification limits Upper and lower control limits are different from specification limits The control limits are determined using standard statistical calculations and principles to ultimately establish the natural capability for a stable process The project manager and appropriate stakeholders may use the statistically calculated control limits to identify the points at which corrective action will be taken to prevent unnatural performance. Although used most frequently to track repetitive activities required for producing manufactured lots, control charts may also be used to monitor cost and schedule variances, volume, and frequency of scope changes, or other management results to help determine if the project management processes are in control. 45
46 Control Charts (2) 46
47 Control Charts (3) 47
48 Control Charts (4) 48
49 Scatter Diagrams (1) Scatter Diagrams Plot ordered pairs (X, Y) and are sometimes called correlation charts because they seek to explain a change in the dependent variable, Y, in relationship to a change observed in the corresponding independent variable, X The direction of correlation may be proportional (positive correlation), inverse (negative correlation), or a pattern of correlation may not exist (zero correlation) If correlation can be established, a regression line can be calculated and used to estimate how a change to the independent variable will influence the value of the dependent variable 49
50 Scatter Diagrams (2) 50

51 Scatter Diagrams (3) 51
52 Scatter Diagrams (4) 52
53 Scatter Diagrams (5) 53