USING EXPLORATORY FACTOR ANALYSIS IN INFORMATION SYSTEM (IS) RESEARCH
|
|
|
- Bertram Ferguson
- 5 years ago
- Views:
Transcription
1 USING EXPLORATORY FACTOR ANALYSIS IN INFORMATION SYSTEM (IS) RESEARCH Maria Argyropoulou, Brunel Business School Brunel University UK Dimitrios N.Koufopoulos Brunel Business School Brunel University UK Athanasios Nikas, University of Liverpool Abstract This paper is part of a field study that explored the impact of Information System implementation on Organisational Performance by examining the concept of IS effectiveness and by exploring how businesses arrive at the conclusion that the undertaking is successful or unsuccessful. Many statistical techniques have been used for the inference of conclusions. This paper will explain in brief the methodology followed and the exploratory factor analysis (EFA) conducted for the measurement of the construct if IS effectiveness. Following all tests on correlations and a number of extraction methods the final solution comprised 13 factors representing the independent variables and 4 factors representing the dependent variables. The results from our analysis provide insight into the IS evaluation field of research and provide new scales for the measurement of IS effectiveness ". Keywords: Exploratory Factor Analysis, Information System Effectiveness. 1 INTRODUCTION-PURPOSE OF THIS PAPER For the purposes of this research we can consider IS as 'an integrated, user machine system for providing which utilises computer hardware, software; manual procedures; models for analysis, planning control and decision making; and a database' (Davis and Olson, 1984). Many authors have addressed the question of IS/IT evaluation, and the literature in this area is large comprising various models and approaches (Delone and Maclean, 2002). There have been some field studies and case studies which have explored the influence of systems and have chosen various organizational performance measures for their dependent variable (eg DeLone and Mclean, 1992; 2002; Chang and King, 2005, Rai, Lang and Welker, 2002). These attempts, however, were not frequent because of the inherent difficulty to isolate the contribution of the systems from other contributors to organizational performance (DeLone and Mclean, 1992; 2002). The advances of technology have rendered this relationship an important concern for academics, IS practitioners and top managers. As a result the research interest in the field remains high and deserves further development and testing. The research in the Information Systems (IS) field has often been and is still being characterised as fragmented (Larsen, 2003; Chang and King, 2005; Wang and Liao, 2008) because of the multiplicity ARGYROPOULOU EL AL., 86
2 of the relevant constructs (DeLone and McLean 1992; Rai, Lang, & Welker, 2002) and the ambiguity of the concepts (Irani, 2008; Wang and Liao, 2008). This paper deals with the exploratory factor analysis conducted as the first step for a future exploration of the IS effectiveness construct. The remaining of the paper discusses the specific measures of IS effectiveness 2 THEORETICAL BACKGROUND The research is a based on a previously developed and tested model on IS effectiveness. Cha-Jan Chang & King, (2005) proposed the ISFS (Information Systems Functional Scorecard) and developed an instrument consisting of three major dimensions: systems performance, effectiveness and service performance (see table.1) These dimensions constituted the basic constructs for their field research. Systems performance: Measures of the systems performance assess the quality aspects of the system such as reliability, response time, ease of use, and so on, and the various impacts that the systems have on the user s work. Information effectiveness: Measures of the effectiveness assess the quality of in terms of the design, operation, use, and value provided by as well as the effects of the on the user s job. Service performance: Measures of service performance assess each user s experience with the services provided by the IS function in terms of quality and flexibility. Systems performance Impact on job Impact on external constituencies Impact on internal processes Effect on knowledge and learning Systems features Ease of use Information effectiveness Intrinsic quality of Contextual quality of Presentation quality of Accessibility of Reliability of Flexibility of Usefulness of Service performance Responsiveness Reliability Service provider quality Empathy Training Flexibility of services Cost/benefit of services Table 1 Sub-ISFS Constructs, adopted by Cha -Jan Chang and King, (2005). ARGYROPOULOU EL AL., 87
3 2.1 Operationalisation of measures The research used the scales empirically tested by Cha-Jan Chang & King, (2005). However, whenever possible, other previously developed items that had been empirically tested were used or adopted to enhance the validity and reliability of our instrument under development. Some newer measures were also developed from reviews of both practitioner and research literatures to reflect developments that have occurred subsequent to the development of the measures from which most items were obtained (e,g,, e-commerce, enterprise resource planning [ERP], etc). 3 METHODOLOGY Data for this study was collected by means of a questionnaire and a sample of 800 companies of different sizes operating in various industries. A web link was provided to the IT managers of the targeted companies who were considered to be the most knowledgeable respondents (Forza, 2002). This survey started on April 2010 with a pre-notification inviting the IT managers to participate in our research and a link to the survey was sent one week later with another cover letter. Two reminders were issued subsequently one week after the first call notifying those that had not responded of a forthcoming deadline for the closing of the questionnaire. We managed to collect 168 usable responses. 3.1 Data preparation prior to factor analysis Missing data and the assumption of normality were the starting issues as an integral part of the inferential analysis (Hair et al., 1998). From the data set overall we found decided there was no necessity to employ an imputation method to replace our missing data as these values were attributed to Non-Applicable answers Having completed the tests for normality we decided that there was no reason to transform the data as the identified departures from normality were slight and it was safe to continue the statistical analyses keeping the original data (Tabachnick and Fidell 1996) 4 FACTOR ANALYSIS A principle component analysis was followed seeking to obtain the minimum number of factors which were accounted for the maximum portion of the variance represented in the original set of variables (Hair et al, 1998). We adopted the latent root criterion, the scree test and the percentage of variance explained (Hair et al, 1998). The rationale of the latent root criterion or eignvalue or as alternatively known Kaiser s criterion is that any individual factor should account for the variance of at least a single variable and as such only the factors having eignvalues greater that 1 are considered significant (Hair et al, 1998).Varimax and promax rotation techniques were employed but the final decision favored promax. 137 items (111 items representing independent and 26 representing dependent variables) were factor analyzed using the principal components method and 21 factors were extracted (see fig 1). Table 2 shows that the Kaiser-Mayer-Olkin (KMO) Measure of Sampling Adequacy was 0.833, which is comfortably higher than the recommended level of 0.6 (Hair et al., 1998) and the Barlett s Test of Sphericity value was significant (i.e. the Sig. Value p=.000). A thorough examination of the weak factors followed and some of the them were excluded from the analysis. The new round of EFA provided us with 17 factors (see table 3). ARGYROPOULOU EL AL., 88

4 Table 2. KMO and Bartlett s Test for the factorability of variables KMO and Bartlett's Test Kaiser-Meyer-Olkin Measure of Sampling Adequacy. Bartlett's Test of Sphericity,833 Approx. Chi-Square 2,321E4 df 9453 Sig.,000 Figure 1 factors extracted from Varimax and Promax method employed 4.1 Assessing the scales Face validity was taken into account when the questionnaire was developed and the variables for inclusion had to correspond with the construct examined. The rationale for internal consistency is that the individual items of the scale should all be measuring the same construct and thus be highly intercorrelated (Hair et al, 1998). Cronbach alpha coefficient was used to assess the reliability of the scale s items used to assess internal consistency. Finally, correlation analysis was used for assessing the discriminant validity, which means that the scale sufficiently differs from other similar concepts (scales) and nomological validity was taken into account through a rigorous literature review. ARGYROPOULOU EL AL., 89
5 Table 3: The solution of 17 factors Total Variance Explained Component Initial Eigenvalues Rotation Sums of Squared Loadingsa Total % of Cumulative Total Variance % 1 47,049 42,008 42,008 25, ,281 8,287 50,295 30, ,783 6,056 56,351 28, ,415 3,942 60,293 28, ,797 3,391 63,684 29, ,729 2,437 66,120 20, ,510 2,241 68,361 24, ,116 1,889 70,250 20, ,875 1,674 71,924 10, ,817 1,622 73,547 24, ,648 1,471 75,018 16, ,603 1,432 76,449 13, ,463 1,306 77,755 2, ,376 1,228 78,984 2, ,251 1,117 80,101 5, ,189 1,062 81,162 2, ,126 1,006 82,168 6,607 Table 4: Reliability results for the 17 factors Factor No Cronbach a Factor No Cronbach a Factor Factor Factor Factor Factor Factor Factor Factor Factor Factor Factor Factor Factor Factor Factor Factor ARGYROPOULOU EL AL., 90
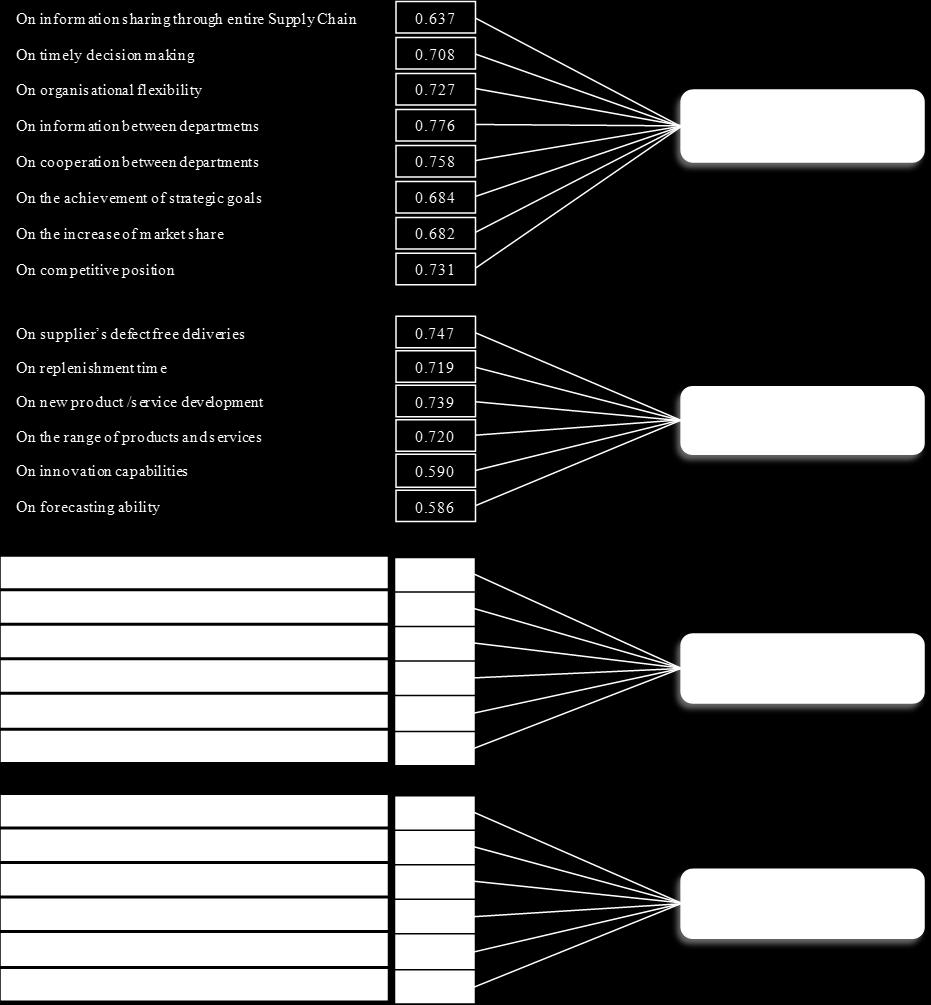
6 In total, the 17-factor solution explained % of the shared variance with factors 1and 2 explaining almost 50%. WE proceeded with the multicollinearity tests for all variables loading under one factor to perform collinerearity diagnostics that might have not been evident in the correlation matrix. We checked for two values: Tolerance and Variance Inflator Factor (VIF). Tolerance is an indicator of how much of the variability of one variable is not explained by the others and is accepted for less than 0.10 whereas VIF is the inverse of Tolerance value; the cut off point for determining the presence of multicollinearity is a VIF value larger than 10 (Palland 2005). All results were reassuring of the model fit and for this reason the 17 factors were kept and names were assigned to our new factors (fig 2-4). 5 CONCLUSION / CONTRIBUTION This article will prove useful to all researchers employing factor analysis and has the potential to set the trend for better use of EFA EFA is a commonly used technique for establishing the construct validity and construct equivalence of psychometric tests. This paper discussed EFA and the various decisions and techniques associated with the measures of Information System Effectiveness. The results from our analysis provide insight into the IS evaluation field of research and provide new scales for the measurement of IS effectiveness References Cha-Jan Chang, J. & King, W. R., "Measuring the Performance of Information Systems: A Functional Scorecard". Journal of Management Information Systems, Vol. 22, No. 1, pp Davis, G.B., & Olson, M.H Management Information Systems: Conceptual Foundations, Structure and Development. 2 nd ed. New York, NY: McGraw-Hill. DeLone, W.H. McLean, E.R., Information systems success: The quest for the dependent variable, Information Systems Research, Vol. 3, No.1, pp Forza, C. (2002). Survey research in operations management: a process-based perspective, International Journal of Operations & Production Management, Vol.22 (2) pp Hair, J.F., Anderson, R.E., Tatham, R.L., & Black, W.C. (1998). Multivariate Data Analysis with Readings. 5 th edition, Prentice Hall Inc. Pallant, J. (2007). SPSS Survival Manual: A Step by Step Guide to Data Analysis using SPSS for Windows (Version 15), McGraw-Hill England ISBN Rai, A., Lang, S.S. and Welker, R.B (2002) Assessing the validity of IS success models: An empirical test and theoretical analysis, Information Systems Research 13 (1) (2002), pp Tabachnick, B.G. and Fidell, L.S. (2007). Using Multivariate Statistics. 5th ed. Pearson Education, Inc., New York, NY, U.S.A. Thong, J.Y.L. and Yap, C.S. "Information systems effectiveness: a user satisfaction approach," Information Processing and Management, 32, 5 (1996), pp ARGYROPOULOU EL AL., 91

7 Figure 2 Figure 3 ARGYROPOULOU EL AL., 92

8 Figure 4 ARGYROPOULOU EL AL., 93
9 ARGYROPOULOU EL AL., 94