Benchmarks. What does good really look like? How can you use them to drive change? Copyright 2018
|
|
|
- Aubrie Bridges
- 5 years ago
- Views:
Transcription


1 Benchmarks. What does good really look like? How can you use them to drive change?
2 Key Premise: Metrics = Coaching Tips Tell stories Highlight best practices Best used interactively with teams Use to drive coaching tips NOT Thou Shalt Not good vs. bad thresholds.


3 Source: ADVIZOR market surveys & client data; see for detailed reports. What s Measured is Not Helping Major Giving Annual Giving Fundraisers are measuring outcomes & activities, not drivers. Has this helped? < 1 in 3 < 1 in 6 Has this helped?
4 1. Measuring Performance Drivers, not just Activities & Outcomes 2. Measuring over a reasonable Time Period o What Matters Consistent; not cyclical; long enough for stuff to bake (generally not FY) 3. Comparing against Benchmarks that are both Cross-Organization to your Peers, and also Across Your Team within your Organization 4. Benchmarking to the Top Quartile, not the Average 5. Metrics and Benchmarks that are Consistently Measurable and Detailed 6. Using Metrics to draw out Stories and Best practices, and the discussions and insight that can drive improvement

5 The Problem: Most Teams Focus On Development Officer Activities Across Fiscal Year Periods
6 Better if Across a Standard Time Period for example, LTM* * LTM = Last 12 Months
7 Graphical Display Helps to Draw out Stories & Best Practices


8 Unique Visits is Better What s up with John Brown
9 But Is This Strategic??? Development Officer Activities vs. Prospect Cultivation
10 Let s Shift the Focus: 5 Strategic Metrics 1. Prospect Assignments: Are all of our highest capacity and most engaged prospects staffed? Are pools reasonably sized? 2. Penetration: Is our pool of assigned prospects being connected with? 3. Movement: Are we moving prospects forward at a reasonable pace? 4. Solicitation Levels: Are our asks at the right level relative to capacity and attachment? 5. Yield: Are we closing solicitations at an aggressive level?
11 We Suggest: 5 Strategic Metrics 1. Prospect Assignments: Are all of our highest capacity and most engaged prospects staffed? Are pools reasonably sized?
12
 Attachment")
13 Finding the Top Prospects (4 Quadrants) Attachment Capacity

14 Portfolio Size & Balance
15 We Suggest: 5 Strategic Metrics 1. Prospect Assignments: Are all of our highest capacity and most engaged prospects staffed? Are pools reasonably sized? 2. Penetration: Is our pool of assigned prospects being connected with? 3. Movement: Are we moving prospects forward at a reasonable pace? 4. Solicitation Levels: Are our asks at the right level relative to capacity and attachment? 5. Yield: Are we closing solicitations at an aggressive level? Use case.
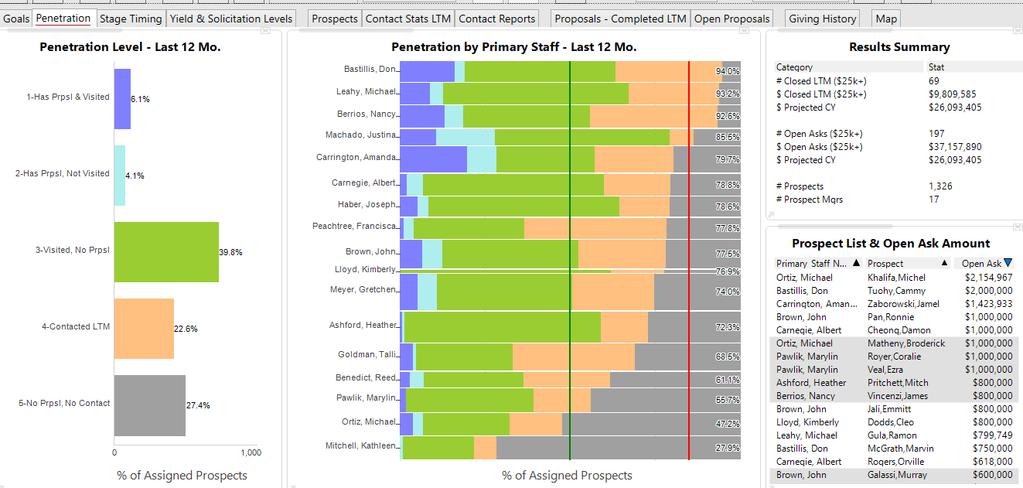


16 Penetration Click to Select Michael Uncovered Prospects


17 Uncovered Prospects in Michael s Portfolio Penetration Many are disconnected ; Looks like the portfolio should be rebuilt!!
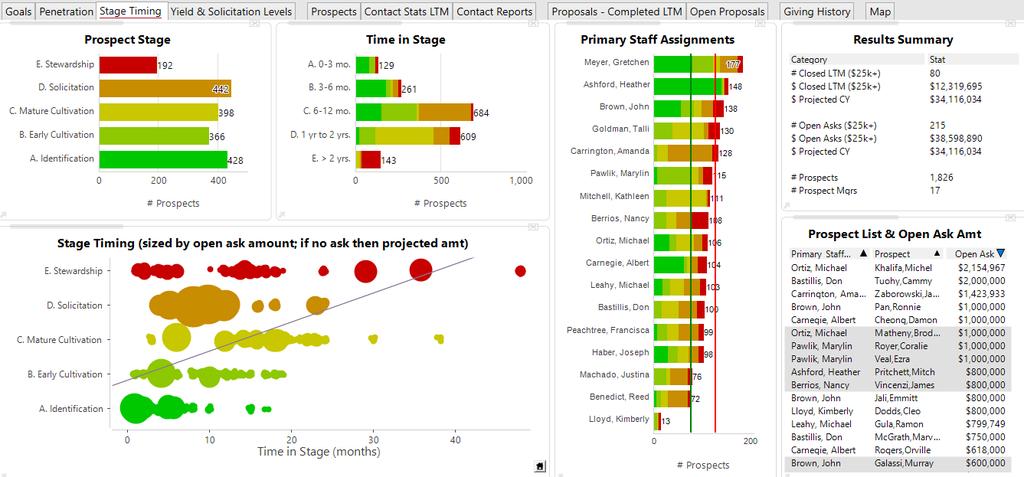
18 Movement


19 Movement Click to select 18+ months in Mature Cultivation Heavy concentration with Kathleen
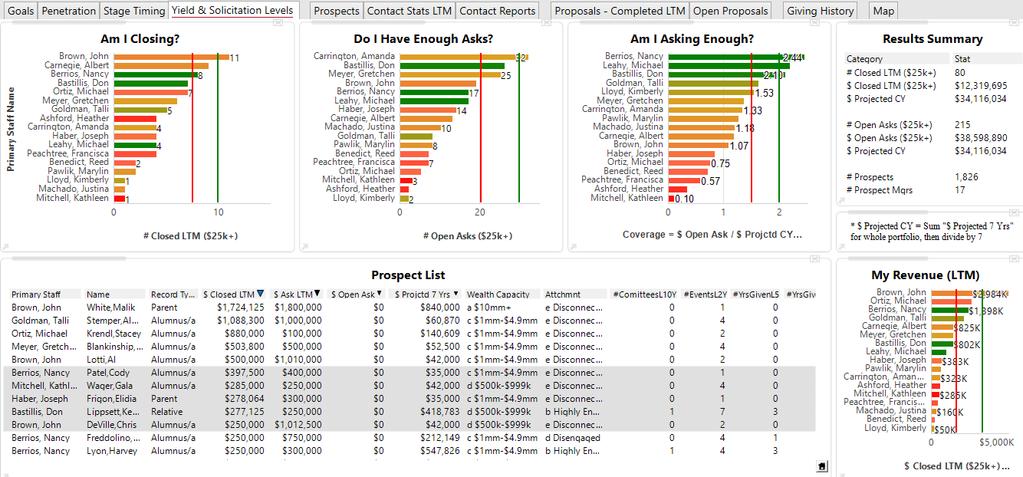
20 Yield and Solicitation
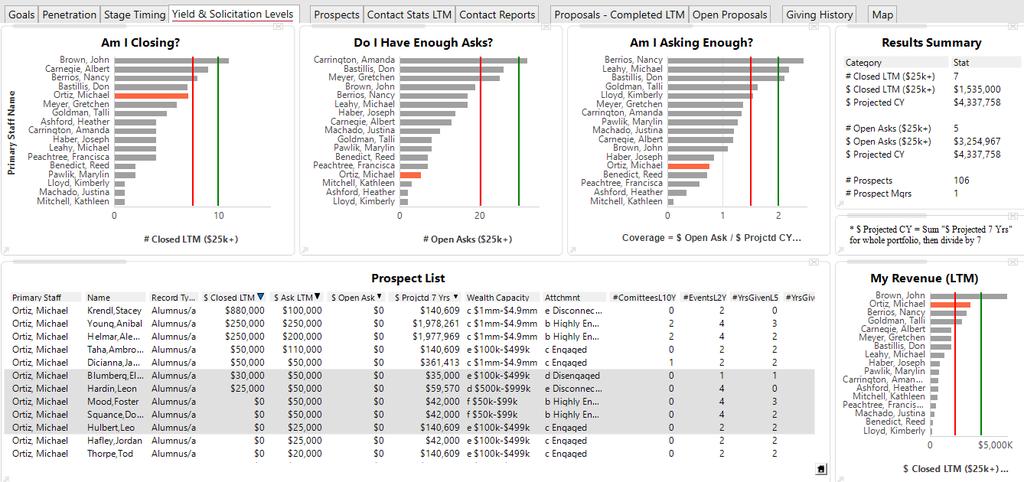


21 Yield and Solicitation Michael had strong Last Twelve Months. But not set up well for next 12 months.


22 Yield and Solicitation This is the make or break part of his portfolio.
 Efficient movement through stages")

 75 to 120 in-person visits in LTM*** Proposal Portfolio (by Dev.")
23 Performance Benchmarks Per Development Officer* (stable program): Summary Stats active prospects 80%+ Penetration (at least 80% of assigned prospects contacted in LTM; 50%+ of prospects visited and/or actively solicited) Efficient movement through stages (typically < 6 months in qualification, < months cultivation, <12 months solicitation) ~25 active proposals at any one time 2 3x Ask vs. $ Projected CY Σ Actual Ask Amount / Σ $ Projected CY** for each DO pool 8 to 10 Solicitations closed in LTM (20-30% of Asks are closed) 75 to 120 in-person visits in LTM*** Proposal Portfolio (by Dev. Officer) * After first year ramp up; Higher Ed focus, other sectors will vary ** $ Projected CY is calculated as capacity * attachment / liquidity *** LTM = Last Twelve Months.
24 Driving Change 1. Structure. 2. People. 3. Information. 4. Process. 5. Culture. Senior Leadership Driven Heroes (informal leaders) On Board Success Stories Promoted Performance Drivers Measured Reward & Training Systems Support Performance Drivers Monthly Touchpoints with Performance Driver Discussions Team Meets in War Room with I Wonder Questions Transparency & Openness Listen & Adjust Stay With It Results Take Time (avoid Fatigue!) References: Harvard Business School, Bain & Co., Booz Allen
25 Creating a Culture of Analytics 1. Senior Management believes it will have benefits 2. Push out to the team 3. War Room 4. Ask the right questions based on what you see I wonder questions 5. Highlight and promote results
26 Using Metrics Stories, Coaching Tips & Best Practices Use metrics to uncover Stories and find Best Practices and Coaching Tips Which are shared and discussed openly with the team. Reviews Set Development Officer Operating Plans annually Plans focus on portfolio strategies and performance drivers Group discussion of best practices; team works to improve subpar performance Reviewed formally with DO s preferably 6-12x / year Data If it s not in the system it didn t happen Never perfect; use what you have Continual improvement
27 Example of Results: Year 1 Data in system Abundant optimism Cultural shift 1/3 Got it 1/3 Not sure 1/3 Confused Changes in behavior Baseline established
28 Results: Year 2 More visits (32% increase) More individuals visited (28% increase) More proposals presented (154% increase) Higher value of proposals (95% increase) Record # of 7 figure gifts; over all higher level of performance Revenue up 30% Average days to file contact report declined
29 Other Resources: Key Metrics in Major Giving Key Metrics in Annual Giving Creating a Culture of Analytics How Many Prospects Should be Assigned to a Major Gift Officer Discussion Follow-up: Doug.Cogswell@AdvizorSolutions.com
30 Annual Giving
31 Strategic Metrics 1. Participation. Am I growing my donor base over time? 2. Donor Stability. Once I acquire a donor, how good of a job am I doing at keeping him/her? When donors lapse do I do a good job of getting them back? 3. Non-Donor Acquisition. How am I determining who to appeal to in the first place? What characteristics best describe who is likely to make a gift? Demographic / psychographic characteristics? Engagement? Patient or student or membership experience? 4. Appeal Yields. Is my messaging connecting with my constituents? Which messages with which segments? Which sub-segments? Am I using the right media to reach them? What time of year? 5. Touchpoints. Am I soliciting with the right frequency? Am I getting my higher touch appeals to the right people often enough? 6. Avg. Gift Size & Trends. Are my donors giving more over time? At the right amounts? Do people in wealthy zip codes with strong demographic / psychographic characteristics give more than others?
 retention of current donors, and (2)")

32 1. Participation. 2. Donor Stability. (driven by two things: (1) retention of current donors, and (2) reacquisition of lapsed) 3. Non-Donor Acquisition. Don t always send to everyone!! 4. Appeal yields. 5. Touchpoints. Performance Benchmarks - Goal: Increase # donors each year 6. Avg. Gift Size &Trend.
33 Other Resources: Key Metrics in Major Giving Key Metrics in Annual Giving Creating a Culture of Analytics How Many Prospects Should be Assigned to a Major Gift Officer Discussion Follow-up: Doug.Cogswell@AdvizorSolutions.com