Dr Helen Bewley. Ana Rincon-Aznar David Wilkinson. January 2014
|
|
|
- Quentin Bell
- 5 years ago
- Views:
Transcription
1 AN ASSESSMENT OF THE CHANGING USE OF FLEXIBLE EMPLOYMENT AND IMPLICATIONS FOR THE NATIONAL MINIMUM WAGE, INCLUDING COMPLIANCE Helen Bewley Ana Rincon-Aznar David Wilkinson January 2014 Contact details: Dr Helen Bewley NIESR 2 Dean Trench Street Smith Square London SW1P 3HE Telephone: h.bewley@niesr.ac.uk 1
2 CONTENTS Executive Summary 8 Aims 8 Data 8 Methods 8 Results 9 Policy implications 9 1. Introduction Aims Motivation Background The likely association between flexible employment practices and the NMW Annual-hours contracts/compressed hours/term-time only contracts Zero-hours contracts Shift-working Homeworking Flexitime/Changing the pattern of working hours Job-sharing/Reduced hours/part-time employment Fixed-term and temporary contracts/agency workers Self-employment Concluding remarks Data Overview WERS The survey sample Indicators of low-pay Indicators of flexible employment Indicators of the impact of the recession Control variables LFS The survey sample Indicators of low-pay Indicators of flexible employment Control variables Methods 23 2
3 3.1. Overview WERS Calculating average hourly pay Calculating the proportion of employees paid the NMW or below Identifying low-paying workplaces Comparison of Survey of Employees- and Survey of Managers-derived indicators of low-pay Comparison groups Non-compliance LFS Local area analysis Non-compliance Descriptive analysis WERS Average pay in low-paying private sector workplaces Prevalence of flexible employment practices and changes over time Changes in the prevalence of flexible employment practices in surviving workplaces since the introduction of the NMW Combinations of flexible employment practices Changes in the use of flexible employment since the introduction of the NMW Workplace closures following the introduction of the NMW and the impact of the recession LFS Prevalence of flexible employment and changes over time Flexible employment by gender Flexible employment by age Flexible employment by earnings Flexible employment by qualification level Flexible employment by sector Multivariate analysis results WERS Tracking flexible employment and pay levels over time Changes in flexible employment over time Employees use of flexible employment in The impact of the recession, flexible employment and pay levels Workplace closures 76 3
4 Non-compliance LFS Estimates of the use of flexible working time arrangements Estimates of the use of flexible employment practices Estimates of the use of temporary employment Estimates of non-compliance with the NMW Summary and conclusions Summary of results Conclusions and policy implications References Appendix 93 Using measures of flexible employment from the Survey of Employees 93 4
5 LIST OF FIGURES AND TABLES Figure 1 Distribution of usual weekly pay, Figure 2 Usual weekly hours, Figure 3 Usual weekly hours by usual weekly pay, Figure 4 Percentage of eligible employees paid NMW or less, by occupation, Figure 5 Percentage of eligible employees paid NMW or less, by industry, Figure 6 Number of eligible employees paid NMW or below by number of eligible respondents, Table 1 Comparison of the identifiers of low-paying workplaces, Figure 7 Ranking of industries on each measure, Figure 8 Comparison of ranking of industries, derived from Survey of Managers (SM) and Survey of Employees (SE) Figure 9 Changes in percentage of employees working for private sector workplaces where some employees use flexible employment practices between 1998 and Figure 10 Changes in percentage of employees working for private sector workplaces where some employees use flexible employment practices between 2004 and Figure 11 Percentage of employees working for continuing private sector workplaces with flexible employment practices in 1998 and Figure 12 Percentage of employees working for continuing private sector workplaces with flexible employment practices in 2004 and Table 2 Percentage of employees working for low-paying or higher-paying private sector continuing establishments with flexible employment practices in 1998 and Table 3 Percentage of employees working for low-paying or higher-paying private sector continuing establishments with flexible employment practices in 2004 and Table 4 Percentage of employees working for low-paying private sector establishments with flexible employment practices, Table 5 Percentage of employees working for higher-paying private sector establishments with flexible employment practices, Table 6 Percentage of low-paying private sector workplaces with flexible employment practices closing between 1998 and Table 7 Percentage of higher-paying private sector workplaces with flexible employment practices closing between 1998 and Figure 13 Percentage of employees working for low-paying private sector workplaces where the recession adversely affected the workplace A great deal, by flexible employment practices Table 8 Percentage of workers using flexible employment practices, Table 9 Percentage of workers using flexible employment practices , by gender Figure 14 Percentage of workers using flexible employment practices , by age group 55 Figure 15 Breakdown of temporary work , by age group Figure 16 Incidence of flexible working time arrangements , by age group
6 Figure 17 Percentage of workers using flexible employment practices , by earnings.. 58 Figure 18 Breakdown of temporary work , by earnings Figure 19 Incidence of flexible working time arrangements , by earnings Figure 20 Percentage of workers using flexible employment practices , by qualification level Figure 21 Breakdown of temporary work , by qualification level Figure 22 Incidence of flexible working time arrangements , by qualification level Figure 23 Percentage of workers using flexible employment practices , by sector Figure 24 Breakdown of temporary work , by sector Figure 25 Incidence of flexible working time arrangements , by sector Table 10 Percentage of employees working in low-paying and higher-paying workplaces with flexible employment practices, Table 11 Changes in the percentage of employees in low-paying and higher paying workplaces with flexible employment practices Table 12 Changes in the percentage of employees in low-paying and higher paying workplaces with flexible employment practices Table 13 Use of flexible employment practices by pay-level, Table 14 Percentage of employees working for low-paying workplaces adversely affected a great deal by the recession, by whether any employees using flexible employment practices in Table 15 Percentage of employees in low-paying and higher-paying workplaces which closed between 1998 and 2004, by use of flexible employment practices Table 16 Percentage of employees in low-paying and higher paying workplaces which closed between 2004 and 2011, by use of flexible employment practices Table 17 Percentage of employees working for establishments which paid at least some employees less than the NMW, by use of flexible employment practices, 2004 and Table 18 Estimates of the use of flexible working time arrangements Table 19 Estimates of the use of flexible employment practices Table 20 Estimates of the use of temporary employment Table 21 Estimates of non-compliance Figure 26 Changes in percentage of employees in private sector workplaces reporting availability of flexible employment practices between 2004 and Table 22 Employee reports of availability and use of flexible employment practices
7 ACKNOWLEDGEMENTS The authors acknowledge the Department of Trade and Industry, the Economic and Social Research Council, the Advisory, Conciliation and Arbitration Service and the Policy Studies Institute as the originators of the 1998 Workplace Employee Relations Survey data and the 2004 Workplace Employment Relations Survey data. The Department for Business, Innovation and Skills, Advisory, Conciliation and Arbitration Service and National Institute of Economic and Social Research are also acknowledged as originators of the 2011 Workplace Employment Relations Study data. The Data Archive at the University of Essex is acknowledged as the distributor of the data. The National Centre for Social Research was commissioned to conduct the survey fieldwork on behalf of the sponsors. None of these organisations bears any responsibility for the analysis and interpretation of the data by the authors. This work contains statistical data which is Crown Copyright; it has been made available by the Office for National Statistics (ONS) through the Low Pay Commission (LPC). The ONS, nor the LPC bear any responsibility for the analysis or interpretation of the data reported here. This work uses research datasets that may not exactly reproduce National Statistics aggregates. 7
8 Aims EXECUTIVE SUMMARY The purpose of this report is to describe changes over time in the use of flexible employment and to examine the relationship between these changes and the National Minimum Wage (NMW). It also aims to consider how the use of flexible employment has changed during the recent economic downturn and the potential implications of this for the NMW. Finally, it assesses how compliance with the NMW varies with the incidence of flexible employment. Data The report is based on analysis of the 1998, 2004 and 2011 Workplace Employment Relations Studies (WERS) and the Labour Force Survey. The frequency of the LFS means that it provides detailed information on changes in working patterns over time, capturing annual differences between the points observed in WERS. The report analyses LFS data from 1998 to 2013, although in some cases consistent data items are only available over a shorter time-period. Whilst the LFS covers the whole workforce, including the self-employed, WERS only covers employees. However, as WERS contains linked data from the perspectives of both the manager responsible for employment relations and employees within the same workplace, it gives a more detailed picture of circumstances within workplaces. The perspectives offered by the LFS and WERS are complementary and make it is possible to build up a more complete picture of the interactions between flexible employment and other employment practices, including low-pay and experiences during the recession. As WERS is a survey of British workplaces, the LFS analysis presented in this report also excludes Northern Ireland. Methods The basic approach in the LFS analysis was to explore the relationship between the share of workers in each local labour market using each type of flexible employment practice and the bite of the NMW (as measured by the Kaitz index, which is the ratio of the NMW to the median hourly wage) within that area. Wage variations between areas mean that some will be more strongly affected by the NMW than others, and so it is possible to examine whether flexible employment practices are more common in areas where the bite of the NMW is greater. The LFS analysis of non-compliance is also based on local area models. In both cases, the analysis was carried out within a regression framework to control for features of the local area that might affect the association between pay levels and the use of flexible employment practices. The analysis of WERS compares the use of flexible employment in workplaces which were most likely to be affected by the NMW (due to having a high proportion of low-paid employees) with that in workplaces which offered slightly higher wages. A descriptive analysis was used to compare potential ways of identifying those workplaces most likely to be affected by the NMW and to ensure that the choice of definition was unlikely to affect the findings of the multivariate analysis. The comparison group was identified based on the number of employee respondents who were paid up to 20 per cent of the wage distribution more than the NMW, whilst also having no respondents who appeared to receive the NMW or less. The analysis of WERS explores how the association between flexible employment and pay levels changed over time and controls for a range of workplace and workforce characteristics within a regression framework. 8
9 Results The analysis of WERS and the LFS suggest that increases in the use of flexible employment over time have been largely due to factors other than the introduction of the NMW. There is also only limited evidence that the impact of the recession on those workplaces most likely to be affected by the NMW was in any way related to their use of flexible employment practices. Whilst low-paying workplaces with some employees on fixed-term or temporary contracts were less likely to be adversely affected, there was little evidence that the survival prospects of lowpaying workplaces were related to their use of flexible employment practices over the period since the introduction of the NMW. There is therefore little reason to believe that the use of flexible employment practices by NMW-affected workplaces has determined their ability to weather the recession. Finally, there is some evidence that compliance with the NMW varied with the use of flexible employment practices. Non-compliance was more likely where there was some use of shiftworking or employees worked part-time and lower where some employees worked compressed hours, worked at home, or where agency workers were used. Whilst qualitative research may be needed to better-understand the reasons for these observed associations, the findings suggest that there may be value in targeting the monitoring of compliance at workplaces with the types of flexible employment practices associated with a greater likelihood of noncompliance i.e. those with shiftworkers and a greater proportion of part-time workers. Workplaces with agency workers or employees working compressed hours or at home may be less of a cause for concern, unless there are other reasons to suspect individual workplaces of failing to comply with the NMW. Policy implications The analysis has suggested that those employers that historically have been most likely to be affected by the NMW have not tended to respond to its introduction or uprating by adjusting their use of flexible employment practices. Whilst there is a some evidence that the impact of the recession on low-paying workplaces has varied with the use of flexible employment practices, their survival does not appear to be related to their use of such arrangements. This implies that, within those workplaces that are most likely to be affected by the NMW, there is little reason to regard flexible employment practices as a potential route to increasing the likelihood of workplace survival. At the same time, there is no reason to regard them as something that might put a workplace in jeopardy. Finally, given scarce resources for ensuring compliance with the NMW, the knowledge that, regardless of other workplace and workforce characteristics, workplaces that use particular types of flexible employment are more, or less, likely to adhere to the NMW may allow the targeting of any monitoring activity at those workplaces most likely to fail to comply with the NMW. 9
10 1.1. Aims 1. INTRODUCTION This report describes changes over time in the use of flexible employment practices by employers and examines the relationship between these changes and the National Minimum Wage (NMW). It also considers how the use of flexible employment has changed during the recent economic downturn and the potential implications of this for the NMW. The report describes the measures developed to identify the impact of the NMW and the likely robustness of these indicators, as well as reporting on the descriptive and multivariate analysis of the key variables. In addition, it assesses how compliance with the NMW varies with the incidence of flexible employment Motivation Past research on minimum wages has failed to find consistent evidence of adverse employment effects, particularly in the UK (Neumark and Wascher, 2006; Dolton and Rosazza Bondibene, 2011; Dickens et al. 2009) and so this report explores an alternative type of response by businesses. Employers may have responded to the wage rigidity imposed by the NMW by seeking to change the way in which work is organised. Some types of numerical flexibility are thought to make it easier for employers to adjust staffing levels to fluctuations in demand e.g. by employing part-time workers to supplement a full-time labour force during periods of high demand. Indeed, Stewart and Swaffield (2008) found that the introduction of the NMW resulted in a reduction of between one and two hours a week in total and basic hours for low-paid workers. Also, some groups of workers experienced a reduction in hours in response to larger increases in the NMW in 2001 and 2003 (Dickens et al. 2009). This suggests that some employers have responded to the higher hourly staffing costs resulting from the NMW by using flexible employment practices which allow them to vary the hours worked by staff. This report moves beyond the previous focus simply on hours worked to assess the evidence that a range of atypical working arrangements have assisted employers in implementing the NMW. The report also assesses the implications of flexible employment for compliance with the NMW. The increased variation in hours worked over the pay reference period which can come with some types of flexible employment, such as zero-hours contacts, may make it more difficult to ensure that employers are complying with the NMW. For example, Bessa et al. (2013) found that within the domiciliary care sector, in some periods employees on zero-hours contracts were more likely to be paid less than the NMW than those on other types of contracts. There is a danger that flexible employment results in employers either intentionally or unintentionally failing to meet their obligations to pay the NMW and so this report explores levels of compliance by employers who make use of different types of flexible employment Background The incidence of flexible employment has increased over the period since the introduction of the NMW in April According to the Workplace Employment Relations Study (WERS) series, between 1998 and 2004 the percentage of workplaces with 10 or more employees with some part-time employees rose from 79 per cent to 83 per cent (Kersley et al. 2005: 8). There was also an increase in the proportion of workplaces that survived for the whole of this period that used annual-hours contracts, zero-hours contracts, flexitime, job-sharing and homeworking for some non-managerial employees (Kersley et al. 2005: 29). Over the period from 2004 to 2011 there was an increase in the proportion of workplaces with five or more employees where some staff worked shifts, annual-hours, had zero-hours contracts or worked at or from home. However, there was no change in the proportion of workplaces with some employees on temporary or 10
11 fixed-term contracts, or employed agency workers, over either period, and the proportion of workplaces with any part-time staff, or some employees working flexitime, also remained unchanged, whilst the proportion of workplaces where some employees were able to job-share fell (van Wanrooy et al. 2013a: 10, 32). On the face of it, these figures imply an increase in the incidence of flexible employment between 1998 and 2004, which tailed off between 2004 and However, there were clear differences between the public and private sectors in the availability of flexible employment in 2004 (Kersley et al. 2006: 269) and so further analysis is needed to understand whether the patterns observed in aggregate figures (and when including workplaces with between five and nine employees in the later period) are also evident when comparing changes within sectors using a consistent workplace size threshold over time. An association between the introduction of the NMW and the incidence of flexible employment might be expected because arrangements which give employers flexibility over staffing levels (known collectively as numerical flexibility) can reduce labour costs by allowing employers to adjust the size of the workforce in line with fluctuations in demand, on an hourly, daily, weekly, monthly or annual basis. In addition, flexibility over the location of work, such as homeworking, which is facilitated by technological developments, may result in savings for employers on the cost of office space. Flexible employment may therefore be used to offset higher hourly wages resulting from the introduction and subsequent uprating of the NMW. Increases in the incidence of flexible employment over time have implications for the NMW, as if employers are able to use flexible employment to deploy staff more effectively and to reduce labour costs, this can increase their ability to accommodate minimum wage increases and in turn comply with the NMW. However, the advantages of using flexible employment to access the skills of a larger number of staff for fewer hours may reduce earnings for individual staff members. Since the introduction of the NMW, legislation has been introduced in a number of areas to ensure that those working flexibly have similar employment protection to full-time, permanent employees i.e. the Part-time Workers Regulations (2000), the Fixed Term Employees Regulations (2002) and the Agency Worker Regulations (2010). Such regulations may have offset some of the disadvantages that such practices can present for the workforce. On the other hand, the increased regulation of flexible employment may have reduced some of the advantages that such practices offer to employers by raising labour costs and placing them under greater legal obligations. For example under the Right to Request Flexible Working (introduced in 2003), the employer has to be able to demonstrate that they have seriously considered a request by employees with dependent children, or caring for a friend or family member, and only rejected the request where the business would be damaged by allowing the employee to work flexibly. If complying with greater legal requirements in the field of flexible employment increases the costs associated with the use of such practices, this may make it more difficult for employers to use such arrangements to offset the costs of the NMW and in turn affect compliance with the NMW. The legal rights that employees now have to request flexible employment also make it difficult to establish whether employers have introduced flexible employment in order to reduce labour costs, possibly in response to the introduction of the NMW, or to comply with legal requirements. As a result, any analysis of the link between the introduction and subsequent uprating of the NMW and flexible employment has to consider the impact of changes in external factors regulating the use of flexible employment e.g. by comparing changes within workplaces which have a higher proportion of staff paid at, or around, the NMW with those within workplaces where hourly pay rates are higher. 11
12 Turning to the impact of the NMW during an economic downturn, Dickens and Dolton (2011) did not find any evidence that upratings for low-paid workers by the Wages Councils through the recessions of the 1980s and 1990s had a negative impact on employment. However, hours did appear to be cut to offset higher wages. They also noted the difficulties of making predictions about the impact of upratings given that economic downturns, and their impact on particular sectors, are likely to vary. Hogath et al. (2009) considered the likely impact of the recession on equality, including the impact of men entering part-time employment in greater numbers and job cuts resulting in pressure on remaining employees to work longer hours. This report adds to previous analysis by considering whether the recession had a more pronounced impact in low-wage workplaces compared to those where wages were higher and whether the use of flexible employment has reduced the negative impact of the recession on low-wage workplaces The likely association between flexible employment practices and the NMW Whilst the focus in this report is on whether employers use flexible employment practices to offset the costs of implementing and uprating the NMW, it is apparent that some types of flexible employment are more likely to result in reduced costs for employers, whilst others may increase costs. In other cases, the likely impact of the practice on employer costs may be ambiguous as it depends on the way in which the practice is implemented. This section considers the likelihood that each of the different types of flexible employment practices considered in this report would have a bearing on employer costs and the expected relationship with the introduction and uprating of the NMW Annual-hours contracts/compressed hours/term-time only contracts Annual-hours contracts, compressed hours and term-time only contracts are somewhat similar in that employees work a pattern of hours which can be unevenly distributed over time. They might potentially offset any increase in labour costs following the introduction or uprating of the NMW by improving retention or the need for redundancies, reducing running costs and matching production to fluctuations in demand. There may be cost savings for employers if the use of annual hours contracts makes it possible to limit the times when employees are able to take leave and meet demand at peak times without the need to employ additional staff. In addition, the ability to reduce capacity at times of low demand (as may be the case with both annual hours contracts and compressed hours) can reduce operating costs and the need to make redundancies and thus lose skilled employees. In some cases compressed hours are designed to suit the needs of individual employees and therefore mainly seek to reduce the costs of labour turnover. Term-time only contacts can be used for similar reasons e.g. to retain employees with childcare responsibilities, or because there is less need for staff outside of school term-time Zero-hours contracts Where an employer uses zero-hours contracts they are not committed to paying staff unless they are actually required. Employers may introduce zero-hours contracts to offset any increase in labour costs arising from the introduction or uprating of the NMW Shift-working Employers can use shifts to match supply to demand and increase the length of the working day. The assumption is that the loss of forgone sales would be greater than the costs of employing additional employees in order to staff extra shifts. It seems unlikely that the introduction or uprating of the NMW would encourage employers to introduce shift-working, as if the cost of 12
13 forgone sales remained the same, whilst hourly labour costs rose, the case for shiftworking would be reduced Homeworking Homeworking can take a number of different forms and entail different levels of investment by employers. For example, in some cases, employees may be able to choose whether, and when, to work at home, but may be expected to bear any associated costs, whereas at the other end of the spectrum the employee is entirely home-based, but the employer pays set-up costs, and any costs associated with monitoring the employee. In either case, homeworking may produce savings as a result of the reduced need for office or factory space which could offset any increase in labour costs arising from the introduction or uprating of the NMW. Allowing employees to work at home may also enable the employer to retain staff who might otherwise be likely to change employer because of distance from the workplace or difficulties managing caring responsibilities Flexitime/Changing the pattern of working hours Flexitime can cover a whole range of practices which give employees some flexibility over their working hours. In some cases employees may have complete discretion over when they work, whilst in others they may be expected to work core hours, with limited flexibility over start and finish, or break, times. It can also encompass practices such as staggered working hours, where the employee has an arrangement to start and finish their working day to an earlier or later pattern. The ability to change working hours implies a longer-term adjustment to the pattern of working times. Where the employer is able to design a flexitime scheme, or adjust working hours around their needs to meet peaks in demand, this could potentially offset an increase in costs arising from the introduction or uprating of the NMW Job-sharing/Reduced hours/part-time employment Job-sharing may benefit an employer by giving them access to complementary skills which would not be found in a single person. Allowing employees to reduce their hours, or share a job, may be motivated by a desire to retain key staff and so also avoid the costs of labour turnover. The employment of part-time staff may also assist in maximizing the skills mix as well as matching fluctuations in demand. Therefore, the introduction and uprating of the NMW could conceivably have induced employers to make greater use of job-sharing, reduced hours, or parttime contracts Fixed-term and temporary contracts/agency workers Employers seeking to reduce their liabilities as a result of the introduction and uprating of the NMW may use fixed-term and temporary contracts, as well as agency workers to ensure that staff are only employed for as long as there is sufficient income to pay their wages. These arrangements also give the employer the ability to fill skills-gaps without making a longer-term commitment to provide employment Self-employment As self-employed workers are not covered by the NMW, it is possible that following the introduction and uprating of the NMW there would be an incentive for low-wage employers to increase the amount of work subcontracted to self-employed workers Concluding remarks It is difficult to develop firm hypotheses about the expected relationship between each of the main types of flexible employment and the introduction and uprating of the NMW because even 13
14 practices with the same name can be implemented in very different ways. In some cases the method of implementation is clearly designed to favour the employer, whilst in other cases the objective is to retain employees. Given that the precise manner in which each practice is implemented has a strong bearing on whether it is beneficial for the employer or employee, it is therefore extremely difficult to hypothesise about the likely association between each type of flexible employment practice and the introduction and uprating of the NMW. Finally, it is possible that employees self-select into using practices that are beneficial, or at least tolerable, for them. Even where flexible employment practices appear to favour the employer, there may be circumstances in which they are beneficial for the employee. This means that it is uncertain whether a shift towards particular types of flexible employment as a result of the introduction and uprating of the NMW will have had either negative or positive consequences for employees. For this reason it is difficult to reach a judgement about the desirability of each of the types of flexible employment considered in this report. 14
15 2.1. Overview 2. DATA This report uses the 2004 and 2011 British WERS to explore changes in the incidence of flexible employment over time in those workplaces most likely to be affected by the NMW. These datasets provide very detailed linked information on workplaces, and employees within each workplace, giving a full picture of the availability of flexible employment, pay, hours, employee characteristics and the circumstances in which the workplace operates. WERS 1998 is used to supplement the analysis, as it provides information on the period before the introduction of the NMW. Whilst changes in question wording between 1998 and 2011 mean that consistent information is only available on a limited subset of flexible employment practices over the whole of this period, it is possible to assess changes in comparable measures between 1998 and 2004 using the Panel Survey. Alongside the analysis of WERS, the Labour Force Survey (LFS) is used to provide information on the incidence of various forms of flexible employment in Britain 1. It covers: numerical flexibility e.g. permanent versus temporary work; formally-arranged flexibility over working time e.g. flexitime, job-sharing and term-time only working; less formally-arranged flexibility over working time e.g. overtime; flexibility over the location of work e.g. working from home. The frequency of the LFS means that it provides detailed information on changes in working patterns over time, capturing changes from one year to the next and therefore between the points observed in WERS. The LFS includes information on the earnings of employees, so it is possible to assess the relationship between earnings and the use of flexible employment. Insofar as is possible, this report analyses LFS data from 1998 to 2013, although in some cases consistent data items are only available over a shorter time-period. Whilst the LFS covers the whole workforce, including the self-employed, WERS only covers employees and gives a more detailed picture of circumstances within workplaces. Therefore, the LFS provides information on a wider range of types of flexible employment than WERS, whilst WERS provides more detailed information on workplace characteristics. These two perspectives are complementary and make it is possible to build up a more complete picture of the interactions between flexible employment and other employment practices, including low-pay and experiences during the recession. The difficulties of obtaining an accurate measure of noncompliance in WERS (described in section 3.2.6) means that the LFS is likely to provide a more reliable source of information on this topic. On the other hand, WERS may give greater insight into practices that are only used by a small proportion of employees, as it is possible to explore whether managers make these practices available to any employees within a workplace, rather than only focusing on the subset of employees within the sample who currently use such arrangements. The report considers the impact of the NMW on the following outcomes: i) the proportion of the workforce in part-time employment; 1 Whilst the LFS covers the whole of the UK, WERS does not cover Northern Ireland and so the analysis presented in this report focuses on Britain. 15
16 ii) the proportion of the workforce in permanent or temporary employment; iii) the use of annual-hours and zero-hours contracts, flexitime, shifts, homeworking, changing the pattern of working hours, term-time only-working, job-sharing, reducing working hours and compressed hours; iv) the proportion of the workforce who are self-employed; v) the composition of temporary employment (including casual, agency, temporary, seasonal and fixed-term contracts). Whilst WERS only covers the first three types of outcomes, the LFS covers all the listed types of flexible employment WERS The survey sample Workplaces participating in the WERS series are sampled from local units found on the Interdepartmental Business Register, maintained by the Office for National Statistics. WERS covers all areas of industrial activity except Agriculture, forestry and fishing and Mining and quarrying (van Wanrooy et al. 2013b: 5). The size of workplaces included in WERS has fallen over time, so that in 1998 workplaces with fewer than 10 employees were excluded from the survey, whilst in 2004 and 2011, those with between five and nine employees were included. As a result, it is necessary to exclude workplaces with between five and nine employees when making comparisons between the period from 1998 to 2004 and the period from 2004 to When workplaces with between five and nine employees are included in the sample, WERS is representative of 35 per cent of all workplaces and 90 per cent of all employees in Britain. The analysis presented in this report is weighted to make the results representative of the population from which the surveyed workplaces are drawn. Each WERS since 1998 has included a survey of more than 2,000 workplaces (2,191 in 1998, 2,295 in 2004 and 2,680 in 2011). An attempt is made to distribute a survey of up to 25 employees within each workplace that participates in the Survey of Managers, resulting in survey responses from more than 20,000 employees (28,237 in 1998, 22,451 in 2004 and 21,981 in 2011). Whilst a separate sample is drawn for the Survey of Managers at each date, all workplaces participating in the previous survey are re-contacted to establish whether they are still in existence and a subset are surveyed to explore changes over time in surviving workplaces (known as the Panel Survey). The Panel consists of interviews with managers in over 900 workplaces (956 for the 1998 to 2004 Panel and 989 for the 2004 to 2011 Panel). In addition, the 2004 to 2011 Panel includes surveys with 8,821 employees in both 2004 and 2011, although the individual employees surveyed in each year may be different. Management interviews for WERS 1998 took place between October 1997 and July In 2004, fieldwork occurred between February 2004 and April 2005, whilst fieldwork for the 2011 survey took place between March 2011 and June Indicators of low-pay WERS contains very detailed information on workplaces and employees and a large number of measures which are comparable over time. The WERS Survey of Employees asks employees to indicate the average amount they are paid (including average overtime), within bands, on either a weekly or comparable annual basis before tax and other deductions. They are also asked to give their usual weekly hours of work, including overtime. This makes it possible to derive an estimate of the hourly rate of pay for each employee and to aggregate this up to calculate the 16
17 proportion of the workforce with earnings within a particular range of the NMW. A banded age variable makes it possible to exclude employees not eligible for the adult rate. However, changes to the age bands used over time mean that there is ambiguity over the NMW rate applying to some employees and it is therefore necessary to exclude employees in some age brackets when seeking to identify whether the workplace had employees receiving the NMW or less. For example, in 1998 the younger age bands spanned employees who would have been eligible for different rates of the NMW on its introduction. For this reason, only employees over the age of 25 can be used to identify low-paying workplaces in 1998, whereas those aged and 22 or more were used to derive the measures in 2004 and This results in a discontinuity in the proportion of workplaces identified as low-paying in 1998 compared with 2004 and The data from the WERS Survey of Employees can be linked to responses from managers within the same workplace, making it possible to observe the approximate point in time when the data were supplied (via the date when the interviewer first visited the workplace) and hence the NMW rate pertaining at the time. Whilst the WERS Survey of Managers also contains information on the proportion of employees earning the minimum wage or less, or within bands above the minimum wage, the range covered by the band immediately above the minimum wage has changed quite substantially over time. There have also been changes in question wording which mean that the questions vary in the inclusion of employees not eligible for the adult rate. For example, the 2004 survey recorded the number of employees aged 22 or more who earned 4.50 an hour or less, and the number who earned 4.51 to 5.00 an hour (up to 11 per cent more than the NMW at the start of fieldwork). WERS 2011 recorded the number of employees (not necessarily just those eligible for the adult rate) paid 5.93 an hour or less and the number paid between 5.94 and 7.50 an hour (up to 26 per cent more than the NMW at the start of fieldwork). Furthermore, in 2011, the Survey of Managers questionnaire was updated during fieldwork to use the uprated NMW (of 6.08) after 4 January Nonetheless, the measures from the Survey of Managers provide a useful source of information in validating the mechanism for identifying low-paying workplaces derived from the Survey of Employees. The comparability of the measures derived from the two sources in identifying low-paying workplaces is assessed in Section Indicators of flexible employment Managers were asked whether they had any of the following working time arrangements for any employees in both 2004 and 2011: working at or from home in normal working hours; flexitime; job-sharing schemes; the ability to reduce working hours; compressed hours; the ability to change set working hours; working only during school term times shift working; 2 Those aged 20 or 21 were excluded when using the 2004 and 2011 surveys to identify whether any employees received the NMW or less. When the threshold for eligibility for the adult NMW was reduced from 1 Oct 2010, the age band used on the 2004 and 2011 surveys covered some employees eligible for the adult rate and some eligible for the youth development rate. For the sake of comparability over time, it was decided to exclude those who were aged 20 or 21 when deriving the indicator of whether the workplace had any employees receiving the NMW or below. Those aged were included in the derivation of the 2004 and 2011 measures to maximize sample sizes. 17
18 annual-hours contracts; zero-hours contracts. The Survey of Managers also records the total number of employees on temporary or fixed term contracts and working full-time or part-time in each year and whether they made use of any agency workers. In 1998, managers were asked whether any non-managerial employees were entitled to: working at or from home in normal working hours; term-time only contracts; switching from full-time to part-time employment; job-sharing schemes. Managers were also asked whether they had any of the following working time arrangements for any non-managerial employees at the workplace: annual-hours; flexitime; shift-working; zero-hours contracts; 9-day fortnight/4.5-day week (compressed hours). These questions were repeated in 2004 for the workplaces participating in the 1998 to 2004 Panel. The 1998 Survey of Managers also recorded whether any use was made of agency workers. In both 2004 and 2011 employees were asked to give their usual weekly hours, including overtime, making it possible to observe full-time and part-time employment. They were also asked whether they were on a permanent, temporary or fixed-term contract and whether the following practices would be available to them, if needed: flexitime; job-sharing; reduced working hours; compressed hours; homeworking; term-time only working. It was only possible to observe whether individual employees used each of these types of practice in 2011, so when seeking to look at changes over time using information from the Survey of Employees, the focus is on perceived availability rather than use. However, for 2011 it is possible to explore whether the availability and use of practices differed between employees paid at, or around, the NMW compared to slightly better-paid workers, controlling for a range of employee and workplace characteristics. For example, it is possible that the use that employees make of the flexible employment practices which are available to them varies depending on their pay level. In 2004 and 2011, employees were able to say that they did not know whether each arrangement would be available to them, if needed. As a high proportion of employees did not know whether each practice was available, all missing responses were re-coded, so that practices were treated as not being available in these cases. The analysis presented in this report focuses on management reports of the use of flexible employment, but also presents findings using measures derived from the 2004 and 2011 Survey 18
19 of Employees to explore the sensitivity of the results to drawing the outcome measures from either source. As employees were asked about the availability of a narrower range of practices in 1998 and the main purpose is to test the robustness of results when using the measures derived from the Survey of Managers, there is limited value in carrying out a similar analysis using the 1998 Survey of Employees. As previous analysis has suggested that the public and private sectors differ in their use of flexible employment, and that low-paying workplaces are more heavily concentrated in the private sector, the descriptive and multivariate analysis of the association between pay-levels and flexible employment focuses on workplaces in the private sector Indicators of the impact of the recession In 2011 managers were asked to rate the extent to which the recession had an adverse impact on the workplace. They were asked whether it affected the workplace A great deal, Quite a lot, A moderate amount, Just a little or had No adverse effect. This creates the opportunity to explore the perceived impact of the recession in low-paying workplaces, comparing those with flexible employment practices against those without. The five-item scale was collapsed into a binary measure, comparing those adversely affected A great deal against the rest. As well as the direct question on the impact of the recession, introduced in 2011, the process of following up all workplaces participating in WERS at the time of the next survey makes it possible to observe whether workplaces closed between 1998 and 2004 and between 2004 and This information is used to consider whether low-paying workplaces which were part of the 1998 or 2004 Cross-section surveys were more, or less, likely to close by the time of the next survey if they made use of flexible employment, controlling for a range of workplace and workforce characteristics Control variables Having provided a descriptive analysis of the measures of flexible employment, low-pay and the impact of the recession, this report moves on to present multivariate analysis. This compares changes over time in the use of various types of flexible employment between workplaces which had employees paid at or below the NMW with those with slightly higher pay levels, controlling for other workplace and workforce characteristics. The analysis controls for factors likely to be related to pay-levels, the impact of the recession and the use that the employer makes of flexible employment practices such as the size of the workplace, the industry and market in which it operates and characteristics of the workforce. The main control variables are as follows: whether labour costs amount to less than 25 per cent of sales; whether the workplace operates in an international market (rather than local, regional or national); whether at least three-quarters of the workforce are female; whether at least some employees are from an ethnic minority; workplace size; whether the workplace is a single independent establishment, rather than part of a larger organisation; whether there are any unions with members at the workplaces which are recognised; industry. 3 3 It was necessary to combine some industries to overcome sample size limitations. Groupings were selected based on the proportion of low-paying workplaces in each sector, with the sectors which were most similar over time grouped together. The 19
20 As well as these standard control variables, additional controls were used where they were relevant to a particular analysis. For example, the analysis of the reported availability and use of flexible employment by employees controlled for the gender of the respondent, whether they had any dependent children and the length of time they had worked at the establishment. As far as was possible, identical control variables were used for 1998, 2004 and 2011 in order to make the analysis as consistent as possible. However, it was necessary to use alternative measures where key questions changed over time: In 2004 and 2011 managers were asked to rate the extent to which demand for their product or service depended on price, but in 1998 it was only possible to control for whether the workplace was in the trading sector or not; The analysis of the association between pay-levels, the use of flexible employment and the impact of the recession controlled for whether any unions were recognised (rather than just ones with members), as this measure was more strongly associated with the impact of the recession, but was not available for LFS The survey sample The LFS provides a rich source of data on people of working age, covering a wide range of personal characteristics, as well as information on their interaction with the labour market. Each quarter, around 50,000 households are surveyed. They are sampled from households living at private addresses in the UK, as well as those in NHS accommodation, and each household is surveyed for five successive quarters, with an 80 per cent overlap from one quarter to the next in the households surveyed. The survey consists of core questions, which are asked in every quarter, and non-core questions which are only asked in one or two quarters. Around one-third of responses to the LFS are given by a proxy. The analysis presented in this report has been weighted so that results are representative of the British workforce as a whole Indicators of low-pay Reported hourly pay is used to identify low-paid workers (for hourly paid staff). For those where this information is not relevant or available, we use information on gross hourly pay. Respondents to the LFS are asked their gross pay from their main job on the last occasion when they were paid, as well as the period that this covered. This is used to derive weekly pay and then divided by the number of hours they usually work in their main job each week (including overtime) to derive gross hourly pay. These variables are then used to distinguish between respondents who were paid the NMW or less and those who were paid more than the NMW, taking into account whether the respondent was eligible for the adult or youth rates, based on their age Indicators of flexible employment Aside from information on the labour market status of individuals (whether employed, unemployed or economically inactive) the LFS provides detailed information on a wide range of job characteristics that can be used to assess the extent to which businesses use flexible employment practices. The LFS includes information on the use of the following types of flexible employment: groupings were as follows: Manufacturing and Construction; Electricity, Financial services, Other business services and Public administration; Wholesale and retail; Hotels and restaurants; Transport and Education; Health and Other community services. 20
21 part-time or full-time jobs; self-employment; temporary or permanent jobs (and whether temporary work is in the form of casual or seasonal work, agency work or based on a fixed-period or fixed-task contract); homeworking (whether usual or occasional, paid or unpaid); number of days worked i.e. nine-day fortnight, four-and-a-half day week; type of agreed work arrangement i.e. flexitime, annual-hours contract, term time contract, job sharing, zero-hours contract, on-call working; other (the pattern of working hours i.e. fixed start and end of working day, own work schedule etc, shiftworking). The LFS asks whether respondents, in their main job, have any of a list of agreed working time arrangements from flexitime, annual-hours, term-time only working, job-sharing, a nine-day fortnight, a four-and-a-half-day week and zero-hours contracts. This question is asked in the April to June (Q2) and October to December (Q4) calendar quarters. However, prior to 2006, the LFS was based on seasonal, rather than calendar quarters and so the question was asked at slightly different points in time - between March and May (Spring) and September and November (Autumn). As a result, some adjustment is required to make comparisons between estimates based on seasonal quarters and those based on calendar quarters. 4 The time-series produced for this report applies the adjustment factor recommended by ONS to ensure that estimates are consistent over time (Chandler and Barrett 2013). The estimates of the total number of people in employment with each of the different types of working time arrangement have been calculated for the October to December quarter of each year, as the data are not collected for all eligible respondents in the April to June quarter. ONS recommends that analysis is restricted to the period from 2001 onwards, and so the analysis presented in this report is confined to this period (Chandler and Barrett 2013). In addition, the extent of part-time work, self-employment, home-working and temporary work can be assessed over the period from 1998 to Changes to the way that information on the type of temporary contract (i.e. seasonal, casual, agency work or a fixed-period or fixed-task contract) was collected after 2011 introduces a discontinuity into this series. Prior to 2012, those on temporary contracts were only allowed to specify one type of temporary contract from the four options, whereas from 2012, they were allowed to choose multiple options. For this reason, whilst the descriptive analysis shows headline figures for 2012 and 2013, these two years are excluded from the sections reporting the use of these types of contracts by age, earnings, qualifications and sector. LFS defines a homeworker as someone who, in their main job either works mainly in their own home ; in the same grounds or building as their home or in different places using home as a base. The WERS definition covers employees who work from home occasionally, as well as those that mainly work at home and so is likely to encompass those with a more diverse range of characteristics. From either source it is not possible to distinguish between salaried homeworkers and those paid by the piece; with this latter group more likely to be low-paid Control variables As with the analysis of WERS, this report focuses on a descriptive analysis of changes in the use of flexible employment and the interplay between flexible employment and low-pay. We also present the results of local areas based multivariate analysis which controls for a wider range of 4 This is because the estimates produced from the calendar quarter datasets prior to 2006 contain only the results for the two months when data was originally collected. 21
22 factors associated with flexible employment and pay levels, including: firm size, gender, education, industry and local area unemployment. 22
23 3.1. Overview 3. METHODS This section describes how the LFS data and the WERS series were used to answer the research questions. By considering a number of different comparison groups it was possible to assess whether the size of any observed impact from the NMW is sensitive to the method of estimation. The choice of comparison group and the periods of time considered in the analysis of change is dictated by the available data. In previous analyses, the approach has been to distinguish between areas where a high proportion of employees were likely to be directly affected by uprating the NMW and those where a high proportion of employees were earning: i) up to 10 per cent more than the uprated NMW; ii) between 10 and 20 per cent more than the NMW (Dickens et al. 2009). When further sensitivity testing has been required, two additional alternatives used in the past are to draw comparison groups from: iii) those earning between 20 and 30 per cent more than the NMW (Swaffield 2009); iv) those within particular percentiles of the wage distribution e.g. from the uprated NMW to the 10 th percentile of the real wage distribution (Swaffield 2009), or following the approach set out in Dickens et al. (2012), so that the treatment and comparison groups can be defined in a similar way over time. Our analysis employed a similar approach in the choice of the comparison group. The text focuses on findings that are statistically significant at the 5 per cent level or better WERS The analysis of WERS compares the use of flexible employment in workplaces which were most likely to be affected by the NMW (due to having a high proportion of low-paid employees) with that in workplaces which offered slightly higher wages and explores how these patterns changed over time. The analysis controls for a range of workplace and workforce characteristics within a regression framework. 23
24 Percentage of employees Calculating average hourly pay The WERS Survey of Employees asks respondents to give their usual gross weekly, monthly or annual earnings within bands. The distribution of gross weekly pay (including any pay for usual weekly overtime) is shown in Figure 1. As the weekly pay variable is banded, it is necessary to make assumptions about the actual pay rate in order to estimate hourly earnings. As the main interest is in low-pay, it was decided to assume that employees received the maximum amount of pay for each band, with the top band truncated at 1,000 a week. This approach provides a conservative estimate of the proportion of workplaces with employees receiving the NMW or less as it avoids employees being classified as receiving the NMW or less unless the number of hours that they worked implied that they were definitely earning less than the NMW. Figure 1 Distribution of usual weekly pay, Usual weekly pay Source: Workplace Employment Relations Study Note: Weighted using employee weights. Based on responses from 22,018 employees in workplaces with five or more employees. 24
25 Percentage of employees Gross average hourly pay was derived by dividing the upper band of usual weekly pay by usual weekly hours (again including any overtime usually worked). Figure 2 shows the distribution of usual weekly hours. Employees most commonly worked 40 hours a week (the mode), but the median employee averaged 38 hours a week, while the mean average was 36.2 hours. Figure 2 Usual weekly hours, Usual weekly hours Source: Workplace Employment Relations Study Note: Weighted using employee weights. Based on responses from 22,114 employees in workplaces with five or more employees. 25
26 Figure 3 plots gross usual weekly hours against gross usual weekly pay. The white line in the middle of the grey boxes is the median number of hours worked, whilst the box itself shows the interquartile range from the distribution of hours for employees within each pay band. The whiskers show the points at 1.5 times the interquartile range (the upper and lower adjacent values), whilst the grey circles show the hours worked by outliers i.e. those working a relatively low, or high number of hours for a given pay band. Whilst the dispersion in the hours worked by employees within each pay band is apparent, the figure does illustrate the fact that those receiving lower levels of weekly pay tended to work fewer hours. However, at around 40 hours a week, the association between hours worked and weekly pay becomes less pronounced, demonstrating the variation in the usual weekly pay of those working around 40 hours a week. Figure 3 Usual weekly hours by usual weekly pay, Usual weekly pay Source: Workplace Employment Relations Study Note: Unweighted. Based on responses from 21,721 employees in workplaces with five or more employees. The sensitivity of the results to an alternative specification, where pay was assumed to fall within the middle of each pay band (rather than taking the maximum value) was tested for the 2004 and 2011 results. The findings of this analysis were broadly similar, but a number of associations which were not statistically significant at the 5 per cent level in the analysis which assumed that employees earned the maximum for their pay band became statistically significant under the assumption that they received a lower rate of pay, whilst some results fell outside conventional levels of statistical significance. All the observed differences, and their impact on the conclusions drawn from the analysis, are detailed in Section
27 Calculating the proportion of employees paid the NMW or below Having calculated the usual hourly pay of each employee, it was then necessary to derive an indicator of whether the hourly pay rate exceeded the NMW rate pertaining at the time. As the WERS Survey of Employees is a self-completion questionnaire, it is not possible to observe exactly when it was completed. Fieldwork for each of the WERS series spanned the uprating of the NMW (on 1 October each year), so it is therefore uncertain whether the employee completed the survey before or after the uprating. However, the date that the interviewer first visited the workplace is recorded and where this occurred on or after 1 October, employees would not have responded to the questionnaire until after the uprating. Therefore, if the first visit to the workplace occurred before 1 October, employees eligible for the adult rate were classed as being low-paid if they were paid the pre-uprating NMW or less, whereas if the first visit to the workplace occurred on or after 1 October, they were only classed as low-paid if they received the up-rated NMW or less. For example, for WERS 2004, if the interviewer first visited the workplace before the 1 October 2004, an employee who was aged 22 or more was classified as being low-paid if they were paid an average of 4.50 an hour or less. If the first visit to the workplace occurred on or after 1 October 2004, an employee aged 22 or more was classed as being low-paid if they were paid 4.85 an hour or less. Low-paid employees were identified in a similar way for the 1998 and 2011 Cross-section samples i.e. based on the timing of the first visit to the workplace, their age and the NMW rates pertaining at the time, whilst the analysis of the Panel surveys focused on whether employees were found to be low-paying at the time of the first wave of the survey i.e. in 1998 for the 1998 to 2004 Panel and in 2004 for the 2004 to 2011 Panel. It was decided to distinguish between employees paid the NMW or less, or more than the NMW rate as a similar measure was available from the Survey of Managers, making it possible to assess whether measures derived from these two different sources resulted in a similar subset of workplaces being identified as low-paying. In some cases the Survey of Employees would not be distributed or completed until sometime after the initial visit to the workplace by the interviewer, resulting in some low-paying workplaces being classed as paying more than the NMW rate. Also, some employers may increase pay in line with future increases in the NMW before 1 October, so that even workplaces where the first visit to the workplaces was well before 1 October would not be classified as low-paying. In this respect, any indicator used to identify workplaces paying the NMW or less is likely to be flawed. 5 However, the measure should at least identify a subset of the lowest-paying workplaces and those most likely to be affected by the NMW. The adequacy of the method of identifying low-paid employees using WERS data can be explored by assessing whether it produces similar findings to other studies on the types of employees who are low-paid. Whilst it is possible to devise different ways of identifying lowpaying workplaces, there are practical constraints to the use of each measure. If few workplaces are identified as low-paying, the results of any regression analysis are likely to prove inconclusive. The final part of this section assesses the comparability of each of the measures, to determine whether they are largely interchangeable or whether focusing on one measure would be likely to produce misleading results. 5 The assumptions on the timing of the completion of the Survey of Employees in relation to the uprating of the NMW were varied for the analysis based on the 2004 and 2011 surveys, to assess the sensitivity of the results to assuming that the reported pay-levels related to the period before or after the 1 October increase. For example, in the case of the 2004 survey, workplaces where any employees aged 22 or more were paid less than 4.50 an hour (i.e. the NMW rate applying from 1 October 2003, or the comparable rates for younger employees) were classified as low-paying, regardless of when the Survey of Employees was likely to have been completed. The analysis was also repeated using a low-paying threshold for all workplaces based on the rate applying from 1 October 2004 i.e for adults. These additional pieces of analysis produced very similar findings to those which used the date when the Survey of Managers interview commenced to identify the likely rate of the NMW at the time the Survey of Employees was completed. 27
28 Occupation Figure 4 shows that those in the Caring, leisure and other personal services, Sales and customer service, and Routine unskilled occupations were more likely to be paid the NMW or less than Managers and senior officials, Professionals, Associate professionals, Administrative and secretarial staff, Process, plant and machine operatives and those working in Skilled trades. This pattern is broadly as expected from other studies, and so suggests that the method of deriving the hourly wage rate is adequate in identifying low-paid employees i.e. the most skilled occupations contain a smaller proportion of employees who are paid the NMW or less. Figure 4 Percentage of eligible employees paid NMW or less, by occupation, 2004 Routine unskilled occupations 12.5 Process, plant and machine operatives 4.7 Sales and customer service 10.2 Caring, leisure and other personal services 8.7 Skilled trades 3.1 Administrative and secretarial Associate professional and technical Professional Managers and senior officials Percentage of employees Source: Workplace Employment Relations Study Note: Weighted using employee weights. Based on responses from 21,574 employees in workplaces with five or more employees. 28
29 Industry Turning to the concentration of low-paid employees in particular industries, Figure 5 shows that a much greater proportion of employees eligible for the adult rate of the NMW received the NMW or less in the Hotels and restaurants and Wholesale and retail sectors. Again, the findings in this regard are in line with expectations from other sources, confirming that in broad terms the method of identifying low-paying workplaces is likely to be reliable. Figure 5 Percentage of eligible employees paid NMW or less, by industry, 2004 Other community services Health Education Public administration Other business services Financial services Transport and communications Hotels and restaurants Wholesale and retail Construction Electricity, gas and water Manufacturing Percentage of employees Source: Workplace Employment Relations Study Note: Weighted using employee weights. Based on responses from 21,574 employees in workplaces with five or more employees. 29
30 Identifying low-paying workplaces The measure of whether individual employees were low-paid, derived from the Survey of Employees, indicated that 4.4 per cent of employees were paid the NMW or less in However, these employees were widely distributed across workplaces, with 25.9 per cent of workplaces employing some staff who received the NMW or less. This point is also illustrated by Figure 6, which plots the number of employees in each workplace who were paid the NMW or less against the number of eligible employees in that workplace. The size of each circle reflects the number of employees paid the NMW or less within each workplace. In many cases, even when 25 employees responded to the survey, only one employee was paid the NMW or less. From all workplaces with five or more employees in 2004, 15.1 per cent only had one survey respondent in this category, with a further 10.8 per cent having more than one eligible employee who was paid the NMW or less. Figure 6 Number of eligible employees paid NMW or below by number of eligible respondents, Total number of respondents eligible for NMW Source: Workplace Employment Relations Study Note: Unweighted. Based on responses from employees in 460 workplaces. All workplaces with five or more employees. The likely inaccuracies in the identification of employees paid the NMW or less and the fact that in a sizeable proportion of workplaces with some apparently low-paid employees, only one survey respondent was found to receive the NMW or less, suggest that it is important to explore the possible sensitivity of the results to the threshold used to identify low-paying workplaces. For this reason, three alternative measures were developed to identify low-paying workplaces. These were as follows: 30
31 1) Measure 1 - workplaces where at least one employee appeared to be paid the NMW or less (25.9 per cent of workplaces); 2) Measure 2 - workplaces where at least two employees appeared to be paid the NMW or less (10.8 per cent of workplaces); 3) Measure 3 - workplaces with fewer than 10 employee respondents where at least one was paid the NMW or less, or workplaces with 10 or more employee respondents where more than 10 per cent were paid the NMW or less (20.1 per cent of workplaces). Table 1 highlights the differences between the measures. Whilst only having to have one employee paid the NMW or less means that Measure 1 results in a higher proportion of workplaces being classified as low-paying than the other measures, the percentage of employees who are actually in receipt of the NMW in workplaces defined as low-paying on this measure is lower than for the other measures, because in many cases, only one employee is paid the NMW or less. By contrast, a much smaller proportion of workplaces have two or more employees who receive the NMW or less (measure 2), but because at least two employees are low-paid, the percentage of employees receiving the NMW or less in these workplaces is necessarily higher than in workplaces where only one or more employees receive the NMW or less. Whilst Measure 1 may have a greater tendency to result in workplaces being classified as low-paying because of inaccuracies in the data, Measure 2 may result in under-reporting, as having at least two employees on the NMW or less before the workplace is classified as low-paying would be a high threshold within a small workplace. Measure 3 was devised to use a different threshold for workplaces of different sizes, so that workplaces with fewer than 10 employees are classified as low-paying where one employee receives the NMW or less, whereas those with 10 employees or more are only defined as low-paying where at least two employees (more than 10 per cent of the workforce) are paid the NMW or less. Table 1 Comparison of the identifiers of low-paying workplaces, 2004 Percentage of Percentage of workplaces with some employees employed employee respondents within workplaces eligible for NMW defined as low-paying Percentage of employees receiving the NMW or less in workplaces where some employee respondents eligible for NMW on each measure Measure Measure Measure Source: Workplace Employment Relations Study Note: Weighted using establishment and employee weights. Based on response from employees in 1,730 workplaces with five or more employees. Figures exclude workplaces where employees do not answer questions on earnings, hours worked or age, or where it is not possible to determine the NMW rate for which employees are eligible. Whilst it is possible to devise different ways of identifying low-paying workplaces, there are practical constraints to the use of each measure. If few workplaces are identified as low-paying, the results of any regression analysis are likely to prove inconclusive. The final part of this section assesses the comparability of each of the measures, to determine whether they are largely interchangeable or whether focusing on one measure would be likely to produce misleading results. 31
32 Industry ranking The order in which industries are ranked on each of the three measures when considering the proportion of workplaces identified as low-paying is shown in Figure 7. A ranking of 1 is given to the industry with the largest proportion of workplaces identified as low-paying on each measure. Finding that industries attained similar rankings on each of the three measures would suggest that the measures were fairly consistent in identifying the lowest-paying industries. From the figure, it is apparent that the industries did tend to have a similar ranking on each of the three measures. In eight out of 12 industries, all the rankings were within two places of each other and in Transport and communications, Other business services and Education the measures were only separated by three places. The measures were least consistent for the Construction sector, where measures 1 and 3 produced a similar ranking (of second or third lowest-paying), whereas the sector was the ninth lowest paying on measure 2. Given the degree of consistency between the different ways of identifying low-paying workplaces for most industries, it was decided to focus the analysis on Measure 1, since this was more likely to provide sufficient cases to produce a conclusive analysis. Figure 7 Ranking of industries on each measure, Measure 1 Measure 2 Measure 3 Source: Workplace Employment Relations Study Note: Rankings derived from data weighted using workplace weights. Based on responses from 1,730 workplaces with five or more employees. Parentheses indicate results based on fewer than 50 observations Comparison of Survey of Employees- and Survey of Managers-derived indicators of lowpay Having established that the three measures of low-paying workplaces derived from the Survey of Employees were similar in the order in which industries were ranked when sorted according to the proportion of workplaces defined as low-paying, this section assesses the comparability of deriving the measure of low-pay from the Survey of Managers, rather than the Survey of Employees. This provides a further check on the reliability of identifying low-paying workplaces using the Survey of Employees. In 2004, managers were asked to give the number of employees who were aged 22 or over at the time of the survey who were paid 4.50 or less i.e. the adult NMW rate before the 1 Oct 2004 uprating. Since managers would effectively be asked whether any employees were paid less than 32
33 the NMW in cases where the interview took place after the uprating, the analysis which follows focuses on the subset of workplaces where the first visit to the workplace was before 1 October However, even in these cases, the Survey of Managers may not have been carried out on the first visit. Even when comparing whether management and employee reports both confirmed that at least one eligible employee was being paid the NMW or less, an exact correspondence would not be expected. Only a maximum of 25 employees were asked to complete the Survey of Employees, even in the largest workplaces. As a result, in large workplaces only a very small proportion of the workforce would complete the questionnaire. In these cases, managers might report that some employees were paid the NMW or less, whilst this would not be apparent from employee responses. However, the measures derived from the Survey of Managers may also fail to reflect cases where an employee worked unpaid overtime, reducing their actual hourly wage rate to the NMW or less. The analysis was focused on employees aged 22 or over who reported that they were paid the NMW or less, to ensure that the measures derived from the Survey of Managers and the Survey of Employees were as comparable as possible. When comparing management and employee reports that at least one employee at the workplace was paid the NMW or less, there was an exact correspondence between the two measures in 78.4 per cent of workplaces where the first visit to the workplace by the interviewer took place before 1 Oct However, in 7.0 per cent of workplaces, whilst the management respondent indicated that there were some adult employees who were paid the NMW or less, none of these employees appeared to have completed the Survey of Employees. Further analysis suggested that in more than one-third of these cases (37.5 per cent), the discrepancy between the measures derived from the Management and Employee Surveys was explained by the fact that the proportion of employees paid the NMW or less, according to managers, equated to less than one employee from the total number of eligible employee respondents. For example, if 25 employees who were eligible for the NMW responded to the Survey of Employees, but managers reported that less than 4 per cent of the workforce was paid the NMW or less, there was a chance that none of the employee respondents were actually paid the NMW or less. This finding suggests that the undercounting of low-paying workplaces on the Survey of Employeesderived measure is unlikely to result in major under-identification of the lowest-paying workplaces, as the proportion of employees paid the NMW or less in these workplaces would be small relative to the number of eligible employees. In 14.6 per cent of workplaces where the first visit occurred before 1 Oct 2004, the management respondent indicated that there were no adult employees who were paid the NMW or less, whereas the measure derived from the Survey of Employees suggested there were some eligible employees who received the NMW or less. It is uncertain whether this was due to underreporting by the management respondent or inaccuracies in employee reports of hours or pay. 33
34 Industry ranking In conclusion, there were clearly some differences between the methods of identifying lowpaying workplaces derived from the Survey of Managers and the Survey of Employees. 6 However, when industrial sectors were ranked according to the proportion of workplaces classified as low-paying - in this case defined as having one or more employees paid the NMW or less - there was a good correspondence between the two sources (Figure 8). Figure 8 Comparison of ranking of industries, derived from Survey of Managers (SM) and Survey of Employees (SE) SE Measure 1 SM Measure Source: Workplace Employment Relations Study Note: Rankings derived from data weighted using workplace weights. Based on responses from 1,191 workplaces with five or more employees where the first visit to the workplace occurred before 1 October Parentheses indicate results based on fewer than 50 observations. Results based on fewer than 20 observations supressed. For nine of the 11 industries were there were sufficient observations to compare the two measures, the ranking on the measure derived from the Survey of Employees was within two places of that derived from the Survey of Managers. The only two sectors where there was a poor correspondence between the measures derived from the different sources were the Construction and Education sectors. In the main, the analysis suggests that the measure derived from the Survey of Employees provided a reasonable way of identifying workplaces most likely to be affected by the NMW. 7 In the remainder of this report, measure 1 is used to identify lowpaying workplaces i.e. these are workplaces with at least one employee respondent paid the NMW or less. 6 Multivariate analysis showed that the likelihood that employees responded to the Survey of Employees was similar in lowpaying and higher paying workplaces. There was therefore no reason to believe that the findings of the analysis would be biased by focusing the analysis on the sample of workplaces where some employees responded to the Survey of Employees. 7 In assessing the degree of correspondence between the two measures, it is important to bear in mind that the analysis is based on section-level groupings. Workplaces which were more similar in their activities might be expected to also be more similar in terms of pay levels. For example, pay levels within care homes may be more similar than those across the whole of the health and social care sector. Therefore, an analysis based on a more detailed industrial classification could be expected to result in a wider distribution of sectors across the pay spectrum and thus greater consistency between alternative measures used to identify low-paying workplaces. In this context, the degree of similarity in the ranking of sectors on either measure even when considering only section-level groupings suggests that the measures are fairly consistent in terms of their ability to identify lowpaying workplaces. 34
35 Comparison groups The multivariate analysis assesses differences in the use of flexible employment in low-paying workplaces compared with those in a comparison group of workplaces which offer slightly higher wages. Preliminary analysis of WERS suggested that, in order to identify a sufficiently large comparison group for results to be conclusive, it would be necessary to draw the comparison group from workplaces where some employees received hourly pay within 20 per cent of the wage distribution of the NMW, but no employees received the NMW or less. This comparison group is used in the descriptive analysis presented in section 4.1 and the multivariate analysis that appears in section Non-compliance Having used the pay, hours and age information from the Survey of Employees to derive gross average hourly pay in the way described in section 2.2.2, it was then possible to estimate the proportion of the workforce likely to be earning less than the NMW. This measure of noncompliance is likely to be imprecise, particularly given that WERS does not record whether an employee is engaged in an apprenticeship. Before October 2010 there was an exemption from the NMW for apprentices under the age of 19, or for those aged 19 and over in the first year of their apprenticeship, and after October 2010 apprentices could be paid a lower rate of the NMW. As a result, some workplaces which employed apprentices may have been mistakenly classified as failing to comply with the NMW. Therefore the figures on non-compliance derived from WERS are indicative, rather than precise LFS Local area analysis The analysis of the LFS investigates the extent to which the use of flexible employment has varied over the period from before the introduction of the NMW to 2013 (or to 2012 when using calendar, rather than NMW, years). This report describes the trends observed by key firm and workers characteristics, including gender, age, education, earnings and sector. In relation to the level of earnings, changes are assessed in the use of each employment practice for workers paid the NMW or less and those in earnings bands above the NMW. We also present the results of local area multivariate analysis of the use of flexible employment. These models use the 136 local labour markets developed in previous research for the Low Pay Commission (see Dickens et al., (2012) and Le Roux et al. (2013)). The dependent variable in these models is the share of workers in the local labour market with each working arrangement. In addition, the share of total employment that is accounted for by self-employed workers is considered as one of the outcomes. This approach to identifying the impact of the NMW on economic outcomes exploits wage variation across different areas of Britain (see for example Stewart 2002). Since wage rates vary widely across different areas, the NMW will have a larger bite or impact on wages in some areas than others. In those areas that experience a larger bite larger changes in the use of employment are expected. Pooled cross-section time-series data are used to create a panel of local areas for the period to The estimates are then produced using the following specification: FWA it 0 1Minit 2 X it YearDummies AreaFixedE ffects u i Area, t Year (1) it, 35
36 where FWA it is the share of workers using the working arrangement of interest in area i in year t (e.g. the share of temporary employment), Min it is the measure of the bite of the minimum wage captured by the Kaitz index (the ratio of the NMW to the median hourly wage), in area i and year t. X it is a set of control variables (shares of gender, industry, sector employment). The minimum wage treatment effect then varies both across areas and over time. Year dummies allow for aggregate differences from year to year. The area dummies allow for different average shares of the arrangements across the areas. For the method of estimation to be robust, it is important that changes in the outcome measures across regions are a consequence of the NMW rather than as a result of other changes in the wage distribution. If the latter is the case, this would produce a spurious correlation between the outcome variable and the minimum wage variable. To this end it is important to include a set of control variables that may explain the outcome; such as the skill and industry composition of the workforce in the area. The area fixed effects will help to pick up average outcome differences across areas. The models are estimated over the period from 2001 to Non-compliance The LFS is likely to provide a better source of information on non-compliance than WERS. Therefore, to examine the relationship between non-compliance and flexible employment, the analysis builds on the work of Le Roux et al. (2013) conducted for the 2013 LPC report, using LFS data. The analysis uses the basic measure of non-compliance reported by Le Roux et al. Again local area models of non-compliance are estimated (equation 2) to see whether noncompliance is related to the prevalence of flexible employment in local labour markets. NC it 0 1Min it 2 FWA it X it YearDummies AreaFixedE ffects u i Area, t Year (2) Here NC represents the non-compliance rate in area i in year t. it, 36
37 4. DESCRIPTIVE ANALYSIS 4.1. WERS Average pay in low-paying private sector workplaces In 2004, the mean hourly wage in private sector workplaces with 10 or more employees that were identified as low-paying i.e. which had some employees paid the NMW or less, was This had risen to by Mean hourly wages were higher in the comparison group, standing at 9.69 in 2004 and in The difference in the mean hourly wage between low-paying and higher-paying workplaces was statistically significant in both years. Of course, the mean wage can be skewed by outliers, but a similar pattern was apparent when considering the median wage. In low-paying workplaces this stood at 6.33 in 2004 and 7.95 in For the comparison group, the median hourly wage rate was 7.75 in 2004 and in When considering compliance with the NMW, WERS found that 4.3 per cent of employees in private sector workplaces with 10 or more employees appeared to be paid less than the NMW in 2004, compared with 5.8 per cent in More than one-third (37.7) of these workplaces appeared to pay some employees less than the NMW in 2004, compared with more than twofifths (41.4 per cent) in
38 Flexible employment practice Prevalence of flexible employment practices and changes over time There was a statistically significant increase in the percentage of employees working for private sector workplaces with 10 or more employees which had each of the flexible employment practices listed in Figure 9 between 1998 and 2004, with the exception of the use of agency workers. However, it is important to note that whilst in 1998 managers were asked whether each practice (other than agency working) was available to any non-managerial employees, in 2004 they were asked whether any employees used the practice. As a result, some of the increase in the apparent availability of practices between 1998 and 2004 could be explained by the fact that the figures for 1998 would exclude cases where only managers were able to use a practice, whereas in 2004, these workplaces would be regarded as making the practice available to some employees. Figure 9 Changes in percentage of employees working for private sector workplaces where some employees use flexible employment practices between 1998 and (any employees) 1998 (any non-managerial employees) Agency workers Term-time only contracts Part-time employees Fixed-term or temporary employees Compressed working hours Reduced working hours Job-sharing Flexitime Homeworking Shift-working Zero hours Annual hours 4.9% 18.8% 11.6% 15.0% 8.7% 4.5% 10.6% 5.5% 21.5% 17.1% 23.2% 36.6% 38.1% 44.1% 36.5% 48.0% 36.7% 37.4% 37.7% 53.5% 48.1% 87.0% 83.6% 80.3% 0% 20% 40% 60% 80% 100% Percentage of employees Source: Workplace Employment Relations Study 1998 and Note: Weighted using employment weights. Based on responses from at least 1,506 managers in private sector workplaces with 10 or more employees in 1998 and 1,476 managers in
39 Flexible employment practice for any employees Between 2004 and 2011, the proportion of employees working in private sector establishments with 10 or more employees which had some employees on annual-hours and zero-hours contracts, shifts, homeworking, flexitime, compressed hours, fixed-term or temporary contracts, term-time only working, or able to change their pattern of working hours rose. From the list of practices shown in Figure 10, the only arrangements that did not become more prevalent were job-sharing, the employment of some part-time staff or agency workers and the ability to reduce hours. From this descriptive analysis, it appears that any increase in the use of most flexible employment practices between 1998 and 2004 was largely sustained over the period to Figure 10 Changes in percentage of employees working for private sector workplaces where some employees use flexible employment practices between 2004 and 2011 Agency workers Term-time only contracts Part-time employees Fixed-term or temporary employees Changing pattern of working hours Compressed working hours Reduced working hours Job-sharing Flexitime Homeworking Shift-working Zero hours Annual hours % 36.6% 25.2% 18.8% 21.5% 17.2% 8.7% 14.5% 10.6% 53.5% 44.1% 64.5% 56.9% 37.4% 36.3% 36.7% 46.5% 37.4% 49.9% 37.7% 60.2% 53.5% 78.6% 80.3% 88.4% 87.0% 0% 20% 40% 60% 80% 100% Percentage of employees Source: Workplace Employment Relations Study 2004 and Note: Weighted using employment weights. Based on responses from at least 1,476 managers in private sector workplaces with 10 or more employees in 2004 and 1,580 managers in
40 Changes in the prevalence of flexible employment practices in surviving workplaces since the introduction of the NMW The analysis presented in this section considers changes in the use of flexible employment over time in workplaces which were observed in successive waves of the WERS series i.e. Panel workplaces. Therefore the analysis assesses whether workplaces which survived from one survey to the next changed their use of flexible employment practices over time. Both the 1998 to 2004 and 2004 to 2011 Panel surveys are considered and so for the sake of greater comparability, the analysis excludes workplaces with fewer than 10 employees from the 2004 to 2011 Panel, as these workplaces were not included in the 1998 to 2004 Panel. However, changes to the wording of the Cross-section questionnaire between 1998 and 2004 mean that respondents to the 1998 to 2004 and 2004 to 2011 Panel surveys were asked slightly different questions on flexible employment (see section for details). This change in wording is likely to have the effect of boosting the observed prevalence of flexible employment for workplaces participating in the 2004 to 2011 Panel compared to the earlier Panel, since practices only available to managers would have been ignored in the 1998 to 2004 Panel. 8 8 Respondents to the 1998 to 2004 Panel survey were asked the same questions in both years i.e. whether any non-managerial employees used each practice. Likewise, respondents to the 2004 to 2011 Panel survey were asked whether some employees used each practice in both years. Therefore the discontinuity does not affect changes observed within each Panel. 40
41 Flexible employment practice for any non-managerial employees The proportion of employees who worked for private sector workplaces which survived from 1998 to 2004 and which had some non-managerial employees on annual-hours contracts, zerohours contracts, homeworking, flexitime, job-sharing, allowed to reduce their working hours, work compressed hours, employed on fixed-term or temporary contracts, working part-time and on term-time only contracts rose between 1998 and 2004 (Figure 11). The only practices which did not increase in prevalence by a statistically significant amount were shift-working and the use of agency workers. Figure 11 Percentage of employees working for continuing private sector workplaces with flexible employment practices in 1998 and 2004 Agency workers Term-time only contracts Part-time employees Fixed-term or temporary employees Compressed working hours Reduced working hours Job-sharing Flexitime Homeworking Shift-working Zero hours Annual hours % 11.5% 10.3% 5.3% 44.6% 42.6% 49.2% 42.8% 50.0% 43.1% 22.8% 28.4% 17.5% 32.1% 17.3% 52.8% 53.3% 7.6% 3.4% 15.9% 5.9% 72.0% 89.3% 85.4% 0% 20% 40% 60% 80% 100% Percentage of employees Source: Workplace Employment Relations Study 1998 and Note: Weighted using Panel employment weights. Based on responses from managers in at least 588 private sector workplaces with 10 or more employees in 1998 and in
42 Flexible employment practice for any employees By contrast, the proportion of employees working for private sector workplaces which survived from 2004 to 2011 which had some staff using flexible employment practices was fairly stable between 2004 and 2011 (see Figure 12). Only the proportion of employees working in establishments with zero-hours contracts, shift-working, homeworking and compressed hours rose. Figure 12 Percentage of employees working for continuing private sector workplaces with flexible employment practices in 2004 and 2011 Agency workers Term-time only contracts Part-time employees Fixed-term or temporary employees Compressed working hours Reduced working hours Job-sharing Flexitime Homeworking Shift-working Zero hours Annual hours % 17.7% 9.8% 16.1% 12.5% 39.8% 43.4% 34.3% 26.8% 57.9% 52.2% 43.0% 40.9% 40.8% 46.9% 38.3% 49.6% 41.7% 68.3% 58.4% 83.3% 84.4% 90.5% 90.8% 0% 20% 40% 60% 80% 100% Percentage of employees Source: Workplace Employment Relations Study 2004 and Note: Weighted using Panel employment weights. Based on responses from managers in at least 577 private sector workplaces with 10 or more employees in 2004 and in
43 Having seen that within private sector workplaces that survived from one survey to the next, the proportion of employees working for establishments with flexible employment practices increased between 1998 and 2004, but remained fairly stable between 2004 and 2011, it is then possible to explore whether this pattern differed for lower and higher paying workplaces. In doing this, it is important to note that splitting the sample in this way for the subset of continuing workplaces does further reduce sample sizes and with a smaller sample, changes over time would need to be larger in magnitude to attain statistical significance. Table 2 shows that the increase in the proportion of employees working for continuing establishments with flexible employment practices between 1998 and 2004 was more pronounced in lower-paying workplaces than in those in the comparison group, although this may have been partly because the arrangements were generally more prevalent in workplaces in the comparison group in Table 2 Percentage of employees working for low-paying or higher-paying private sector continuing establishments with flexible employment practices in 1998 and 2004 Percentage of employees in low-paying workplaces which use practice Percentage of employees in higher-paying workplaces which use practice Change Change Annual-hours 4.8% 8.6% 3.8% 2.4% 23.1% 20.7%** Zero-hours 3.7% 7.1% 3.4% 7.0% 12.0% 5.0% Shift-working 48.3% 49.4% 1.1% 59.7% 53.7% -6.0% Homeworking 10.2% 23.0% 12.8%*** 18.0% 28.2% 10.2% Flexitime 13.7% 19.2% 5.5% 23.3% 33.2% 9.8%* Job-sharing 12.6% 33.7% 21.1%*** 31.4% 40.7% 9.4% Reduced working hours 51.1% 63.2% 12.1%** 59.4% 69.7% 10.3% Compressed working hours 3.4% 7.1% 3.7% 5.7% 6.1% 0.4% Fixed-term or temporary employees 26.5% 28.8% 2.3% 48.5% 51.3% 2.8% Part-time employees 91.5% 88.4% -3.1% 91.2% 91.4% 0.2% Term-time only contracts 8.9% 18.3% 9.5%*** 20.8% 21.6% 0.8% Agency workers 25.4% 27.6% 2.2% 50.4% 44.2% -6.2% Source: Workplace Employment Relations Study 1998 and Note: Weighted using Panel employment weights. Based on responses from at least 128 managers in low-paying workplaces with 10 or more employees in the private sector and at least 157 managers in comparison group workplaces in the private sector. ***=statistically significant at the 1% level; **=statistically significant at the 5% level; *=statistically significant at the 10% level. 43
44 The picture of greater stability in the proportion of private sector workplaces with flexible employment practices between 2004 and 2011 was apparent across both low-paying and higherpaying workplaces (Table 3). Table 3 Percentage of employees working for low-paying or higher-paying private sector continuing establishments with flexible employment practices in 2004 and 2011 Percentage of employees in low-paying workplaces which use practice Percentage of employees in higher-paying workplaces which use practice Change Change Annual-hours 19.6% 13.1% -6.5%* 11.4% 11.4% 0.1% Zero-hours 17.1% 17.0% -0.1% 9.5% 20.0% 10.5% Shift-working 71.4% 73.2% 1.8% 65.2% 71.7% 6.5% Homeworking 23.1% 35.4% 12.4%*** 31.6% 29.3% -2.4% Flexitime 36.9% 34.5% -2.4% 25.5% 45.1% 19.6%** Job-sharing 41.4% 32.0% -9.4% 36.0% 28.9% -7.0% Reduced working hours 86.3% 81.6% -4.7% 79.8% 74.4% -5.4% Compressed working hours 18.1% 36.5% 18.4%*** 17.7% 25.5% 7.8%* Fixed-term or temporary employees 38.6% 44.8% 6.2% 43.9% 48.1% 4.2% Part-time employees 94.8% 89.1% -5.7%* 90.0% 90.0% 0.0% Term-time only contracts 32.6% 34.8% 2.2% 22.4% 30.2% 7.8% Agency workers 27.2% 21.0% -6.2% 32.9% 29.5% -3.4% Source: Workplace Employment Relations Study 2004 and Note: Weighted using Panel employment weights. Based on responses from at least 146 managers in low-paying workplaces with at least 10 employees in the private sector and at least 136 managers in comparison group workplaces in the private sector. ***=statistically significant at the 1% level; **=statistically significant at the 5% level; *=statistically significant at the 10% level Combinations of flexible employment practices It is evident that one of the reasons why there are many different types of flexible employment is because employers use them to achieve different aims. Some practices may be used primarily to retain key staff, whilst others are designed to ensure that working patterns are responsive to fluctuations in demand from customers. The circumstances in which workplaces operate may lead employers to choose different combinations of practices, with some practices being substitutes for each other and others being complementary. This was explored both by examining the correlations between practices within private sector workplaces with 10 or more employees in 2004 and through a factor analysis. There were very few negative correlations between any of the 13 practices considered, and in all cases these were of very low magnitude and not statistically significant at the 5 per cent level. The correlation coefficients suggested that in most cases practices were used in combination with each other, rather than as substitutes, but that there were few dominant combinations of practices. The practices most often found together were shiftworking and the ability to change the working pattern (with a correlation coefficient of 0.46), job-sharing and the ability to reduce working hours (0.32), fixed-term or temporary contracts and agency workers (0.31) and the use of part-time employees and the ability to reduce working hours (0.30). Even in these cases, the correlations were fairly low in magnitude. The factor analysis also reflected the fact that employers tended to develop their own mix of practices, rather than dividing into clear groups based on the use of particular combinations of flexible employment. As noted in Section 1.4, even practices with the same generic name can vary in the way they are implemented by individual employers, and this issue is magnified when seeking to group together different types of arrangements. Practices that might be considered similar because of one shared characteristic may be very different in other respects. For example, annual-hours contracts, zero-hours contracts and the use of agency workers all offer employers the ability to vary labour supply to 44
45 match peaks in demand, but may vary in their attractiveness to workers, due to the stability of employment that they provide. As a result, considering the relationship between combinations of practices which seem similar in some respects may mask differences between them in their use by low-paying and higher-paying employers. For example, if low-paying employers have lower-skill requirements they may be less interested in retaining workers than higher-paying ones. As a result, they may make greater use of zero hours contracts, whereas higher paying employers may use annual hours contacts to retain skilled staff. If these practices are grouped together on the grounds that they all offer employers flexibility over the supply of labour, the use of such practices by low-paying and higher paying employers may appear similar, despite the fact that the actual practices used and the implications for employees could be very different. For this reason, the analysis presented in this report considers each type of flexible employment identified by managers or employees as a discrete practice separately, rather grouping arrangements together Changes in the use of flexible employment since the introduction of the NMW This section focuses on changes over time in the proportion of employees working for private sector establishments which provide some flexible employment practices, depending on whether they are classified as low-paying or higher paying. Workplaces which closed between 1998 and 2004 and between 2004 and 2011 are included in each snapshot, giving a fuller picture of the prevalence of flexible employment in all low-paying or higher-paying workplaces and changes over time, regardless of whether individual workplaces continued to operate. However, as noted earlier, as managers were only asked whether any non-managerial employees used certain practices in 1998, rather than any employees, as in 2004 and 2011, this does introduce a discontinuity into the series. This would be expected to result in a greater increase between 1998 and 2004 than between 2004 and 2011 and so this should be borne in mind in interpreting the results. That said, within the subset of workplaces which survived the period from 1998 to 2004, there was a statistically significant increase in the proportion of workplaces offering each of the flexible employment practices to any non-managerial employees (i.e. when focusing on the subset of workplaces where it was possible to use a consistent measure of provision over time). 45
46 Looking first at changes in the proportion of employees working for low-paying private sector establishments with flexible employment practices between 1998 and 2004, there was a pronounced increase for all practices except the employment of some part-time employees or agency workers (Table 4). Whilst, for the reasons noted above, this may be partly due to the discontinuity in the series for many of the practices, the earlier finding that there was also an increase in the use of most practices within the subset of workplaces where provision could be measured consistently over time, provides some reassurance that there was indeed a change in the prevalence of flexible employment between 1998 and Nevertheless, the increase was less apparent in higher-paying workplaces (Table 5). The proportion of employees in low-paying workplaces which offered each of the arrangements was less likely to increase between 2004 and 2011 when compared to workplaces in the comparison group. Indeed the proportion of employees working for low-paying workplaces which allowed some employees to reduce their hours fell. Table 4 Percentage of employees working for low-paying private sector establishments with flexible employment practices, Percentage of employees in low-paying workplaces which use practice Change Annual-hours 4.4% 10.4% 6.1% 6.0%** -4.4%* Zero-hours 4.7% 12.8% 16.9% 8.0%*** 4.1% Shift-working 53.1% 66.3% 71.9% 13.2%*** 5.6% Homeworking 5.3% 21.0% 26.0% 15.6%*** 5.1% Flexitime 13.8% 35.1% 38.3% 21.3%*** 3.2% Job-sharing 14.4% 32.8% 25.1% 18.4%*** -7.7%* Reduced working hours 48.5% 84.4% 77.3% 35.9%*** -7.1%** Compressed working hours 4.9% 17.6% 33.2% 12.6%*** 15.6%*** Fixed-term or temporary employees 22.7% 31.8% 40.2% 9.1%** 8.4%* Part-time employees 93.6% 91.1% 92.7% -2.5% 1.6% Term-time only contracts 9.5% 20.8% 25.6% 11.3%*** 4.8% Agency workers 20.5% 23.2% 19.8% 2.7% -3.4% Source: Workplace Employment Relations Study 1998, 2004 and Note: Weighted using employment weights. Based on responses from at least 347 managers in low-paying workplaces with 10 or more employees in the private sector in 1998 and 328 managers in 2004 and 379 managers in ***=statistically significant at the 1% level; **=statistically significant at the 5% level; *=statistically significant at the 10% level. 46
47 Table 5 Percentage of employees working for higher-paying private sector establishments with flexible employment practices, Percentage of employees in comparison workplaces which use practice Change Annual-hours 3.2% 8.2% 14.9% 5.0%** 6.6%** Zero-hours 6.7% 10.0% 14.8% 3.3% 4.8% Shift-working 49.2% 54.2% 62.2% 3.8% 9.2%* Homeworking 13.2% 28.6% 43.4% 15.3%*** 14.8%*** Flexitime 17.8% 31.8% 41.3% 14.1%*** 9.4%** Job-sharing 24.5% 31.9% 28.9% 7.5% -3.1% Reduced working hours 48.8% 78.4% 78.6% 29.6%*** 0.2% Compressed working hours 4.5% 21.7% 35.5% 17.2%*** 13.8%*** Fixed-term or temporary employees 38.1% 37.6% 46.7% -0.5% 9.2%** Part-time employees 83.2% 88.4% 88.9% 5.2% 0.5% Term-time only contracts 14.6% 19.8% 22.3% 5.2% 2.5% Agency workers 36.8% 32.6% 24.2% -4.2% -8.5%* Source: Workplace Employment Relations Study 1998, 2004 and Note: Weighted using employment weights. Based on responses from at least 399 managers in comparison group private sector workplaces with 10 or more employees in 1998 and 327 managers in 2004 and 302 in ***=statistically significant at the 1% level; **=statistically significant at the 5% level; *=statistically significant at the 10% level. To summarise, generally speaking, higher-paying workplaces were more likely to make use of many of the flexible employment practices than low-paying workplaces in the period before the introduction of the NMW. Perhaps as a result of this, increases in the proportion of employees working in establishments with flexible employment practices appeared more pronounced in low-paying workplaces than in higher-paying ones between 1998 and However, between 2004 and 2011, higher-paying workplaces were more likely to continue to increase their use of flexible employment practices than low-paying ones Workplace closures following the introduction of the NMW and the impact of the recession This section concludes by looking at the association between the use of flexible employment practices in low-paying and higher paying workplaces and the likelihood of workplaces closing between each survey. It also considers the link between the reported impact of the recession on the workplace and the use of flexible employment practices in low-paying and higher-paying workplaces. The analysis of closures between each survey focuses on whether the workplace was classified as low-paying and had each flexible employment practice at the first date. Again, in the case of the analysis for the period 1998 to 2004, for many of the practices managers were asked whether any non-managerial employees used the practice, whereas for the period 2004 to 2011, they were asked whether any employees used the practice. 47
48 Within low-paying workplaces in the private sector, those with zero-hours contracts were more likely to survive over both periods than low-paying workplaces without such practices (Table 6). Low-paying workplaces with flexitime for some non-managerial employees were less likely to close between 1998 and 2004 than those without flexitime. Between 2004 and 2011, low-paying workplaces with annual-hours contracts were less likely to close than those without annual-hours contracts. There was a general picture of low-paying workplaces being less likely to close where they used some flexible employment practice compared to not using such practices, but this was confined to a small range of arrangements. Table 6 Percentage of low-paying private sector workplaces with flexible employment practices closing between 1998 and 2011 Percentage of low-paying workplaces with practice closing between 1998 and 2004 Percentage of low-paying workplaces with practice closing between 2004 and 2011 With practice Without practice Difference With practice Without practice Difference Annual-hours (2.5%) 14.3% (-11.8%***) Zero-hours (3.9%) 13.5% (-9.6%**) (4.7%) 14.6% (-9.9%**) Shift-working 17.1% 10.9% 6.2% 13.4% 14.4% -1.0% Homeworking (6.5%) 13.6% (-7.1%) 21.0% 12.6% 8.4% Flexitime (5.8%) 14.9% (-9.0%**) 16.7% 12.4% 4.3% Job-sharing (7.3%) 14.3% (-7.0%) 10.4% 15.1% -4.6% Reduced working hours 13.6% 13.1% 0.5% 13.7% 14.9% -1.2% Compressed working hours % 13.3% 4.0% Fixed-term or temporary employees 10.0% 13.9% -3.9% 22.3% 12.2% 10.1% Part-time employees 12.4% (30.4%) (-18.1%) 12.6% (25.2%) (-12.6%) Term-time only contracts (23.4%) 12.7% (10.7%) 10.8% 14.3% -3.5% Agency workers 15.9% 12.9% 2.9% 23.7% 12.6% 11.1% Source: Workplace Employment Relations Study 1998, 2004 and Note: Weighted using establishment weights. All workplaces with at least 10 employees. Parentheses indicate results based on fewer than 50 observations. -=suppressed as based on fewer than 20 observations. Based on responses from at least 347 managers in private sector workplaces in 1998 and 327 managers in ***=statistically significant at the 1% level; **=statistically significant at the 5% level; *=statistically significant at the 10% level. 48
49 Within workplaces in the comparison group, those with some employees on zero-hours contracts, working part-time or some non-managerial employees on term-time only contracts were less likely to close between 1998 and 2004 than workplaces which did not make use of these types of contracts (Table 7). Also, workplaces with some employees on annual-hours contracts or homeworking were less likely to close between 2004 and Overall, some flexible employment practices were associated with a stronger likelihood of survival in both lowpaying and higher-paying workplaces over both periods, but zero hours contracts were the only practice associated with a lower likelihood of closure between 1998 and 2004 in both low-paying and higher-paying workplaces, whilst annual-hours contracts were the only practice associated with a lower likelihood of closure in both types of establishment between 2004 and Most of the flexible employment practices considered did not have a strong bearing on the probability of workplace closure over either period. Table 7 Percentage of higher-paying private sector workplaces with flexible employment practices closing between 1998 and 2011 Percentage of higher-paying workplaces with practice closing between 1998 and 2004 Percentage of higher-paying workplaces with practice closing between 2004 and 2011 With practice Without practice Difference With practice Without practice Difference Annual-hours (0.2%) 16.9% (-16.8%***) Zero-hours (0.3%) 23.5% (-23.2%***) (23.5%) 15.9% (7.6%) Shift-working 16.9% 23.5% -6.6% 19.8% 14.5% 5.3% Homeworking (8.7%) 22.7% -14.0%* 5.6% 18.5% -12.9%*** Flexitime 38.5% 20.3% 18.2% 17.4% 15.7% 1.7% Job-sharing 11.5% 23.4% -11.9% 20.9% 15.0% 5.9% Reduced working hours 14.0% 25.2% -11.2% 16.1% 16.3% -0.2% Compressed working hours % 15.8% 3.2% Fixed-term or temporary employees 26.6% 20.8% 5.8% 14.9% 16.5% -1.6% Part-time employees 14.4% 39.0% -24.6%** 14.6% (23.5%) (-8.9%) Term-time only contracts (1.7%) 23.4% -21.7%*** 9.6% 17.1% -7.5% Agency workers 23.0% 21.6% 1.5% 23.3% 15.1% 8.2% Source: Workplace Employment Relations Study 1998, 2004 and Note: Weighted using establishment weights. All workplaces with 10 or more employees. Parentheses indicate results based on fewer than 50 observations. -=suppressed as based on fewer than 20 observations. Based on responses from at least 396 managers in private sector comparison group workplaces in 1998 and at least 327 managers in ***=statistically significant at the 1% level; **=statistically significant at the 5% level; *=statistically significant at the 10% level. 49
50 Flexible employment practice for any employees The propensity of low-paying workplaces which used flexible employment practices to survive over the period from 2004 to 2011 gives some insight into the impact of the recession on lowpaying workplace. However, this can be supplemented by considering managers reports on the extent to which the workplace was adversely affected by the recession, included on the 2011 survey. Figure 13 shows that there was little association between managers reporting a more adverse impact from the recession and the proportion of employees who worked in low-paying private sector establishments where some employees used flexible employment practices in None of the apparent differences were statistically significant. The same was broadly true for higher paying workplaces in the comparison group, but the proportion of employees who worked for a higher-paying employer that was adversely affected by the recession was lower where some staff were employed on zero-hours or fixed-term or temporary contracts. Figure 13 Percentage of employees working for low-paying private sector workplaces where the recession adversely affected the workplace A great deal, by flexible employment practices Source: Workplace Employment Relations Study Note: Weighted using employment weights. Based on responses from at least 379 managers in private sector workplaces with 10 or more employees in Brackets denote unweighted base of less than 50 observations LFS Agency workers Term-time only contracts (Part-time employees) Fixed-term or temporary employees Changing pattern of working hours Compressed working hours Reduced working hours Job-sharing Flexitime Homeworking Shift-working Zero hours (Annual hours) Without practice Prevalence of flexible employment and changes over time According to the analysis of the LFS, over the period from 2001 to 2011 around one-in-ten workers worked flexitime. This proportion peaked during 2010 and 2011, having increased over the period from the early 2000s. However, Table 8 shows that after 2011 the percentage of 50 With practice 11.4% 5.5% 10.0% 10.8% 5.3% 10.7% 12.1% 7.4% 9.1% 10.7% 10.9% 8.9% 9.1% 10.5% 9.2% 13.3% 9.3% 11.7% 10.1% 10.6% 9.1% 10.7% 8.0% 9.7% 17.8% 21.0% 0% 5% 10% 15% 20% 25% Percentage of employees
51 workers using flexitime appeared to decrease. Flexitime was the most prevalent type of flexible employment after part-time hours. Annual-hours contracts and term-time only working were used by an average of around 4 per cent of workers in the years between 2001 and Again, use of both of these arrangements peaked in 2011, but then decreased, although in the case of term-time only working, the proportion of employees using this practice in 2012 remained higher than in the early 2000s. Fewer than one-in-a-hundred workers used each of the other types of flexible employment considered (job-sharing, compressed hours and zero-hours contracts) over most of the period from 2001 to The use of compressed hours (such as nine-day fortnights and 4.5 day weeks) has decreased over time; in 2001 the percentage of workers with this type of employment pattern was 1.6 per cent, but by 2013 this percentage had halved. Table 8 also shows the proportion of self-employed workers, part-time workers, temporary workers and those that worked mainly from home over the period from 1998 to On average, just over one-in-four workers were part-time. This proportion has increased by about two percentage points from the late 1990s. On average, 13 per cent of those in work were selfemployed, but this percentage has increased over time. By contrast, the proportion of those on temporary contracts has decreased since the late 1990s; in 1999 the share of workers on temporary contracts was 7.5 per cent, but by 2013 this figure had fallen to 6.3 per cent. The proportion of workers on temporary contracts appeared to decline markedly during the recession. The table also shows the proportion of workers working mainly at home. This is below 3 per cent on average, but has risen over the period of analysis. The second part of Table 8 shows the proportion of workers engaged in each of the different types of temporary work. Focusing on the period from when the prevalence of these practices can be compared in a consistent way (see section for details), the majority of temporary workers were employed on a fixed period/fixed task basis. This arrangement accounted for around 3 per cent of total employment, but declined over time. Casual or agency work were also common forms of temporary employment, but the proportion of the workforce engaged in casual work also decreased over time. The least common form of temporary work was seasonal employment, with only around one-in-200 workers on this type of contract. 51
52 Table 8 Percentage of workers using flexible employment practices, Mean Flexitime Annual-hours contract Term-time only contract Job-sharing Compressed hours Zero-hours contract Part-time Self-employed Homeworking Temporary Of which: Seasonal Fixed period/task Agency Casual Other Source: Labour Force Survey Weighted estimates. Note: ONS recommends that analysis of flexitime, annual hours contracts, term-time only contracts, job-sharing, compressed hours and zero-hours contracts is restricted to the period 2001 onwards. The extent of part-time work, self-employment, home-working and temporary work can be assessed over the period from 1998 to The question on the type of temporary contract was multicoded from 2012 onwards and so figures for are not comparable with those for 2012 and For this reason, the average for is omitted. 52
53 Flexible employment by gender The fact that women are much more likely than men to work part-time is well-established. This is illustrated by Table 9 which shows that whilst around two-fifths of women worked part-time in 2013, this was true of only around one-in-eight men. However, there are some signs that the proportion of men working part-time has increased since the introduction of the NMW. Over the period from 2001 onwards, women have made greater use of flexitime than men. However, the proportion of women using flexitime has fallen since 2004, whereas for men, levels have been fairly stable for the whole period. Similarly, in the early 2000s, the use of annual-hours contracts was greater amongst women than men, but this gap has narrowed over recent years, due to a drop in the proportion of women employed on annual-hours contracts. The use of term-time only working is much higher amongst women than men, but again, this gap has narrowed in recent years, largely due to the fall in the use of term-time only contracts by women. 53
54 Table 9 Percentage of workers using flexible employment practices , by gender Mean Men Part-time Self-employment Homeworking Temporary employment Flexitime Annual-hours contracts Term-time only Job-sharing Compressed hours Zero-hours Women Part-time Self-employment Homeworking Temporary employment Flexitime Annual-hours contracts Term-time only Job-sharing Compressed hours Zero-hours Source: Labour Force Survey Weighted estimates. Note: ONS recommends that analysis of flexitime, annual hours contracts, term-time only contracts, job-sharing, compressed hours and zero-hours contracts is restricted to the period 2001 onwards. 54


55 Flexible employment by age Turning to differences between those eligible for the adult rate of the NMW and younger workers, it is apparent that younger workers are more likely to work part-time than adults (see Figure 14). 9 Three-in-four workers eligible for the year old rate are employed on a parttime basis. In the case of workers eligible for the youth development rate, this proportion falls to two-fifths. The proportion of employment accounted for by self-employment is significantly higher for adults than for younger workers. In contrast, younger workers are more likely to be employed on temporary contracts compared to adults. Figure 14 Percentage of workers using flexible employment practices , by age group Source: Labour Force Survey Weighted estimates. 9 As the threshold for eligibility for the adult rate of the NMW has changed over time, this analysis regards workers as adults if they were aged 22 and over before October After this point those aged 21 or more are considered adults. 55


56 Figure 15 reveals that the most prevalent form of temporary work for adults is that which involves employment for a fixed task or period. For those eligible for the year old rate of the NMW, the most common types of temporary work are casual or seasonal employment, whilst for those eligible for the youth development rate, the most prevalent forms of temporary work are that for a fixed period or task and casual work. Figure 15 Breakdown of temporary work , by age group Source: Labour Force Survey Weighted estimates. Figure 16 illustrates the differences in the use of flexible working time arrangements across age groups and shows how this has varied over time. Flexitime is more frequently used by adults, but the proportion of workers using this type of contract has declined in recent years. The prevalence of annual-hours contracts appears to decline with age, but has decreased during the recession across all age groups. The prevalence of compressed hours is somewhat similar across age groups, with signs of decline since Term-time only working was significantly more common amongst adults than younger workers. In contrast, the proportion of workers on zerohours contracts is higher within the younger age groups. Since the recession, the use of this type of contract has increased for those eligible for the youth rates, reversing a declining trend. 56


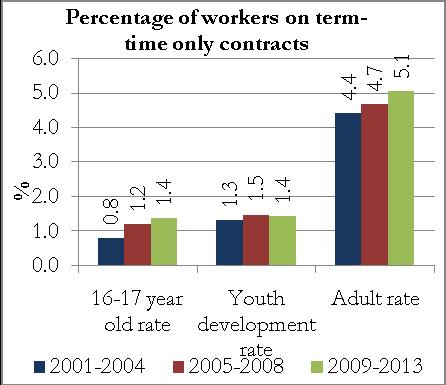
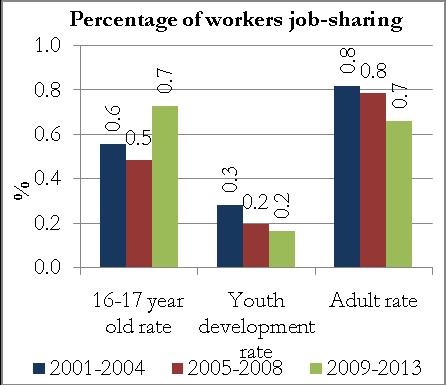
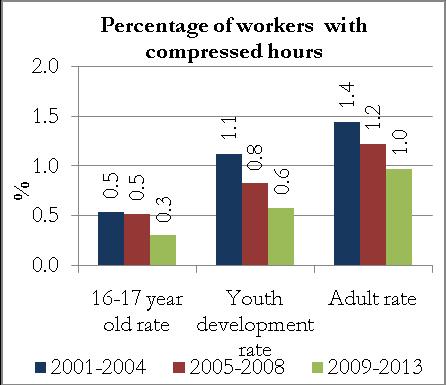
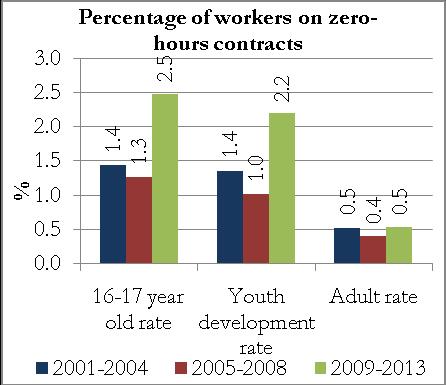
57 Figure 16 Incidence of flexible working time arrangements , by age group Source: Labour Force Survey Weighted estimates. 57


58 Flexible employment by earnings Figure 17 illustrates the use of flexible employment practices in different segments of the earnings distribution and the changes experienced over time. The focus is on those eligible for the adult rate of the NMW. As a result, the figures in this section exclude the period before the introduction of the NMW. The figures show the prevalence of flexible employment for four earnings categories: those at or below the NMW; those earning up to 10 per cent more than the NMW; those earning between 10 and 20 per cent over the NMW; and those earning more than 20 per cent over the NMW. The percentage of workers on part-time contracts declines with earnings. Whilst more than half of those earning the NMW or less are employed on part-time contracts, only one-in-six of those in the highest-earning category work part-time. Over the time-period considered there has been a decrease on the use of part-time workers, except for those at the top of the earnings distribution. A similar picture is apparent when analysing the prevalence of temporary work across the earnings distribution. The proportion of workers on temporary contracts decreases with the level of earnings. However the use of temporary contracts has increased since the recession, particularly for those workers at or below the NMW. Figure 17 Percentage of workers using flexible employment practices , by earnings Source: Labour Force Survey Weighted estimates. 58


59 Due to the relatively small numbers of respondents engaged in temporary work over the period following the introduction of the NMW, Figure 18 shows the proportion of the workforce employed on each type of temporary contract grouped over two time periods, rather than three. The most prevalent forms of temporary work for those earning the NMW or less is causal work (Figure 18). For the highest paid group, the most prevalent type of temporary work is that which involves carrying out a fixed task, or working for a fixed period. Figure 18 Breakdown of temporary work , by earnings Source: Labour Force Survey Weighted estimates. 59
60 Figure 19 shows that flexitime is most common amongst those at the top of the earnings distribution. The only group for whom the use of flexitime has increased since the recession are those at or below the NMW, although the increase has been relatively modest. The use of annual-hours contracts is more prevalent for those on higher earnings. While during the late 2000s the use of annual-hours contracts increased, it has fallen since the recession. This is apparent across all earnings groups. The highest proportion of workers on term-time only contracts is found for those earning between 10 and 20 per cent more than the NMW. The use of zero-hours contracts decreases with the level of earnings. Around one-in-100 workers earning the NMW or less are on zerohours contracts, but since the recession the proportion of workers on this kind of contracts has increased across all the earnings groups except those paid at least 20 per cent more than the NMW. 60


61 Figure 19 Incidence of flexible working time arrangements , by earnings Source: Labour Force Survey Weighted estimates. 61
62 % % % % Flexible employment by qualification level The incidence of flexible employment according to the level of qualification for those eligible for the adult rate of the NMW is show in Figure 20. The proportion of workers on part-time contracts is negatively related to the level of qualification. However, the proportion of part-time workers in the high- and medium-qualified groups has been rising over time. Figure 20 Percentage of workers using flexible employment practices , by qualification level Percentage of workers part-time 0.0 High Medium Low None Qualification level Percentage of workers on temporary contracts High Medium Low None Qualification level Percentage of workers selfemployed 0.0 High Medium Low None Qualification level Percentage of workers homeworking 0.0 High Medium Low None Qualification level Source: Labour Force Survey Weighted estimates. 62
63 % % % % The highest percentage of temporary contracts is found amongst highly-qualified workers and this is due to a higher incidence of fixed-term or fixed-period contracts for this group (Figure 21). The highest proportion of adult workers doing casual and seasonal work is in the lowerqualified groups. The incidence of agency work does not vary greatly across qualification levels. Figure 21 Breakdown of temporary work , by qualification level Percentage doing seasonal work High Medium Low None Qualification level Percentage doing agency work High Medium Low None Qualification level Percentage working for fixed period/on fixed task 0.0 High Medium Low None Qualification level Percentage doing casual work High Medium Low None Qualification level Source: Labour Force Survey Weighted estimates. The proportion of workers using flexitime decreases with the level of qualification and there is also a high incidence of term-time only contracts amongst the most highly-qualified workers (Figure 22). 63
64 % % 0.8 % % % % Figure 22 Incidence of flexible working time arrangements , by qualification level Percentage of workers on flexitime High Medium Low None Qualification level Percentage of workers job-sharing High Medium Low None Qualification level Source: Labour Force Survey Weighted estimates Percentage of workers on annualhours contracts 0.0 High Medium Low None Qualification level Percentage of workers with compressed hours 0.0 High Medium Low None Qualification level Percentage of workers on termtime only contracts 0.0 High Medium Low None Qualification level Percentage of workers on zerohours contracts 0.0 High Medium Low None Qualification level
65 Flexible employment by sector Having noted differences in the use of some of the flexible employment practices considered by gender, age, earnings and qualification level, this section turns to variations in the use of practices within different industries. It is unsurprising that industries should differ in their use of flexible employment, given that there is variation in the customers that they serve and the nature of demand for their products and services. The analysis that follows distinguishes between lowpaying and non-low paying sectors, using the industry-based definition described in Appendix 6 of the 2013 LPC report (LPC 2013). 65


66 Figure 23 illustrates the prevalence of flexible employment in the low-paying sectors in comparison to higher-paying sectors. On average, just over one-in-three workers in the lowpaying sectors work part-time. The proportion in the higher-paying sectors is lower, with approximately one-in-five workers employed on a part-time basis. There is little evidence of changes over time in the use of part-time work. Figure 23 Percentage of workers using flexible employment practices , by sector Source: Labour Force Survey Weighted estimates. The incidence of self-employment is also higher in the low-paying sectors. However, over time, there has been some convergence, with the proportion of self-employed workers decreasing in the low-paying sectors and increasing in the higher-paying sectors. The incidence of temporary work is lower in the low-paying sectors than elsewhere, but it has increased a little since the recession. Looking in more detail at the composition of temporary work (Figure 24), casual work is most common in the low-paying sectors, whilst agency work 66


.")

67 and contracts covering a fixed task or period of time are more common in the higher-paying sectors. Figure 24 Breakdown of temporary work , by sector Source: Labour Force Survey Weighted estimates. The use of flexitime, annual-hours contracts, term-time only contracts and job-sharing is on average higher in the higher-paying sectors (Figure 25). This difference is relatively larger for term-time only working and lower for annual-hours contracts. In contrast, the proportion of workers on zero-hours contracts is higher in the low-paying sectors. The proportion of workers on zero-hours contracts in the low-paying sectors has increased considerably since the recession. 67


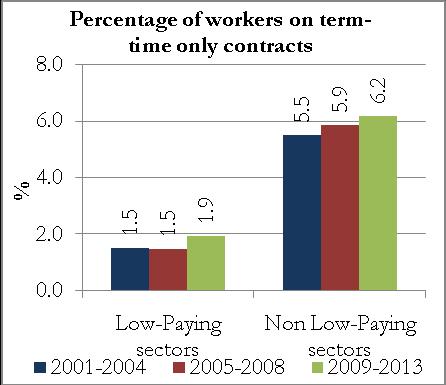
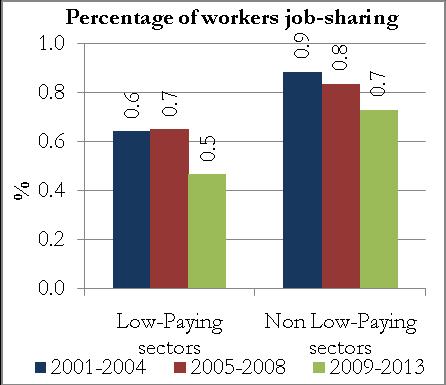
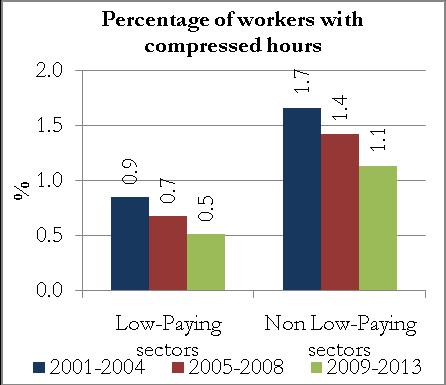

68 Figure 25 Incidence of flexible working time arrangements , by sector Source: Labour Force Survey Weighted estimates. 68