Students will understand the definition of mean, median, mode and standard deviation and be able to calculate these functions with given set of
|
|
|
- Baldric Spencer
- 5 years ago
- Views:
Transcription
1 Students will understand the definition of mean, median, mode and standard deviation and be able to calculate these functions with given set of numbers. Also, students will understand why some measures of central tendency are more accurate than others.


2 Statistics Recording the results from our studies. Must use a common language so we all know what we are talking about.


3 Descriptive Statistics Just describes sets of data. You might create a frequency distribution. Bargraphs or histograms.


4 Tools for Describing Data The bar graph is one simple display method but even this tool can be manipulated. Our brand of truck is better! Our brand of truck is not so different Why is there a difference in the apparent result?
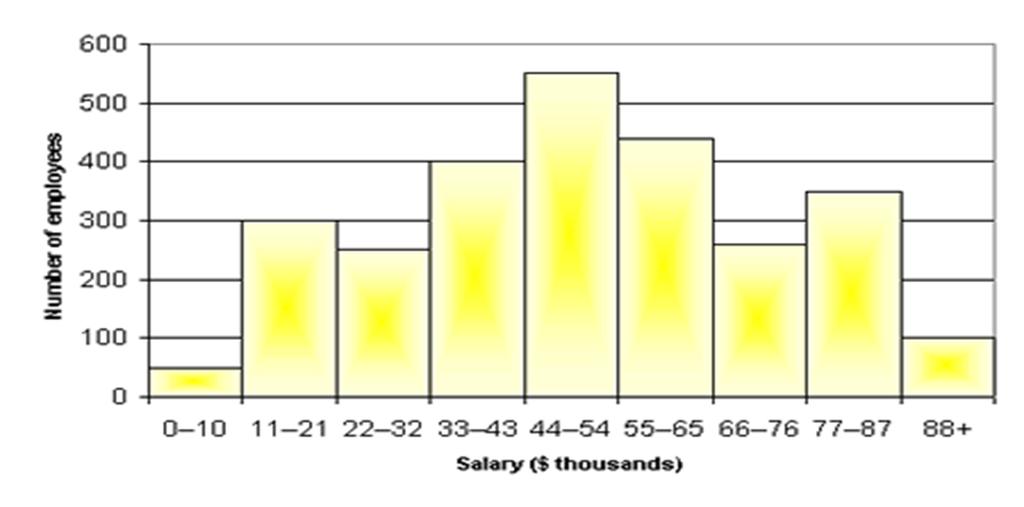
5 Number of times calling out Frequency distribution and histograms The frequency (f) of a particular 8 observation is the number of times the 6 observation occurs in the data. 4 The distribution of a variable is the 2 pattern of frequencies of the observation. 0 Frequency distributions are 12-1 generally reported in tables or Time histograms of day Histogram: A graph that consists of a series of columns, each having a class interval as its base and frequency of occurrence as its height.
6

7 Histograms vs. bar graphs Histograms look a lot like bar graphs. Think of histograms as "sorting bins." You have one variable, and you sort data by this variable by placing them into "bins." Then you count how many pieces of data are in each bin. The height of the rectangle you draw on top of each bin is proportional to the number of pieces in that bin.
8 Bar graph or Histogram? (Both allow you to compare groups.) We want to compare total revenues of five different companies. Key question: What is the revenue for each company? Bar graph We want to compare heights of ten oak trees in a city park. Key question: What is the height of each tree? Bar graph We have measured revenues of several companies. We want to compare numbers of companies that make from 0 to 10,000; from 10,000 to 20,000; from 20,000 to 30,000 and so on. Key question: How many companies are there in each class of revenues? Histogram We have measured several trees in a city park. We want to compare numbers of trees that are from 0 to 5 meters high; from 5 to 10; from 10 to 15 and so on. Key question: How many trees are there in each class of heights? Histogram
9 SCENARIO: - You are trying to decide if you want to take a class in school based on how the difficult the class is. You decide to use the grades of students who have taken the class previously as a measure of difficulty. - What are some ways of looking at the data to make your decision?
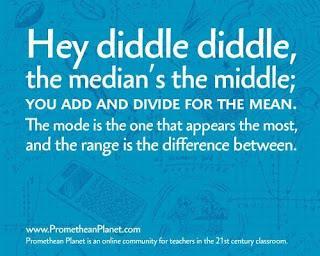
10 Measures of Central Tendency Median: The middle score in a rank-ordered distribution. If the median score is 85%, would you consider this an easy class? What if you found out that the grades were 42, 44, 50, 85, 85, 85, 85? Is median a great measure of central tendency? 10
11 Measures of Central Tendency Mode: The most frequently occurring score in a distribution. If you find a class with a mode of 86 would this be an easy class? Here are the grades: 14,25,32,45,50,60,86,86. Is mode a great measure of central tendency? 11
12 Measures of Central Tendency Mean: The arithmetic average of scores in a distribution obtained by adding the scores and then dividing by the number of scores that were added together. You have found a class with a mean of 85 and have decided that this must be an easy class. The grades were: 70,70,100,100. Would you feel confident that this an easy class? 12
13 Measures of Central Tendency It is important to always note which measure of central tendency is being reported. If it is a mean, one must consider whether a few atypical scores could be distorting it, or causing a skewed distribution. Skewed distribution: When scores don t distribute themselves evenly around the center. There are a few extremely high or low scores.
14 Measures of Central Tendency A Skewed Distribution 14

15 Central Tendency Mean, Median and Mode. Watch out for extreme scores or outliers. Let s look at the salaries of the employees at Dunder Mifflen Paper in Scranton: $25,000-Pam $25,000- Kevin $25,000- Angela $75,000- Andy $75,000- Dwight $75,000- Jim $350,000- Michael Measures of central tendency are Quick and easy, but outliers may distort the numbers.


16 Normal Distribution In a normal distribution, the mean, median and mode are all the same. The Bell Curve
17 Outliers skew distributions. If group has one high score, the curve has a positive skew (contains more low scores) If a group has a low outlier, the curve has a negative skew (contains more high scores) Distributions
18 Measures of variation Averages from scores with low variability are more reliable than those with high variability. Range: Difference between the highest and lowest scores in a distribution. Like with the mean, high and low scores could present a deceptively large range.
19