Sales Planning and Execution Excellence BENCHMARK Report Script for Mitel
|
|
|
- Sharleen Gilmore
- 5 years ago
- Views:
Transcription
1 1 Sales Planning and Execution Excellence BENCHMARK Report Script for Mitel The Mobile Workers Sales Planning and Execution BENCHMARK Report enables you to take command of a sales cycle, at the earliest possible time, by establishing your thought and value leadership with a competitively superior BENCHMARK assessment of a prospects business and financial operations versus BEST IN CLASS solutions. For this script we are displaying the BENCHMARK for Mitel to improve their sales planning and execution processes and technologies. The data that generates this report can be readily re-configured to BENCHMARK a prospect performance based on BEST PRACTICES for your solutions. By identifying the specific components of a prospects business processes and technologies where the greatest value lies in improvement, you can map these to the relative strengths and weaknesses of your solutions and those of your competitors. This provides you with an excellent early on perspective on which elements of your solution will be most valuable to this prospect and insight on your chances of winning a competitive sales cycle. Note that a blue dashed line is used to identify the start and the end of the report itself, and a green dashed line marks the beginning and the end of the discussion The first section of the report lists the contact information for the prospect and the sales person as well as the name and description of this BENCHMARK scenario. NOTE: Each section of the report includes a statement at the top that provides some initial guidance and interpretation of the meaning and use of that section These statements are customized for whether this report is intended for yourself or for your customer in this case, the interpretation is for Mitel.

2 SECTION 2A: TABLE 1: SUMMARY SALES EXCELLENCE BENCHMARK The Sales Excellence BENCHMARK consists of 10 business process and technology areas and 5 definitions for each that span the Maturity Grid of where companies current perform: from the lowest value of ENTRY LEVEL to the highest level of BEST IN CLASS. For other solutions there could be a different number of different areas driving your solution excellence. The prospect selects for each area which of the 5 Maturity Grid definitions best fits their current performance, and the model then determines their quantified performance versus BEST IN CLASS. All BENCHMARK TABLES are color coded to help you instantly recognize where the prospect is positioned versus BEST IN CLASS: for example, ENTRY LEVEL is color coded as RED to highlight that they have a great deal of upside potential to improve their current performance.

3 3 TABLE 1 displays: UNITS: POINTS or in %; MAXIMUM SCORE: 1000 points and 100% for a BEST IN CLASS definition for all 10 areas; YOUR SCORE; Mitel s score for this simulation; and YOUR OPPORTUNITY: The upside potential the difference between the 1000 maximum points and YOUR SCORE. The note below informs Mitel that their overall score was 117 out of a Maximum BEST IN CLASS score of 1,000 and that positions them as the lowest maturity grid segment overall: ENTRY LEVEL. Mitel has the significant upside potential to improve as much as 883 points.

4 4 SECTION 2B: CHART EB1: Your BENCHMARK Score and Upside Opportunity CHART EB1 displays in graphical format YOUR SCORE and YOUR UPSIDE OPPORTUNITY to readily grasp your performance and potential to improve. SECTION 3: TABLE 2: SUMMARY OF SALES EXCELLENCE BENCHMARK RECOMMENDED BEST PRACTICES The note below explains that TABLE 2 displays the 3 improvements in your current sales planning and execution processes and technologies that would increase your score and performance the most. This uniquely provides prospects with very high value consultative diagnostic and custom improvement recommendations, and should be used at the onset of the sales cycle to provide immediate prospect value and enable you to establish value leadership.

5 5 These top 3 areas are identified as the top 3 in TABLE 4 the ones with the highest IMPROVE POTENTIAL: in this case for Mitel: BENCHMARK REPORTS AVAILABLE: 143; PROSPECT VALUE PROPOSITION: 131; and DAILY IDEAL TASKS CALENDAR: 119. The conservative logic used is that to improve a prospect would adopt the business process and technology that is the next most mature versus where they are currently performing. This can be configured based on your desires to allow leapfrogging to higher levels of maturity if you feel that the prospect have the adaptive capacity to do this successfully. The TABLE shows, in addition to the custom recommendation, an explanation of how the adoption of this improved maturity grid level would directly improve your overall sales planning and execution performance. In this case, because Mitel is at such a low level of performance, even in the ENTRY LEVEL segment, these changes would improve Mitel s overall score by only 79 points and raise them to an overall score of 193 still in the ENTRY LEVEL segment.
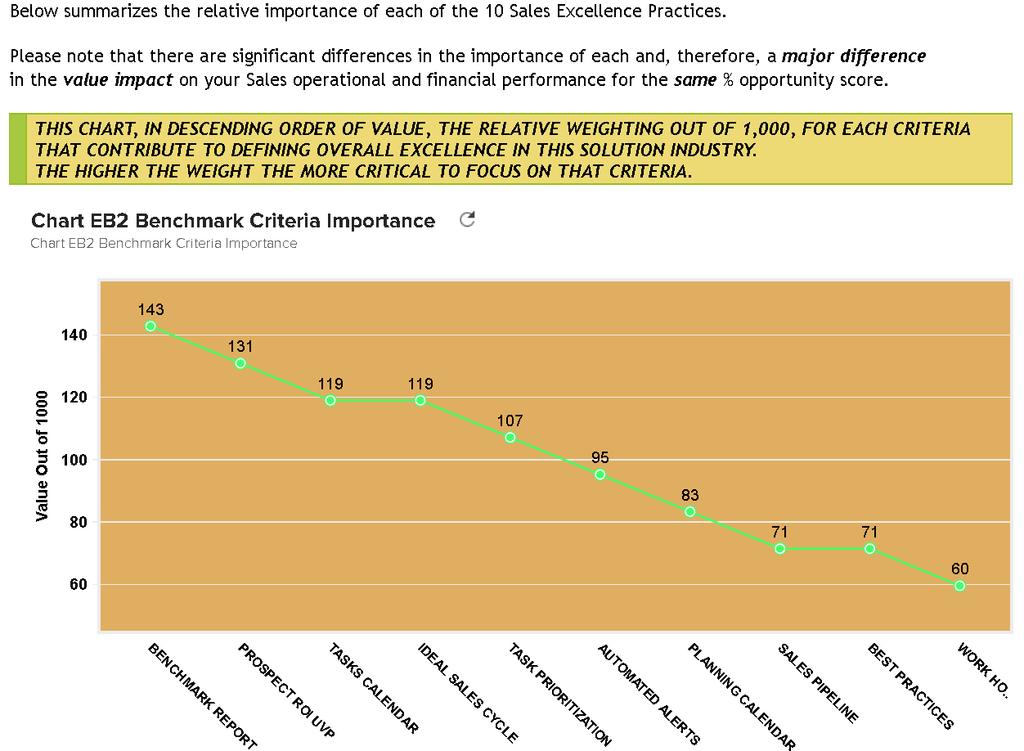
6 6 SECTION 4A: CHART EB2: BENCHMARK CRITERIA IMPORTANCE CHART 2 displays, in descending order from the left to the right, the prioritized ranking (out of a total 1000 point score) of the relative importance of each of the 10 BENCHMARK criteria in achieving Sales Planning and Execution excellence. In many cases prospects are unaware of what is really driving their competitive performance and frequently are not even aware of some of the most highly prioritized criteria. This CHART is critical to demonstrating to prospects that there is a coherent and systematic way to map their performance to the criteria most relevant to explaining their relative performance. Our research and analysis generated these values and we review the factors every 6 months. CHART 2 illustrates that having and deploying a BENCHMARK Report is the single most valuable criteria predicting your sales success for your specific solutions. The second most important factor is your use of a ROI Unique Value Proposition for prospects implementing your solutions. Similarly, it shows that tracking your work hours is relatively much less valuable and useful to achieving greater sales success.
7 7

8 8 SECTION 4B: TABLE 3: PRIOTITIZED SUMMARY OF SALES EXCELLENCE BEST PRACTICES RELATIVE IMPORTANCE TABLE 3 provides the data used in CHART EB2: BEST PRACTICE: THE NAME OF THE Best Practice Criteria; RANK: 1 being the highest / most important relative RANK and 10 being the lowest; % WIEGHTING: the maximum number of points for Best Practice maturity grid selection for this criteria as a % of the 1000 point total maximum; and MAXIMUM SCORE: the maximum number of points for Best Practice maturity grid selection for this criteria as a % of the 1000 point total maximum; The note below the table makes the key point that clearly all criteria are not of the same value and it is most valuable for prospects to focus on improvements that recognize the greater relative value of moving up the maturity grid for a criteria farther to the left on the chart than to the right.

9 9 SECTION 5A: CHART EB3: YOUR SALES EXCELLENCE BENCHMARK UPSIDE POTENTIAL CHART 3 displays, in descending order from the left to the right, your prioritized upside potential for each of the 10 BENCHMARK criteria in achieving Sales Planning and Execution excellence. The criteria on which you should prioritize your focus is the BENCHMARK REPORTS AVAILABLE, as this criteria holds the potential to improve your overall Sales Excellence BENCHMARK score by the most points: 143. One key point is that it is extremely difficult for an organization or individual to focus on more than the 3 most critical initiatives at any one time, so the overall recommendation set in TABLE 2 include only the top 3 criteria from this chart and TABLE 4 below.
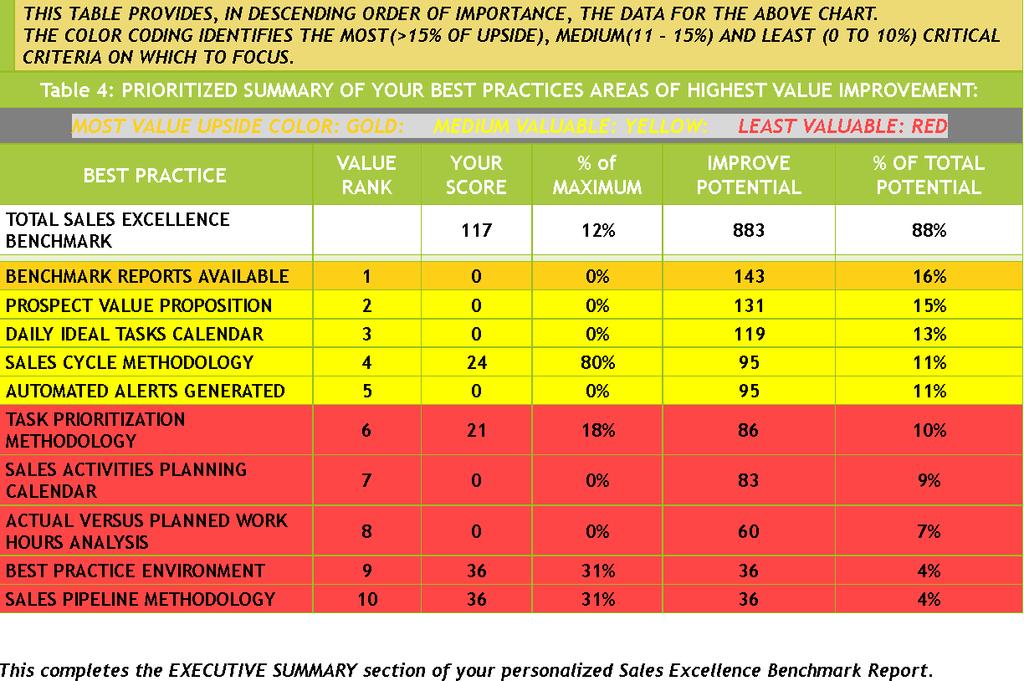
10 10 SECTION 5B: TABLE 4: PRIORITIZED SUMMARY OF YOUR BEST PRACTICES AREAS OF HIGHEST VALUE IMPROVEMENT TABLE 4 provides the data for CHART 3 and includes for the total and for each BENCHMARK Criteria, in descending order of the IMPROVE POTENTIAL: BEST PRACTICE: the name of the Best Practice Criteria; VALUE RANK: the prioritized value rank from the most important (1) to the least important (10), based on the IMPROVE POTENTIAL; YOUR SCORE: Based on the Maturity Grid selection, and the MAXIMUM SCORE for that Criteria from TABLE 3; % of MAXIMUM: YOUR SCORE as a % of the MAXIMUM SCORE from TABLE 3; IMPROVE POTENTIAL: the upside opportunity potential calculated as the difference between the MAXIMUM SCORE YOUR SCORE; % OF TOTAL POTENTIAL: the IMPROVE POTENTIAL as a % of the total IMPROVE POTENTIAL. The color coding enables you to instantly recognize the difference between the: MOST VALUABLE UPSIDE CRITERIA: in GOLD color; MEDIUM VALUE: in YELLOW color; and the LEAST VALUABLE: in RED color. Note that, in this scenario, improving the top 3 BENCHMARK Criteria would represent almost ½ of the potential from all 10 Criteria. This analysis immediately recommends to you to emphasize those modules and/or elements of your solution that would be most responsible for enabling the prospect to achieve the highest priority upside potential.
11 11
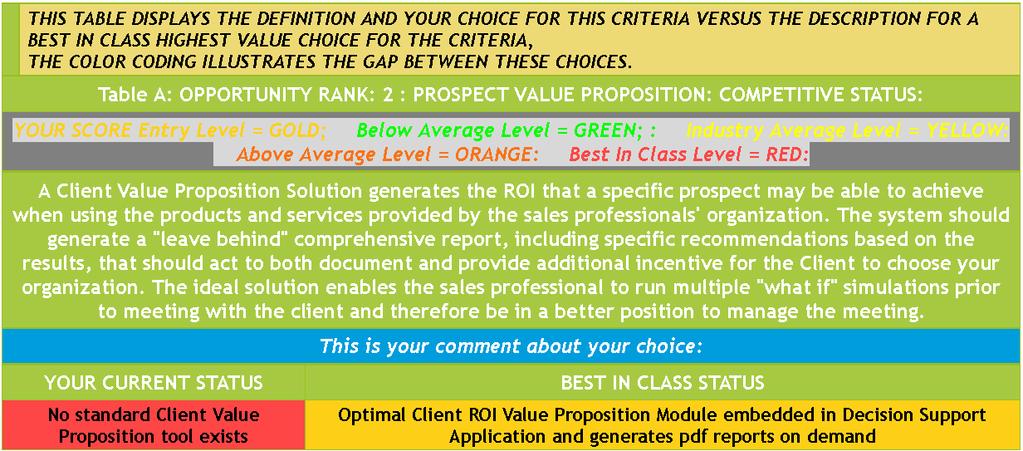
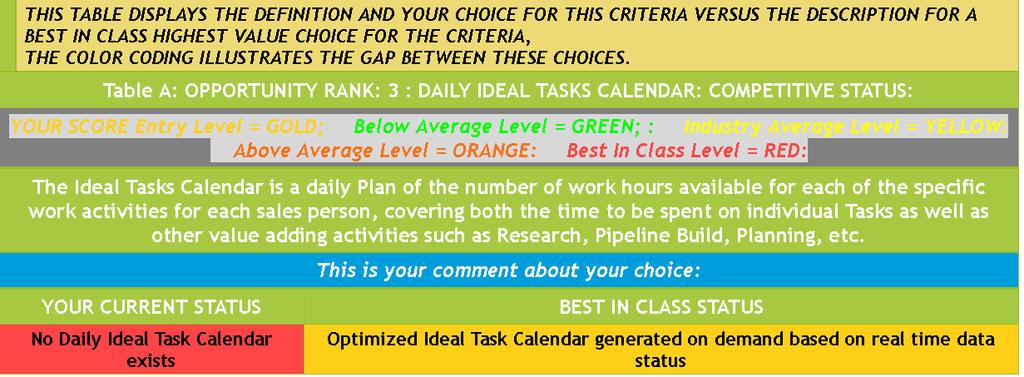
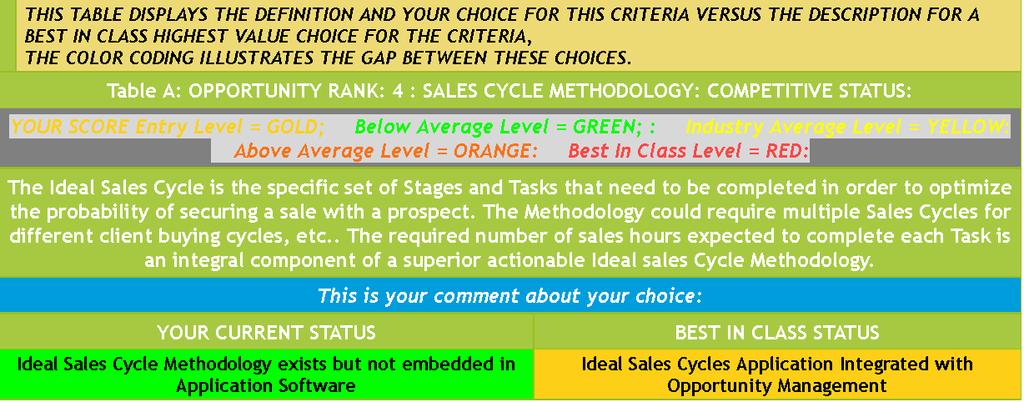
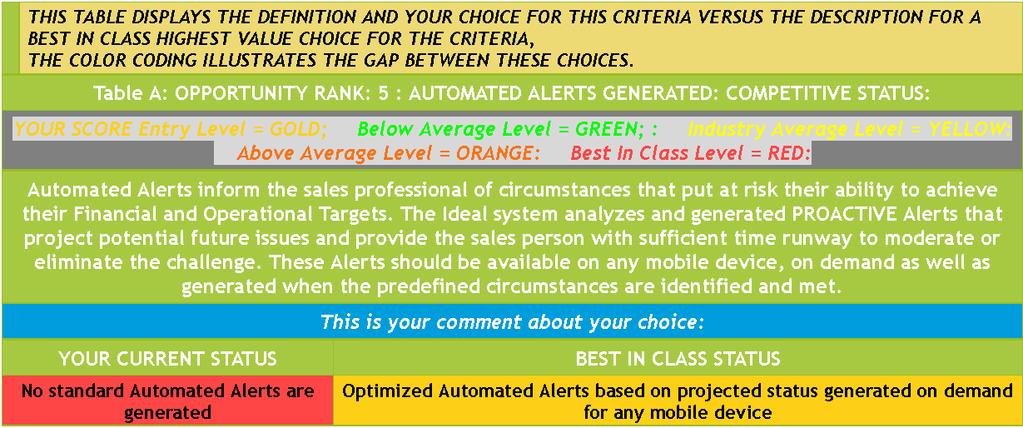
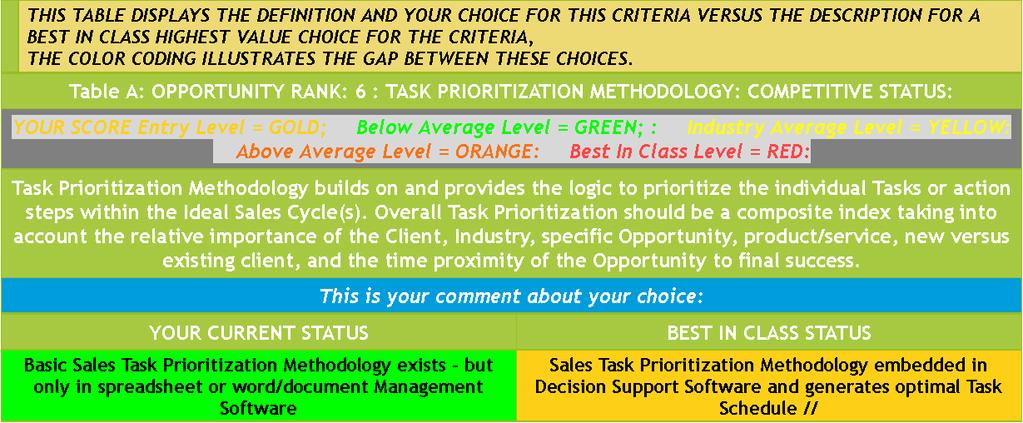
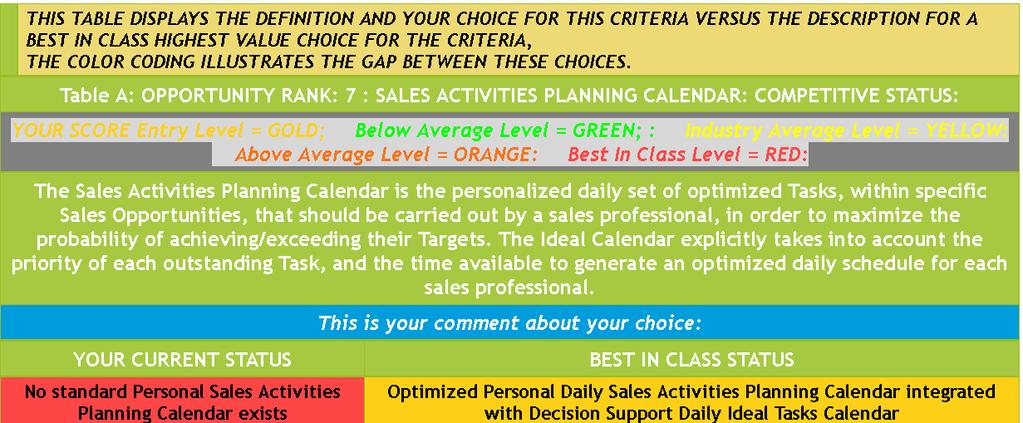
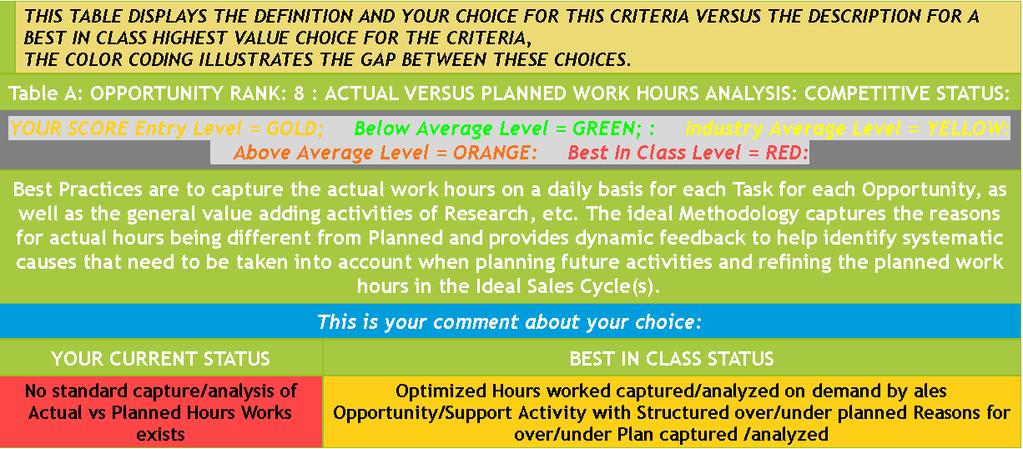
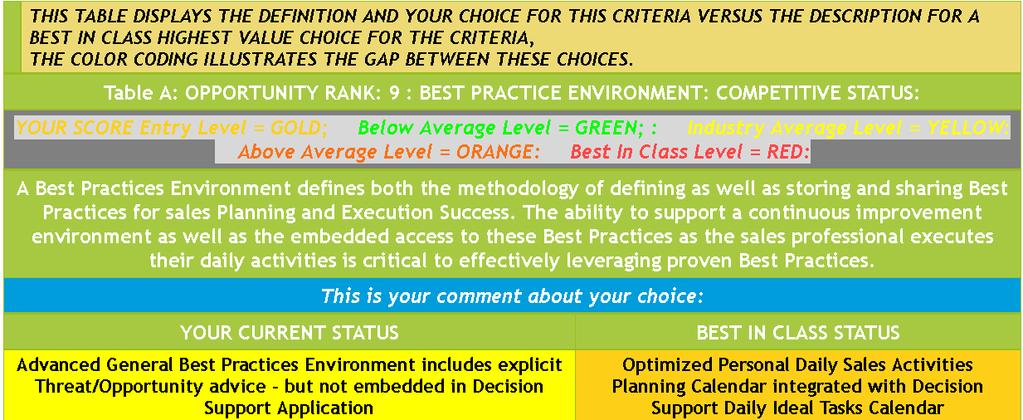
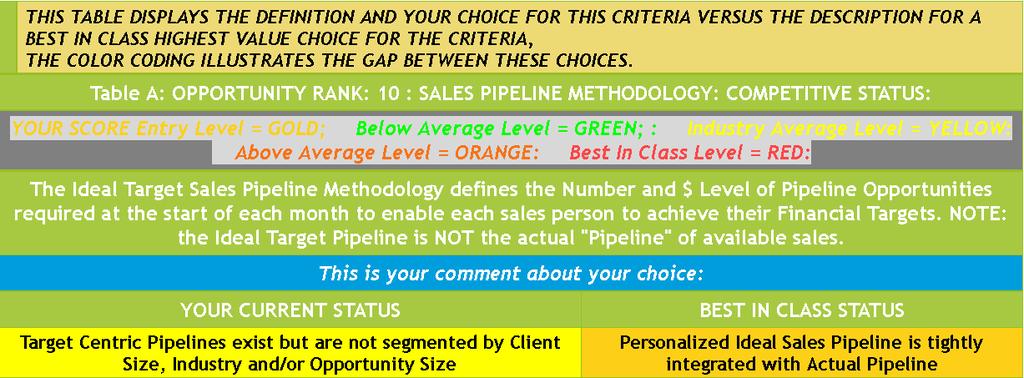
12 12 The next section provides tables, for each of the 10 BENCHMARK Criteria: TABLE A: COMPETITIVE STATUS; TABLE B: SUMMARY SCORE: and TABLE C: RECOMMENDATION. The 10 sets of TABLES are displayed in descending order of the IMPROVE POTENTIAL from TABLE 4, so the BENCHMARK CRITERIA with the greatest upside potential for improvement is displayed first: BENCHMARK REPORTS AVAILABLE. This script will discuss the TABLES for BENCHMARK REPORTS AVAILABLE, and display the TABLES for the other 9 BENCHMARK CRITERIA. TABLE A displays: DESCRIPTION: a detailed description of the BENCHMARK CRITERIA, including why it is important in enabling a prospect to achieve sales planning and execution excellence; COMMENT: any COMMENT that you could add to help better define and/or understand the MATURITY GRID description that a prospect selected: in this case, there were no comments so this element is blank; YOUR CURRENT STATUS: the name the selected MATURITY GRID POTENTIAL; and BEST IN CLASS STATUS: the name of the BEST IN CLASS MATURITY GRID description. The color coding in this TABLE allows you to instantly recognize how the YOUR CURRENT STATUS of the prospect compares to the BEST IN CLASS status. In this case, BENCHMARK REPORTS AVAILABLE is the BENCHMARK CRITERIA for which the prospect would gain the most benefit from improving, and the prospect status is at ENTRY LEVEL, as illustrated by the RED color in YOUR CURRENT STATUS.

13 13 TABLE B displays: VALUE RANK: the prioritized value rank from the most important (1) to the least important (10), based on the IMPROVE POTENTIAL; YOUR SCORE: Based on the Maturity Grid selection, and the MAXIMUM SCORE for that Criteria from TABLE 3; % of MAXIMUM: YOUR SCORE as a % of the MAXIMUM SCORE from TABLE 3; % OF TOTAL SCORE: YOUR SCORE for this BENCHMARK CRITERIA as a % of the prospects total score for this simulation; IMPROVE POTENTIAL: the upside opportunity potential calculated as the difference between the MAXIMUM SCORE YOUR SCORE; % OF TOTAL POTENTIAL: the IMPROVE POTENTIAL as a % of the total IMPROVE POTENTIAL. This provides you with a complete perspective on how the prospect scored in this BENCHMARK CRITERIA and where this score and upside potential fit relative to the prospects overall score and upside potential.


14 14 TABLE C displays: RECOMMENDATION: the custom recommendation for the prospect to migrate to a different MATURITY GRID description for this BENCHMARK CRITERIA. The standard approach is to recommend that the prospect moves from their current selected description to the next most valuable description in the MATURITY GRID. In this case, with the prospect at the ENTRY LEVEL description, the recommendation is to develop the Benchmark Criteria and identify and prioritize the Maturity Grid description choices.

15 15

16 16

17 17


18 18


19 19

20 20


21 21

22 22


23 23
24 24