Join via: Evaluating and Continuously Improving Processes, Programs, and Interventions
|
|
|
- Natalie Lawson
- 5 years ago
- Views:
Transcription

1 Evaluating and Continuously Improving Processes, Programs, and Interventions Join via: William Riley, Ph.D. Professor School for the Science of Health Care Delivery Cindy Murphy, R.N. Administrator Boone County Health Department 1 IU RICHARD M. FAIRBANKS SCHOOL OF PUBLIC HEALTH
2 Objectives for Domain 9 Evaluating and Continuously Improving Processes, Programs, and Interventions: Participants will be able to 1) use a performance management system to monitor achievement of organizational objectives, and 2) develop and implement quality improvement processes integrated into organizational practice, programs, processes, and interventions. National Public Health Accreditation Board Standards and Measures, Version IU RICHARD M. FAIRBANKS SCHOOL OF PUBLIC HEALTH IU RICHARD M. FAIRBANKS SCHOOL OF PUBLIC HEALTH
3 Standard 9.1: Use a Performance Management System to Monitor Achievement of Organizational Objectives Measure A Staff at all organizational levels engaged in establishing and/or updating a performance management system Measure A - Performance management policy/ system Measure A - Implemented performance management system Measure A - Implemented systematic process for assessing customer satisfaction with health department services Measure A - Opportunities provided to staff for involvement in the department s performance management interventions IU RICHARD M. FAIRBANKS SCHOOL OF PUBLIC HEALTH
4 Standard 9.2: Develop and Implement Quality Improvement Processes Integrated Into Organizational Practice, Programs, Processes, and Interventions Measure A - Established quality improvement program based on organizational policies and direction Measure A - Implemented quality improvement activities IU RICHARD M. FAIRBANKS SCHOOL OF PUBLIC HEALTH
5 Performance Management System for Public Health Departments William Riley, PhD Arizona State University Public Health Insights & INnovation December 18, 2015
6 Overview of Academic Perspective Distinguish between quality improvement and performance management Describe the Turning Point Model for Performance Management Relate performance management to Public Health Accreditation standards. Review the Turning Point Performance Management Self Assessment Survey 6 6
7 Quality Improvement (QI) in Public Health Quality Improvement: a continuous effort to achieve measurable improvements in process performance to improve the health of the community William Riley, et al Defining Quality Improvement in Public Health. Journal of Public Health Management and Practice, January/February 2010
8 Importance of QI to Public Health QI is among the best mechanisms to advance public health department performance and improve the health status of the population
9 Process Engineering Process-a series of steps to produce an outcome All work in public health is the result of a process Most processes are not deliberately designed. Process knowledge is essential in order to supplement professional knowledge
10 Common Features for a Quality Improvement Project Identifies a process from beginning to end Maps the process Improves the process using identified QI techniques by achieving a defined and measurable aim Use a QI Model Big QI, small qi
11 Quality Management Quality Improvement (process improvement): Maximize performance of existing process Determine causes of variation Establish control Create conditions for further improvement Quality Control (process control): Maintain performance, and perhaps Incrementally improve Quality Planning (process design): Provide a whole new service/product, OR (re)align process performance to customer needs, OR/AND Obtain whole new level of performance for existing process (stable but not capable) 11
12 Performance Management (PM) in Public Health Consists of all the activities undertaken to ensure that goals of a health department are consistently being met in an effective and efficient manner. A comprehensive approach to manage two critical elements of an organization: the behavior and results of an organization. Performance management focuses on results at all levels and areas: organization wide, a department, employee, and its processes.
13 Levels of Performance Management Strategic performance management- is a process which guides the development of a clear mission, vision, and goals to position the organization to serve the community. Operations performance management- is all the activity within an organization to achieve objectives(based on clear measureable steps) to attain these goals. Personnel performance management-consists of the systems to recruit, orient, train, motivate and evaluate the staff of the organization.

14 PHF s Performance Management System This graphic of the Turning Point PM System was refreshed in 2012 by PHF to include: Visible Leadership Transparency Strategic Alignment Culture of Quality Outcome Focus 14

15 Leadership Roles for PM/QM Ensure alignment - connect strategic plan, CHIP and QI plan, especially in implementation plans Know and use performance management and quality principles Implement a performance measurement system Assure adequate infrastructure for quality planning and improvement activities, including training and conducting projects Communication plan and reward progress and improvements 15
16 Turning Point PM Assessment Tool ess_the_performance_management_self_assessment_tool.aspx For each section, numerous questions serve as indicators of your performance management capacity. These questions cover critical elements of your PM capacity such as visible leadership, having the necessary resources, skills, accountability, and communications to be effective in each component. 16
17 Line of Sight Framework How do our day to day job-related activities impact the longer-term health indicators or impact goals of our health department? Example: My job is to process food stamp applications so that no child goes hungry in Clackamas County MarMason Consulting
18 LINE OF SIGHT: Communication & Increase access to and consumption of fresh fruits and vegetables Developed by Kane County IL So that 2016 Goal 17.3% Adults, 30.6% Children Eat 5/day So that By 2016, 50% of Kane adults have seen a KCHD ad/message about eating more fruits & vegetables So that # hits on webpage # articles in newspaper # Twitter followers # phone calls # FB fans/likes Actual time/planned time % of planned press releases out each month % of planned FB posts/how many actual % of trained staff in FB post each month % of identified staff trained in FB/ Twitter % of planned contests/incentives per month initiated % of planned respondents who respond MarMason Consulting
19 LINE OF SIGHT: Partnerships (Schools) & Increase access to and consumption of fresh fruits and vegetables Developed by Kane County IL So that 2016 Goal 17.3% Adults, 30.6% Children Eat 5/day So that % of school-age children in free/ reduced lunch program that are meeting standards So that % of school districts that meet all 9 USDA nutrition standards Assess each school district s lunch programs MarMason Consulting
20 Staff Feedback Ask program staff members to provide feedback regarding the following questions: What is the ultimate goal your program is trying to achieve? What are ways that you/your team makes progress in achieving the goal described above? Are there any current challenges that get in the way of achieving your program s goals
21 so that Line of sight so that so that (ultimate goal) so that (long-term outcome) (short-term outcome) (short or mediumterm outcome) (mediumterm outcome) MarMason Consulting


22 Measurement Reporting and Taking Action Line of Sight Program and Individual Level Performance Measures Detailed level review of data Weekly or monthly review Take Action Immediately Division Level Performance Measures Exception or Summary level review of data Quarterly review Take Action on Prioritized Issues Quality Council and Leadership Level Performance Measures High level review of data Annual/Biennial Review Take Action on Vital Few MarMason Consulting 22
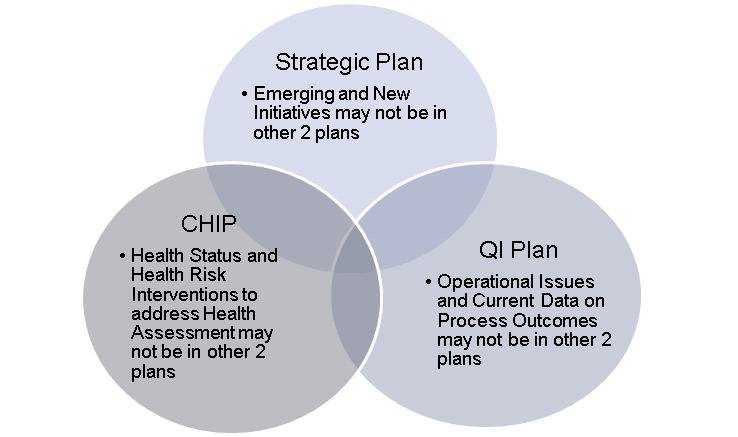

23 CHA/CHIP/SP/QI Plan 23
24 Section 1. Visible Leadership 1. Senior management demonstrates commitment to utilizing a performance management system Never/ Almost Never Some-times Always/ Almost Always 1. Senior management demonstrates commitment to a quality culture 1. Senior management leads the group (e.g., program, organization or system) to align performance management practices with the organizational mission 1. Transparency exists between leadership and staff on communicating the value of the performance management system and how it is being used to improve effectiveness and efficiency 1. Performance is actively managed in the following areas (check all that apply) A. Health Status (e.g., diabetes rates) A. Public Health Capacity (e.g., public health programs, staff, etc.) A. Workforce Development (e.g., training in core competencies) A. Data and Information Systems (e.g., injury report lag time, participation in intranet report system) A. Customer Focus and Satisfaction (e.g., use of customer/stakeholder feedback to make program decisions or system changes) A. Financial Systems (e.g., frequency of financial reports, reports that categorize expenses by strategic priorities) A. Management Practices (e.g., communication of vision to employees, projects completed on time) A. Service Delivery (e.g., clinic no-show rates) 1. There is a team responsible for integrating performance management efforts across the areas listed in 5 A-I 24
25 Section II: Performance Standards 1. The group (program, organization or system) uses performance standards Never/ Almost Never Sometimes Always/ Almost Always 1. The performance standards chosen used are relevant to the organization s activities 1. Specific performance targets are set to be achieved within designated time periods 1. Managers and employees are held accountable for meeting standards and targets 1. There are defined processes and methods for choosing performance standards, indicators, or targets A. National performance standards, indicators, and targets are used when possible (e.g., National Public Health Performance Standards, Leading Health Indicators, Healthy People 2020, Public Health Accreditation Board Standards and Measures) A. The group benchmarks its performance against similar entities A. Scientific guidelines are used A. The group sets priorities related to its strategic plan A. The standards used cover a mix of capacities, processes, and outcomes 1. Performance standards, indicators, and targets are communicated throughout the organization and to its stakeholders and partners 33
26 PHF PM Assessment: Section III. Performance Measurement 1. The group (program, organization, or system) uses specific measures for established performance standards and targets Never/ Almost Never Sometimes Always/ Almost Always Note details or comments mentioned the assessment during A. Measures are clearly defined A. Quantitative measures have clearly defined units of measure A. Inter-rater reliability has been established for qualitative measures 1. Measures are selected in coordination with other programs, divisions, or organizations to avoid duplication in data collection 1. There are defined methods and criteria for selecting performance measures A. Existing sources of data are used whenever possible A. Standardized measures (e.g., national programs or health indicators) are used whenever possible A. Standardized measures (e.g., national programs or health indicators) are consistently used across multiple programs, divisions, or organizations A. Measures cover a mix of capacities, processes, and outcomes 1. Data are collected on the measures on an established schedule 1. Training is available to help staff measure performance 1. Personnel and financial resources are assigned to collect performance measurement data [1] For a list of criteria and guidance on selecting measures, refer to Lichiello P. Guidebook for Performance Measurement. Seattle, WA: Turning Point National Program Office, 1999:65. [2] For examples of sources of standardized public health measures, refer to Health and Human Services Data Systems and Sets (p. 103) in the Healthy People 2010 Toolkit: A Field Guide to Health Planning at [3] Donabedian, A. The quality of care. How can it be assessed? Journal of the American Medical Association. 1988;260:
27 PHF PM Assessment Section IV: Reporting Progress 1. The group (program, organization or system) documents progress related to performance standards and targets Never/ Almost Never Some-times Always/ Almost Always 1. Information on progress is regularly made available to the following (check all that apply) A. Managers and leaders A. Staff A. Governance boards and policy makers A. Stakeholders or partners A. The public, including media A. Other (Specify): 1. Managers at all levels are held accountable for reporting performance A. There is a clear plan for the release of performance reports (i.e., who is responsible, methodology, frequency) A. Reporting progress is part of the strategic plan 1. A decision has been made on the frequency of analyzing and reporting performance progress for the following types of measures (check all that apply) 27
 2015-2017 QUALITY")
28 BOONE COUNTY HEALTH DEPARTMENT (BCHD) QUALITY IMPROVEMENT PLAN
29 OVERVIEW Culture of Quality Roles and Responsibilities Quality Improvement Projects Staff Training Communication

30 CULTURE OF QUALITY Six phases of quality: PHASE 1: No Knowledge of QI PHASE 2: Not Involved with QI Activities PHASE 3: Informal or Ad Hoc QI PHASE 4: Formal QI Implemented in Specific Areas PHASE 5: Formal Agency-Wide QI PHASE 6: Organization Wide Culture of QI The overall state of QI in BCHD is Phase 3: Informal or Ad Hoc QI.
31 FOUNDATIONAL ELEMENT SUB-ELEMENT 1. Employee Empowerment 1.1 Enabling Performance 1.2 Knowledge, Skills and Abilities 2. Teamwork and Collaboration 2.1 Team Performance 3. Leadership 3.1 Culture 2.2 Learning Communities 3.2 Resourcing and Structure 4. Customer Focus 4.1 Understanding the Customer 5. Quality Improvement Infrastructure 4.2 Satisfying the Customer through the Value Stream 4.3 Reprioritizing and Creating Programs and Services 5.1 Strategic Planning 5.2 Performance Measurement 5.3 Annual Quality Improvement Planning 5.4 Administrative and Functional Processes and Systems 6. Continual Process Improvement 6.1 Selecting and Applying Methods 6.2 Planning for Process Improvements 6.3 Testing Potential Solutions 6.4 Extracting Lessons Learned 6.5 Sharing of Best Practices 6.6 Effectively Installing Standardized Work ORGANIZATIONAL CULTURE OF QUALITY SAT: ELEMENTS AND SUB- ELEMENTS
32 ROLES AND RESPONSIBILITIES Quality Improvement Council (QI Council) Oversee QI efforts and provide ongoing leadership Quality Improvement (QI) Teams Work on QI projects Board of Health Approve/adopt the QI plan and approve budget with allocated resources for QI activities All Staff Participate in QI projects and training

33 QUALITY IMPROVEMENT PROJECTS Project Identification: PHAB Accreditation domains, data from the performance management system database and customer satisfaction surveys, program evaluations Prioritization method: Criteria rating process No current QI projects however future projects will use the PDSA cycle
34 TRAINING New employees orientation to BCHD s QI initiatives Online QI learning modules for all staff Ongoing staff training Program specific QI training Just-in-time training by QI Council member for active QI teams PDSA cycle training for all staff Advance QI training for QI Council
35 COMMUNICATION All BCHD Employees Annually during all staff meeting in the spring and the department s shared drive Board of Health Receive updates on quality initiatives annually during meeting in the spring Public Via the website
36 RECENT QI PROJECT Survey of Food Establishments regarding our annual food permitting process.
37 FUTURE QI PROJECTS Chart review: Review of client s record of service, including immunizations, STD, etc. This review includes thoroughness and completeness of record including dates, routes, signatures etc.. Inspection review: Review of permitting process including septic, foods, etc. This review incudes timely process of application, site assessment etc. Client Feedback: Cards placed in waiting areas to see how we can improve our services
38 CONTACT Boone County Health Department 116 W Washington St. B 202 Lebanon, IN Cindy A. Murphy, RN cmurphy@co.boone.in.us


39 Questions, Comments? Presenters: William Riley, Ph.D. Professor School for the Science of Health Care Delivery Cindy Murphy, R.N. Administrator Boone County Health Department IU RICHARD M. FAIRBANKS SCHOOL OF PUBLIC HEALTH
40 Domain 9 Resources Title Description Link Association of State and Territorial Health Officials (ASTHO) Library of sample documentation per domain Community Guide PHAB Crosswalk (CG) Crosswalk of PHAB /Community%20Guide- PHAB%20Crosswalk%20Version%201.pdf National Association of County and City Health Officials (NACCHO) Public Health Accreditation Board (PHAB) Public Health Foundation Public Health Quality Improvement Exchange (PHQIX) Examples of documentation for Domain 9 Tools, resources, information, research on voluntary public health accreditation Public Health Quality Improvement Handbook Exchange of ideas and project outcomes, tools, and resources ure/accreditation/upload/domain-9.pdf /PublicHealthQIHandbook.aspx IU RICHARD M. FAIRBANKS SCHOOL OF PUBLIC HEALTH


41 Need 1.5 CEUs? Was this webinar helpful to you? Save the Date! Please join us on January 29: Contributing to and Applying the Evidence Base of Public Health 41 IU RICHARD M. FAIRBANKS SCHOOL OF PUBLIC HEALTH