Kettering Borough Council Our Journey of Improvement
|
|
|
- Jack Jordan
- 5 years ago
- Views:
Transcription

1 Kettering Borough Council Our Journey of Improvement APSE Performance Networks Seminar London July 2017 Kettering Borough Council Service Overview Performance Monitoring
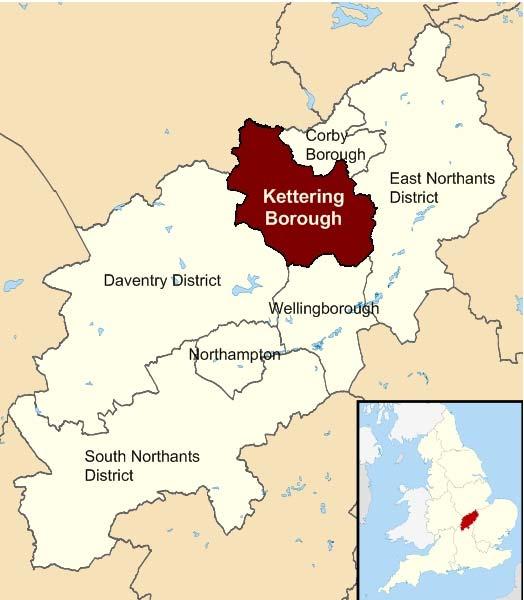
2 Northamptonshire
3 Kettering s Waste Facts In-House Service Collection Authority Servicing 44,000 properties 44 staff Operating 5 days over a 4 day 9.25 hrs per day 37 hrs RCV s, Split bodied 70/30, 18, 26 and 32 tonne vehicles Operating 7 domestic and 1 commercial round Each crew member walks 14 miles on an average day Each crew empties between 1500 and 2000 bins per day Emptying a total of 4,472,520 bins per year Returning to 1,467 bins reported missed bins Covering 4 towns and 28 villages of varying scale. Travelling 127,331 miles per year Using 180,419 litres of diesel
4 What We Do Domestic Collections Refuse and Recycling 800 Commercial Customers operate 3 days 616 residents receive Assisted Collections Schedule 2 Waste 143 customers charged 1409 Bulk Collections offering 6 items twice a year Clinical Waste - Chargeable collections! Christmas Tree Collections /16 Bring Bank Operating at 11 Sites KBC / 32 borough Emptying of Dog Waste and Litter Bins Bin repairs, replacements, new and additional bin deliveries within 5 working days.
5 Borough Recycling Pre 2002 recycling rate 2% via Bring Banks (32 sites) Alternative Weekly Collections introduced 2004 New co-mingled scheme introduced 2013 with (11 bring bank sites) % 2013/ % 10 months of new scheme 2014/ % Co-mingled scheme 2015/ % Nominated for APSE Best Performer Refuse 5 years running - Winner 2015

6 Weight v Weight Glass Glass Can you spot the Difference
7 The Difference Glass One bottles weighs 496g the other 365g Difference grams of material More volume needed to be collected 3:2 ratio bottles more for 1 tonne More Volume for Same Weight
8 Overview 2004 Changed to Alternatively Weekly - introduced kerbside box recycling 35,000 t General Waste Overall increased container capacity from 240 litre weekly to over 300 litres - (240 black/240 Grey/55L red/ 70L blue) 2013 Kerbside recycling to Co Mingled - Increased Recycling Capacity of containers to 720 litres Dry recycling 240 litre bins as many as needed free of charge increasing capacity further 2015 Multiple green waste bins free of charge 2016 Reduced General Waste Bin Size (240L to 180L new and replacements 2016 Combined Tonnage 38,000t Increase recycling year on year whilst many report reduction
9 Health and Safety Safety Training High Focus Reversing DVD Reversing Practices Tool Box Talks Constant and Continued field Monitoring Refresher training and field assessments Train the Trainer - staff development Full training programme Drivers hand book and working procedures Risk Assessments working with the team Regular team meetings performance reviews all levels PPE Armani or Boss?
10 Strong Focus on Education National Campaigns Master Composters School Curriculum workshops School Assemblies WI s, Parish Councils, Fun days and Road shows Scouts, Brownies, Beavers etc. Coffee mornings and society groups Field Trips to the depot Dedicated education team and bus


11 Waste Ted Education Team Member
12 The Main Ingredient to achieving The Team success? Include them in final decision making Keep them in the loop Make them feel valued Keeps morale up Invest in you staff time and appreciation (not always monetary) Why
13 Our Staff: The Team Are the face of the Council And they make the service work Our Staff contribute to: Service Standards Managing and Meeting Budgets Reducing Cost s Efficiencies Performance levels Personal Development Promote within Work with and appreciate your team and they will work with you.


14 Staff are key to High Performance & Excellent Service Delivery

15 Dragon Boat Race Moral Boosting Activities

16 Kettering s Ted s Wasted Wombles
17 Projects Making the Difference Projects to provide a thorough cleanse of the area Delivered in a short time scale Noticeable difference and impact within the community. Engaging the Community door knocking and surveys Delivered within Areas of high deprivation High Crime Hotspots Criminal Activities Tackling Environmental Issues Fly-tipping, Dog Fouling, Litter, Graffiti, Weeds, Road/Street Sweeping, Refuse and Recycling, Bins on Streets, Contamination and Side Waste. Waste Amnesty


18 Project Elizabeth Waste Amnesty Day


19 Waste Amnesty Project Elizabeth


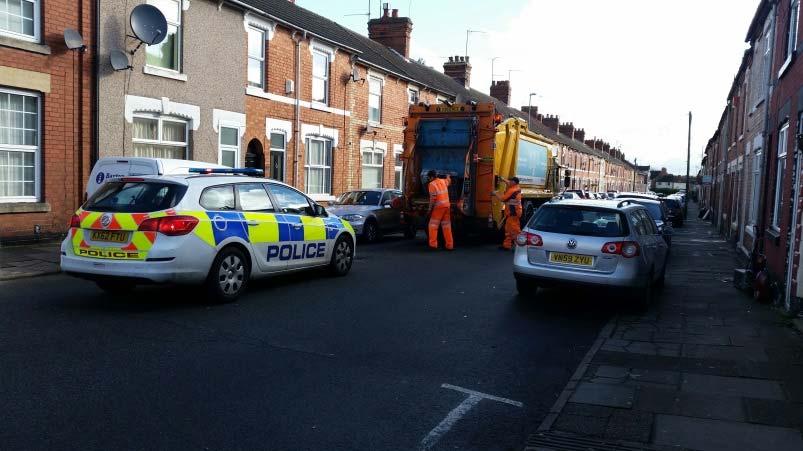
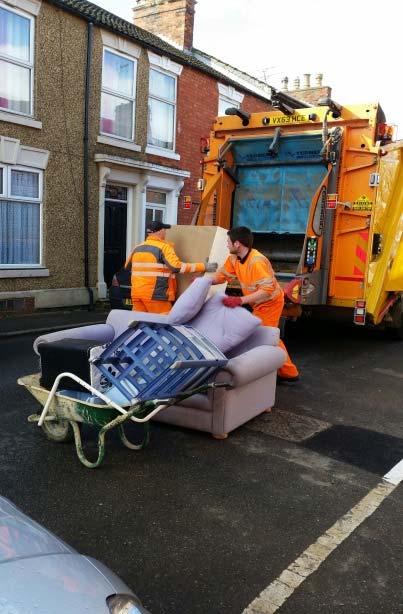
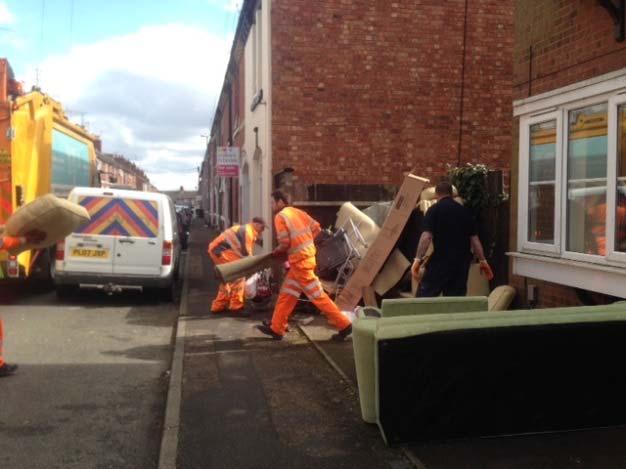
20 Waste Amnesty Project Elizabeth


21 Community Pride Before After
22 Contamination Constant Monitoring and Reviewing Quality we can all have it Monitor Educate Review your schemes Review your contracts! Run regular waste composition analysis Comes at a price but worth it. Do you know your real rejection/contamination rate? What are you doing about it? Demographics! Social Issues etc.


23 Quantity V Quality
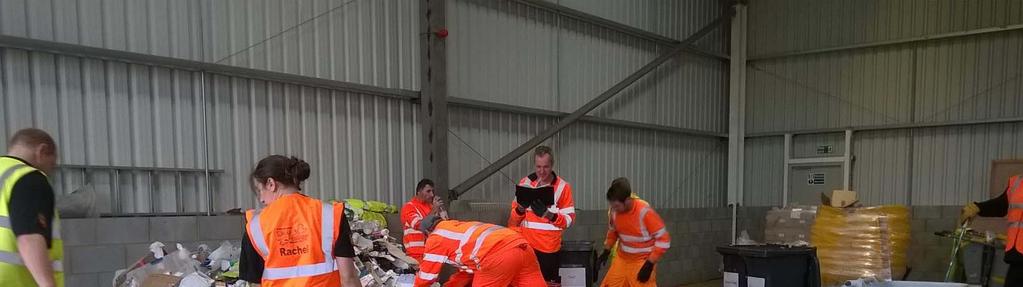
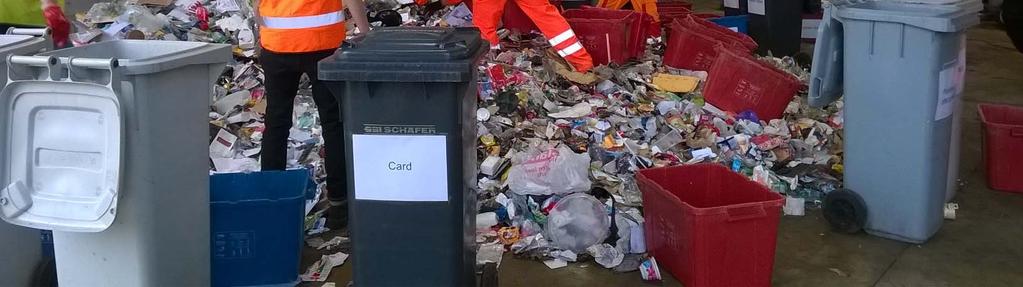
24 DIY Waste Composition
25 Importance of Performance Data APSE Data needs to be accurate Data verification factual not thin air Compare with others Benchmarking Monitor what we do and how well we do or not do it Sharing Expertise and Experiences priceless Ability to learn from others Best Practices Use case studies to improve your service Not afraid to re-think and change what we do or how we do it Benefits improve the service and residents overall perception Improvements don t always cost the earth


26 Your Performance at a Glance Dashboard Reports

27 Dashboard Reports
28 Transport Costs PI 10b - KBC 30% 25% 20% 15% 10% 5% 0% Average for all authorities
29 PI 20a - KBC 8% Staff Absence 7% 6% 5% 4% 3% 2% 1% 0% Average for all authorities
30 Staff Absence group comparison
31 Analysis and Review What is the Data Showing Overview Sickness in relation to missed bins Authorities with High Sickness are reporting more missed bins Why? Staff are not familiar of the collection rounds? Agency staff do they come and go - who may not care? High Sickness this a result of low moral? Authorities supplying data comparison top and bottom low sickness/less missed bins, high sickness/high number of missed bins
32 Missed bins / Sickness Comparison
33 Analysing Data Analyse the data What is the data showing Track your performance Use it, don t just file it Improvements/changes-improve on what you do Confidence in your data will make you push your boundaries Consistency and benchmarking are fundamental to success in this service area. If you know you are sure! Use to promote and celebrate
34 The Big Debate Green Waste To Charge or Not to Charge? Extremely Political Could be interpreted as further tax on residents Budget Control requirement to keep service costs under control Selective service within some authorities e.g. Inner City/Rural Recycling Credits? Revenue or Expenditure?

35 Thank You Questions Picture of waste ted and team Contact Dela Moreland Waste Collection and Recycling Manager delyenemoreland@kettering.gov.uk