Human Resources, Job Design, and Work Measurement
|
|
|
- Meghan Todd
- 5 years ago
- Views:
Transcription


1 Human Resources, Job Design, and Work Measurement
2 Outline Global Company Profile: Rusty Wallace's NASCAR Racing Team Human Resource Strategy for Competitive Advantage Labor Planning Job Design Ergonomics and the Work Environment 2
3 Outline - Continued Methods Analysis The Visual Workplace Labor Standards Ethics 3
4 High-Performance Pit Crew Teamwork Makes the Difference between Winning and Losing New century brought new popularity to NASCAR with increased sponsorship and prize money High performance pit crews are a key element of a successful race team 4
5 Rusty Wallace's NASCAR Racing Team Pit crew members can earn $100,000 per year for changing tires! Each position has very specific labor standards Pit crews are highly organized and go through rigorous physical training Pit stops are videotaped to look for improvements 5


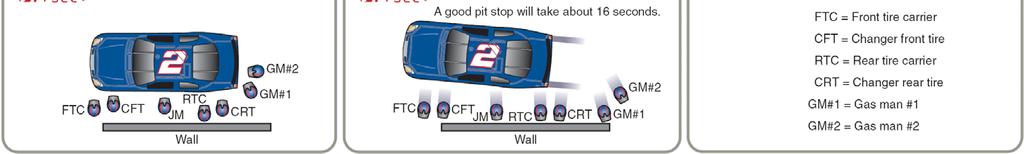
6 Rusty Wallace's NASCAR Racing Team 6
7 Learning Objectives When you complete this chapter you should be able to: 10.1 Describe labor-planning policies 10.2 Identify the major issues in job design 10.3 Identify major ergonomic and work environment issues 10.4 Use the tools of methods analysis 7
8 Learning Objectives When you complete this chapter you should be able to: 10.5 Identify four ways of establishing labor standards 10.6 Compute the normal and standard times in a time study 10.7 Find the proper sample size for a time study 8
9 Human Resource Strategy The objective of a human resource strategy is to manage labor and design jobs so people are effectively and efficiently utilized 9
10 Human Resource Strategy Ensure that people: 1. Are efficiently utilized within the constraints of other operations management decisions 2. Have a reasonable quality of work life in an atmosphere of mutual commitment and trust 10
11 Constraints on Human Resource Strategy Product strategy Skills needed Talents needed Materials used Safety Process strategy Technology Machinery and equipment used Safety Schedules Time of day Time of year (seasonal) Stability of schedules When HUMAN RESOURCE STRATEGY Who Individual differences Strength and fatigue Information processing and response Location strategy Climate Temperature Noise Light Air quality Figure 10.1 Layout strategy Fixed position Process Assembly line Work cell Product 11
12 Labor Planning Employment-Stability Policies 1. Follow demand exactly Matches direct labor costs to production Incurs costs in hiring and termination, unemployment insurance, and premium wages Labor is treated as a variable cost 12
13 Labor Planning Employment-Stability Policies 2. Hold employment constant Maintains trained workforce Minimizes hiring, layoff, and unemployment costs Employees may be underutilized during slack periods or overworked during busy periods Labor is treated as a fixed cost 13
14 Work Schedules Standard work schedule Five eight-hour days Flextime Allows employees, within limits, to determine their own schedules Flexible work week/compressed workweek Fewer but longer days Part-time status Fewer, possibly irregular, hours 14
15 Job Classification and Work Rules Specify who can do what Specify when they can do it Specify under what conditions they can do it Often result of union contracts Restricts flexibility in assignments and consequently efficiency of production 15
16 Job Design Specifying the tasks that constitute a job for an individual or a group 1. Job specialization 2. Job expansion 3. Psychological components 4. Self-directed teams 5. Motivation and incentive systems 16
17 Labor Specialization The division of labor into unique tasks First suggested by Adam Smith in Development of dexterity ( 純熟 ) 2. Less loss of time 3. Development of specialized tools Later Charles Babbage (1832) added another consideration 4. Paying exactly the wage needed for the particular skill required 17
18 Job Expansion Adding more variety to jobs Intended to reduce boredom associated with labor specialization Job enlargement Job rotation Job enrichment Employee empowerment 18
19 Job Enlargement Enriched job Planning (Participate in a crossfunction quality improvement team) Figure 10.2 Task #3 (Lock printed circuit board into fixture for next operation) Present job (Manually insert and solder six resistors) Enlarged job Task #2 (Adhere labels to printed circuit board) Control (Test circuits after assembly) 19
20 Psychological Components of Job Design Human resource strategy requires consideration of the psychological components of job design 20
21 Hawthorne Studies They studied light levels, but discovered productivity improvement was independent from lighting levels Introduced psychology into the workplace The workplace social system and distinct roles played by individuals may be more important than physical factors Individual differences may be dominant in job expectation and contribution 21
22 Core Job Characteristics Jobs should include the following characteristics 1. Skill variety 2. Job identity 3. Job significance 4. Autonomy 5. Feedback 22
23 Self-Directed Teams Group of empowered individuals working together to reach a common goal May be organized for long-term or short-term objectives Effective because Provide employee empowerment Ensure core job characteristics Meet individual psychological needs 23
24 Self-Directed Teams To maximize effectiveness, managers should Ensure those who have legitimate contributions are on the team Provide management support Ensure the necessary training Endorse clear objectives and goals Employ financial and non-financial rewards Reduce supervisory control 24
25 Job Design Continuum Figure 10.3 Self-directed teams Enlargement Enrichment Empowerment Self-direction Specialization Job expansion 25
26 Benefits of Teams and Expanded Job Designs Improved quality of work life Improved job satisfaction Increased motivation Allows employees to accept more responsibility Improved productivity and quality Reduced turnover and absenteeism 26
27 Limitations of Job Expansion Higher capital cost Individual differences Higher wage rates Smaller labor pool Higher training costs 27
28 Limitations of Job Expansion Higher capital cost Individual differences Higher wage rates Smaller labor pool Higher training costs 28
29 Motivation and Incentive Systems Bonuses cash or stock options Profit-sharing profits for distribution to employees Gain sharing rewards for improvements Incentive systems typically based on production rates Knowledge-based systems reward for knowledge or skills 29

30 Ergonomics and the Work Environment Ergonomics is the study of the human interface with the environment and machines Often called human factors Operator input to machines needs to be carefully evaluated 30

31 Ergonomics and Work Methods Feedback to operators The work environment Illumination Noise Temperature Humidity 31

32 Recommended Levels of Illumination Figure 10.4a 32
33 Levels of Illumination TASK CONDITION TYPE OF TASK OR AREA ILLUMINATION LEVEL TYPE OF ILLUMINATION Small detail, extreme accuracy Normal detail, prolonged periods Good contrast, fairly large objects Sewing, inspecting dark materials Reading, parts assembly, general office work Recreational facilities 100 Overhead ceiling lights and desk lamp Overhead ceiling lights 5-10 Overhead ceiling lights Large objects Restaurants, stairways, warehouses 2-5 Overhead ceiling lights 33

34 Decibel Levels Table 10.4b 34
35 Methods Analysis Focuses on how task is performed Used to analyze 1. Movement of individuals or material Flow diagrams and process charts 2. Activities of human and machine and crew activity Activity charts 3. Body movement Operations charts 35
36 Flow Diagram From press mach. Machine 1 Storage bins Mach. 3 Mach. 4 Welding Paint shop Mach. 2 Figure 10.5 (a) 36
37 Flow Diagram Machine 4 Welding Machine 3 From press mach. Machine 2 Machine 1 Storage bins Paint shop Figure 10.5 (b) 37

38 Process Chart Figure 10.5 (c) 38

39 Activity Chart Figure

40 Operations Chart Figure
41 The Visual Workplace Use low-cost visual devices to share information quickly and accurately Displays and graphs replace printouts and paperwork Able to provide timely information in a dynamic environment System should focus on improvement 41
42 The Visual Workplace Visual signals can take many forms and serve many functions Present the big picture Performance Housekeeping 42


43 The Visual Workplace Visual utensil holder encourages housekeeping A "3-minute service" clock reminds employees of the goal Figure


44 The Visual Workplace Visual signals at the machine notify support personnel Line/machine stoppage Visual kanbans reduce inventory and foster JIT Reorder point Parts/ maintenance needed All systems go Andon Part A Part B Part C Figure


45 The Visual Workplace Quantities in bins indicate ongoing daily requirements, and clipboards provide information on schedule changes Company data, process specifications, and operating procedures are posted in each work area Figure
46 Labor Standards Effective manpower planning is dependent on a knowledge of the labor required Labor standards are the amount of time required to perform a job or part of a job Accurate labor standards help determine labor requirements, costs, and fair work 46
47 Labor Standards Started early in the 20th century Important to both manufacturing and service organizations Necessary for determining staffing requirements Important to labor incentive systems 47
48 Meaningful Standards Help Determine 1. Labor content of items produced 2. Staffing needs 3. Cost and time estimates 4. Crew size and work balance 5. Expected production 6. Basis of wage-incentive plans 7. Efficiency of employees 48
49 Labor Standards May be set in four ways: 1. Historical experience 2. Time studies 3. Predetermined time standards 4. Work sampling 49
50 Historical Experience How the task was performed last time Easy and inexpensive Data available from production records or time cards Data is not objective and may be inaccurate Not recommended 50
51 Time Studies Involves timing a sample of a worker's performance and using it to set a standard Requires trained and experienced observers Cannot be set before the work is performed 51
52 Time Studies 1. Define the task to be studied 2. Divide the task into precise elements 3. Decide how many times to measure the task 4. Time and record element times and rating of performance 52
53 Time Studies 5. Compute average observed time Average observed time = Sum of the times recorded to perform each element Number of observations 6. Determine performance rating and normal time Average Normal time = observed x time Performance rating factor 53
54 Time Studies 7. Add the normal times for each element to develop the total normal time for the task 8. Compute the standard time Standard time = Total normal time 1 - Allowance factor 54
55 Rest Allowances Personal time allowances 4% 7% of total time for use of restroom, water fountain, etc. Delay allowance Based upon actual delays that occur Fatigue allowance Based on our knowledge of human energy expenditure 55
56 Rest Allowances TABLE 10.1 Allowance Factors (in percentage) for Various Classes of Work 1. Constant allowances: (A) Personal allowance.. 5 (B) Basic fatigue allowance Variable allowances: (A) Standing allowance.. 2 (B) Abnormal position (i) Awkward (bending). 2 (ii) Very awkward (lying, stretching)
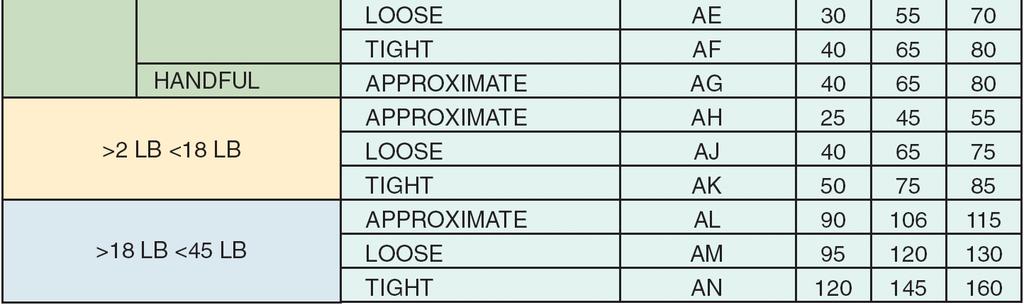
57 Rest Allowances Allowance Factors (in percentage) for TABLE 10.1 Various Classes of Work (C) Use of force or muscular energy in lifting, pulling, pushing Weight lifted (pounds)
58 Rest Allowances TABLE 10.1 Allowance Factors (in percentage) for Various Classes of Work (D) Bad light: (i) Well below recommended 2 (ii) Quite inadequate 5 (E) Noise level: (i) Intermittent loud... 2 (ii) Intermittent very loud or high pitched
59 Time Study Example 1 Average observed time = 4.0 minutes Worker rating = 85% Allowance factor = 13% Normal time = (Average observed time) x (Rating factor) = (4.0)(.85) = 3.4 minutes Normal time 3.4 Standard time = = = 1 Allowance factor = 3.9 minutes 59
60 Time Study Example 2 Allowance factor = 15% OBSERVATIONS (MIN) JOB ELEMENT PERFORMANCE RATING (A) Compose and type letter * % (B) Type envelope address % (C) Stuff, stamp, seal, and sort envelopes 2 1 5* % 1. Delete unusual or nonrecurring observations (marked with *) 2. Compute average time for each element Average time for A = ( )/4 = 9.5 minutes Average time for B = ( )/5 = 2.2 minutes Average time for C = ( )/4 = 1.5 minutes 60
61 Time Study Example 2 3. Compute the normal time for each element Normal time = (Average observed time) x (Rating) Normal time for A = (9.5)(1.2) = 11.4 minutes Normal time for B = (2.2)(1.05) = 2.31 minutes Normal time for C = (1.5)(1.10) = 1.65 minutes 4. Add the normal times to find the total normal time Total normal time = = minutes 61
62 Time Study Example 2 5. Compute the standard time for the job Standard time = Total normal time 1 Allowance factor = = minutes
63 Determine Sample Size 1. How accurate we want to be 2. The desired level of confidence 3. How much variation exists within the job elements 63
64 Determine Sample Size Required sample size = n = zs hx 2 where h = accuracy level (acceptable error) desired in percent of the job element expressed as a decimal z = number of standard deviations required for the desired level of confidence s = standard deviation of the initial sample x = mean of the initial sample n = required sample size 64
65 Determine Sample Size Required sample size = TABLE 10.2 Common z-values z-value (STANDARD DEVIATION REQUIRED where h = accuracy level (acceptable DESIRED error) desired in FOR percent DESIRED of the job element expressed CONFIDENCE as a decimal LEVEL OF z = number of standard deviations (%) required for CONFIDENCE) the desired level of confidence s = standard deviation of the initial sample x = mean of the initial sample n = required sample size
66 Time Study Example 3 Desired accuracy with 5% Confidence level = 95% Sample standard deviation = 1.0 Sample mean = 3.00 h =.05 x = 3.00 s = 1.0 z = 1.96 (from Table S10.2 or Appendix I) n = zs hx 2 n =
67 Time Study Example 3 Variations If desired accuracy h is expressed as an absolute amount, substitute e for hx, where e is the absolute amount of acceptable error n zs e 2 67
68 Time Study Example 3 Variations When the standard deviation s is not provided, it must be computed s x i x 2 n 1 Each sample observation x 2 Number in sample 1 where x i = value of each observation x = mean of the observations n = number of observations in the sample 68
69 Predetermined Time Standards Divide manual work into small basic elements that have established times Can be done in a laboratory away from the actual production operation Can be set before the work is actually performed No performance ratings are necessary 69

70 MTM Table Figure
71 MTM Example Weight less than 2 pounds Conditions of GET easy Place accuracy approximate Distance range 8 to 20 inches TABLE 10.3 MTM-HC Analysis: Pouring Tube Specimen ELEMENT DESCRIPTION ELEMENT TIME Get tube from rack AA2 35 Uncap, place on counter AA2 35 Get centrifuge tube, place at sample table AD2 45 Pour (3 seconds) PT 83 Place tubes in rack (simo) PC2 40 Total TMU x 238 = Total standard minutes =.14 or about 8.6 seconds 71
72 Work Sampling Estimates percent of time a worker spends on various tasks Requires random observations to record worker activity Determines how employees allocate their time Can be used to set staffing levels, reassign duties, estimate costs, and set delay allowances 72
73 Work Sampling 1. Take a preliminary sample to obtain estimates of parameter values 2. Compute the sample size required 3. Prepare a schedule for random observations at appropriate times 4. Observe and record worker activities 5. Determine how workers spend their time 73
74 Work Sampling Determining the sample size n z2 p 1 p h 2 where n = required sample size z = standard normal deviate for desired confidence level p = estimated value of sample proportion h = acceptable error level in percent (as a decimal) 74
75 Work Sampling Example Estimates employees idle 25% of the time Sample should be accurate within ± 3% Wants to have 95.45% confidence in the results n z2 p 1 p h 2 where n = required sample size z = 2 for a 95.45% confidence level p = estimate of idle proportion = 25% =.25 h = acceptable error of 3% =.03 n (2)2 (.25)(.75) (.03) observations 75
76 Work Sampling Example NO. OF OBSERVATIONS ACTIVITY 485 On the phone or meeting with a welfare client 126 Idle 62 Personal time 23 Discussions with supervisor 137 Filing, meeting, and computer data entry 833 All but idle and personal time are work related Percentage idle time = ( )/833 = 22.6% Since this is less than the target value of 25%, the workload needs to be adjusted 76


77 Work Sampling Time Studies Salespeople Telephone sales 12% Telephone within firm 13% Sales in person 20% Travel 20% Paperwork 17% Lunch and personal 10% Meetings and other 8% Figure


78 Work Sampling Time Studies Assembly-Line Employees Startup/exercise 3% Breaks and lunch 10% Productive work 67% Dead time between tasks 13% Unscheduled tasks and downtime 4% Cleanup 3% Figure
79 Work Sampling Advantages of work sampling Less expensive than time study Observers need little training Studies can be delayed or interrupted with little impact on results Worker has little chance to affect results Less intrusive 79
80 Work Sampling Disadvantages of work sampling Does not divide work elements as completely as time study Can yield biased results if observer does not follow random pattern Less accurate, especially when job element times are short 80
81 Ethics Fairness, equity, and ethics are important constraints of job design Important issues may relate to equal opportunity, equal pay for equal work, and safe working conditions Helpful to work with government agencies, trade unions, insurers, and employees 81