How to Change the Culture of an Organization. Debbie Ritchie COO
|
|
|
- Beatrice Claribel Wilcox
- 5 years ago
- Views:
Transcription
1 How to Change the Culture of an Organization Debbie Ritchie COO
2 About Studer Group Our mission is to make healthcare a better place for employees to work, physicians to practice medicine and patients to receive care 150 employees, including 50 coaches with health care operating backgrounds (6,000 days/year = 16 learning years) More than 800 partners, including: 20 on Modern Healthcare s 100 Best Places to Work in Healthcare 43 Magnet-designated facilities Coached 6 of the 12 healthcare recipients of the Malcolm Baldrige National Quality Award We build and sustain a foundation of alignment, accountability systems, and development of leaders so that optionality is reduced and results are hardwired across the organization
3 We Practice What We Teach 2010 recipient of the Malcolm Baldrige National Quality Award 99 th percentile employee engagement for eight straight years One of the best small companies to work for in America for four straight years Vision: to maximize the human potential within healthcare


4 Why We Are Engaged SERVICE QUALITY PEOPLE FINANCE GROWTH COMMUNITY
5 Evidence-Based Tactics Employees Physicians Patients Standards Peer Interviewing 30- and 90-Day Meetings Post-Hire Rounding for Outcomes Thank You Notes Employee Attitude Survey Employee Forums Bright Ideas Support Card Physician Leader Evaluation Got Chart? Physician Preference Card Physician Code Patient Agenda and Visit Guide Physician Note Pads Rounding for Outcomes AIDET SM Pre-Visit Calls Leader Rounding on Patients Hourly Rounding Individualized Patient Care Bedside Shift Report AIDET SM Post-Visit Calls
6 Healthcare Flywheel Prescriptive To Do s Purpose, worthwhile work and making a difference Bottom Line Results (Transparency and Accountability) WHY Self- Motivation

7

8
9 Now, let s... Define culture The expressed values & observed behaviors... What happens when no one s watching Give you the magic bullet

10 Patient and Employee Correlations 2008 Hospital Pulse Report, Press Ganey Associates, Inc.
11 Patients Perception of Care = Quality Vascular Catheter-Association Infection Hospitals Rate per 1000 of VASCULAR CATHETER- ASSOCIATED INFECTION by their Percentile Ranking for Responsiveness th Percentile in "Patient Always Received Help When They Wanted" 25-49th Percentile in "Patient Always Received Help When They Wanted" 50-74th Percentile in "Patient Always Received Help When They Wanted" 75-99th Percentile in "Patient Always Received Help When They Wanted"
12 Patients Perception of Care = Quality Manifestations of Poor Glycemic Control Hospitals Rate per 1000 of MANIFESTATIONS OF POOR GLYCEMIC CONTROL by their Percentile Ranking for Responsiveness th Percentile in "Patient Always Received Help When They Wanted" 25-49th Percentile in "Patient Always Received Help When They Wanted" 50-74th Percentile in "Patient Always Received Help When They Wanted" 75-99th Percentile in "Patient Always Received Help When They Wanted"

13 Patients Perception of Care = Quality Pressure Ulcer Stages III and IV Hospitals Rate per 1000 of PRESSURE ULCER STAGES III AND IV by their Percentile Ranking on Responsiveness th Percentile in "Patient Always Received Help When They Wanted" 25-49th Percentile in "Patient Always Received Help When They Wanted" 50-74th Percentile in "Patient Always Received Help When They Wanted" 75-99th Percentile in "Patient Always Received Help When They Wanted"

14 Vision without execution is hallucination. Thomas Edison
15 Most Change Efforts Fail Total Quality Management programs: About two-thirds grind to a halt because of their failure to produce the hoped-for results Reengineering 70% failure rate Kotter, John P Leading Change: Why Transformation Efforts Fail. Harvard Business Review. 73(2):
16 Kotter s 8 Steps for Effective Change 1. Establishing a Sense of Urgency 2. Creating a Guiding Coalition 3. Developing a Vision & Strategy 4. Communicating the Change Vision 5. Empowering Broad-based Action 6. Generating Short-term Wins 7. Consolidating Gains & Producing more Change 8. Anchoring New Approaches in Culture Kotter, John P Leading Change: Why Transformation Efforts Fail. Harvard Business Review. 73(2):
17 1. Establish a sense of urgency Change typically begins with someone noticing a vulnerability in the organization. They kick into action. They try to communicate that sense of urgency to others. Over half the companies observed have never been able to create enough urgency to prompt action. Tips: Leadership group to facilitate a frank discussion of potentially unpleasant facts: about the new competition, flat earnings, decreasing market share, or other relevant indicators. Substitute one fear for another. Make the anxiety of not changing greater than the anxiety of changing. Kotter, John P Leading Change: Why Transformation Efforts Fail. Harvard Business Review. 73(2):

18 Alignment Straight A Leadership ALIGNMENT ACTION ACCOUNTABILITY When healthcare leaders are asked to rank what the external market will be like over the next 5 years, senior leaders rank difficult/very difficult while frontline leaders rank it normal/difficult. Role Very Easy 1 Easy 2 Normal 3 Difficult 4 Very Difficult 5 Senior Leaders Frontline Leaders * Calculation: 1=0, 2=25, 3=50, 4=75, 5=100
, they will be the same, better or much better.")
19 Alignment Straight A Leadership ALIGNMENT ACTION ACCOUNTABILITY 37% feel if an organization stays the same (same processes, cost structure, efficiencies, patient care volume, productivity, techniques, etc.), they will be the same, better or much better. Much Worse 1 Worse 2 Same 3 Better 4 Much Better 5 = 37% * Calculation: 1=0, 2=25, 3=50, 4=75, 5=100

20 People wish to be settled; but only as far as they are unsettled, is there any hope for them. Ralph Waldo Emerson
21 If the other guy s getting better, then you d better be getting better faster than that other guy s getting better... or you re getting worse. Tom Peters - The Circle of Innovation
22 Why Organizational Change Fails 1. Dots are not connected consistently to purpose, worthwhile work and making a difference 2. Do not achieve critical mass - Lack of balanced approach 3. Absence of an objective accountability system 4. Leaders do not have the training to be successful 5. Too many new behaviors introduced at once need of sequenced approach 6. No process in place to re-recruit the high and middle performers and address low performers 7. Inability to take best practices and standardize across organization 8. Failure to have leaders always do desired behaviors Source: Studer Group. Organizational Change Processes In High Performing Organizations: In-Depth Case Studies with Health Care Facilities. Alliance for Healthcare Research

23 Studer Group Partners Outpace the Nation in HCAHPS Improvements Responsiveness of Staff Willingness to Recommend Communication of Medications Nursing Communication Room and Bathroom Cleanliness Discharge Information Doctor Communication Average Change in Top Box Results in One Year Studer Group Partners vs. Non Partner Overall Rating Quiet at night Pain Avg Change One Year 3Q08-2Q09 to 3Q09-2Q10 - SG Partners 2.18 Source: The graph compares the change In one year in top box results achieved by Studer Group partners vs. non-partners. Change is from 4Q08-3Q09 to 4Q09-3Q10. The top-box is the most positive response to HCAHPS survey questions.


24 Studer Group Partners Outperform the Nation across HCAHPS Composites Studer Group Difference over Non-Partners in National Percentile Ranking Overall Rating 25 Willingness to Recommend 22 Pain Management 21 Nursing Communication Communication of Medications Discharge Information percentile points higher Quiet at night 11 Responsiveness of Staff 10 Doctor Communication 9 Room and Bathroom Cleanliness Studer Group Difference over Non-Partners in National Percentile Ranking Source: The graph above shows a comparison of the average percentile rank for Studer Group Partners that have received EBL coaching since Oct 2008 and non-partners for each composite; updated using 4Q09-3Q10 CMS data.

25 Three Elements to Execution

26 Aligned Goals Objective Evaluation System Objective Evaluation System Leader Development Must Haves Performance Gap Standardization Accelerators Aligned Goals Aligned Behavior Aligned Process

27 Example Organizational Results Using typical Leader Evaluation

28 Example Distribution of Performance Using typical Leader Evaluation
29 Same Organization s Results After implementing Leader Evaluation Manager TM Excellence Service People Quality Finance Growth Increase Patient Satisfaction (Inpatient) Goal = 62 nd Current = 51 st Reduce Annualized Turnover Goal = 14.5% Current = 16.7% Decrease Mortality Index Goal =.77 Current =.77 Operating Margin Goal = 5% Current = 5.6% Increase Inpatient Admissions Goal = 2.7% Current = 7.6% Increase Patient Satisfaction (Ambulatory) Increase Employee Satisfaction Reduce FTE per Adjusted Discharge Increase Outpatient Visits Goal = 62 nd Current = 65th Goal = 1.15 Current = 1.15 Goal = 5% Current = 8.0%
30 Distribution of Performance After implementing Leader Evaluation Manager TM Note: Percentages noted account for 93% of the leaders who have entered data as of
31 Leader Evaluation Key Factors Evaluation criteria: Objective Measurable Weighted by Pillar Contain metric ranges
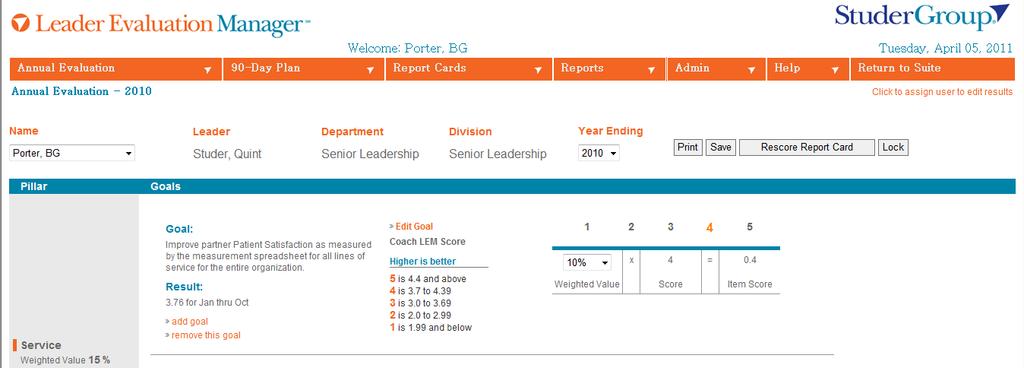
32 Annual Evaluation Annual Evaluation
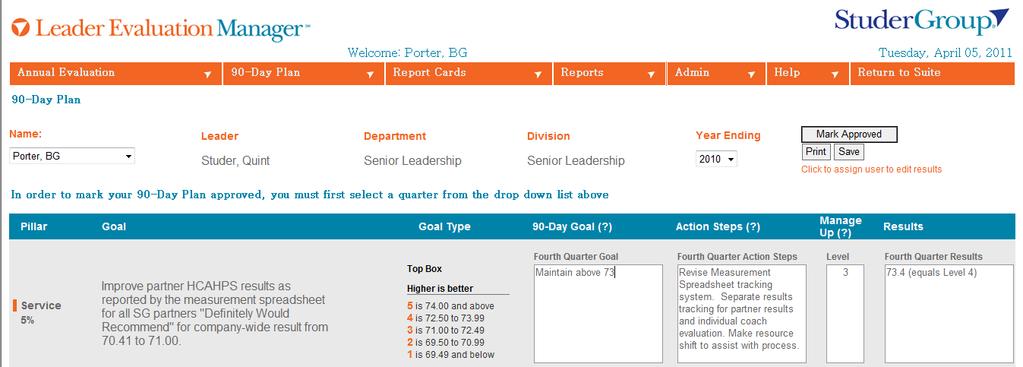
33 90-Day Plan 90-Day Plan


34 Monthly Report Card Monthly Report Card
35 Example Hospital Goal = 90% Inpatient Monthly Percentile Score August 15, % 90% 80% 70% 60% 50% 40% 30% 20% 10% 0% February 01 April 01 June 01 August 01 October 01 December 01 February 02 April 02 June 02 August 02 October 02 December 02 February 03 April 03 Leader Eval Tool Implemented June 03 August 03 October 03 December 03 February 04 April 04 June 04 August 04 October 04 December 04 February 05 April 05 95% June 05 August 05
36 Example Hospital Inpatient Monthly Percentile Score June 25, 2007 Goal = 90% 100% 99% 90% 80% 70% 60% 50% 40% 30% 20% 10% 0% Leader Eval Tool Implemented January 05 February 05 March 05 April 05 May 05 June 05 July 05 August 05 September 05 October 05 November 05 December 05 January 06 February 06 March 06 April 06 May 06 June 06 July 06 August 06 Sept 06 Oct 06 Nov 06 Dec 06 Jan 07 Feb 07 March 07 April 07 May 07 June 07

37 Aligned Goals Leader Development Objective Evaluation System Leader Development Must Haves Performance Gap Standardization Accelerators Aligned Goals Aligned Behavior Aligned Process

38 Aligned Behaviors Must Haves Objective Evaluation System Leader Development Must Haves Performance Gap Standardization Accelerators Aligned Goals Aligned Behavior Aligned Process

39 Studer Group Selecting & Retaining Talent System

40 Accountability Straight A Leadership ALIGNMENT ACTION ACCOUNTABILITY On average within a given healthcare organization, 8% of employees are not meeting performance expectations, and of this group, 50% do not have documentation that they are underperforming.
41 Over the Wall H H M The Wall H M H M L M Gap is uncomfortable L Gap is intolerable L

42 Everyone thinks of changing the world, but no one thinks of changing himself. Leo Tolstoy


43 Lessons Learned Sustaining high performance requires hardwiring the practices that have been proven to work Keys to performance are alignment, accountability and transparency Strategy Results Structure Execution
44 What you can do Monday... Connect to Why Create excellence within your sphere of influence Share your successes relentlessly Say thank you

45 Thank You! Debbie Ritchie COO