Job Protection s sectoral and local adjustments instrument in view to accelerating eco-innovation implementation
|
|
|
- Myrtle Stafford
- 5 years ago
- Views:
Transcription

 Social risk and vulnerabilities, Tuesday 12 september, 2017, room")
1 Job Protection s sectoral and local adjustments instrument in view to accelerating eco-innovation implementation Cristina Lincaru, Vasilica Ciucă, Speranta Pîrciog, Draga Atanasiu (INCSMPS - National Scientific Research Institute for Labor and Social Protection, Romania) Social risk and vulnerabilities, Tuesday 12 september, 2017, room 211,
2 production is heterogeneously distributed in space learning become work EPL -assuring an efficient and effective allocation and reallocation of labour force across sectors and occupations (space) Eco-Innovation performance and its need to green competence agglomeration tendency of high skilled workers at NACE Rev.2 at 2 digits at NUTS 5 level The rethinking of EPL is imperious to adjust the workforce to changing demand conditions and technology
3 Krugman, Venables and Fujita (1999) in New Economy of Geography - the production is heterogeneously distributed in space, reflecting the tendency of agglomeration in highly populated locations. In the EU ( smart, sustainable and inclusive growth EU 2020) and OECD s policy of the Green Growth framework Eco- Innovation and Entrepreneurship, launched structural changes testified by the emergence of the new economic sectors like Circular Economy, Bio economy, Blue Growth, Cleantech and Renewable Energy, Green Cities and Municipalities Mikkola et. al. (2016), sectors that also creates new jobs in these fields driven by Eco-innovation (Rennings, 1998 and 2000). Ecoinnovation opens new opportunities, mixing creation and destruction processes. (OECD, 2011; OECD, 2012).
4 the high skilled agglomeration - differences in development Morretti (2012) and Dijkstra et. al (2015) -IV th Industrial Wave (WEF b, 2016). significant change is made in the work content expressed by new skills demand (WEF, 2016) - new forms of employment standard definitions. (OECD, 2017, p.18) ILO make large debates and finds that the content of work is changing: learning is work (ILO, 2013a, and ICLS-Resolution-I, 2013). increasing underutilization of labour (WEF, 2016)/ ageing population + deficit of specialised skills - risks of exclusion from technology + the risks of low pay, precariousness and poor working conditions. (OECD, 2017, p.3)
5 Employment Protection Legislation EPL consists of rules and procedures related to the faculty of companies to dismiss workers. It deals with the lawfulness of probationary periods, mandated notice periods and severance payments (payments to workers for early contract termination), procedural requirements to be followed in the case of individual dismissals or collective redundancies, sanctions for unfair dismissal, and conditions for using temporary or fixed-term contracts. (European Commission, 2016a)
6 EPL as a labour market institution (next to minimum wages, health and safety regulation) has a major role in exploiting the opportunities offered by technological change and globalisation. The legal framework has to adjust the workforce to changing demand conditions and technology (OECD, 2017, p.18), assuring an efficient and effective allocation and reallocation of labour force across sectors and occupations
7 The increase in productivity and growth requests an appropriate worker-firm matching, where the firm is defined by its technology wave (WEF, 2016). On the background of the 2008 crises at EU level the EPL (working time, wage setting) adjustments became more frequent, while reforms reducing the labour taxation or raising entitlements became less frequent in light of tightening budget constraints. Turrini et. al. (2015, p.27)
8 Romania a high flexibilization of labour market coupled with labour protection decreasing LABREF for Romania during period the tendency of increasing the procedural requirements with 5 measure that increase EPL and other 7 that decrease it, covering 6 policies fields from the 9 of EPL [First policy field is the Procedural requirements - EPL1with 5 measures: -2 to decrease EPL and 3 to increase EPL), Collective dismissals - EPL10 with 4 measures (-1; 3) and Temporary contracts - EPL9 with 3 measures (-1;2). 3 policy field with lower importance for Romania reflected by 2 measures in average (-1:1): Maximum duration of fixed-term contracts -EPL6, Temporary agency work -EPL7 and Definition of valid reasons for fixed-term contracts -EPL8 (-1; 1)]
9 Protection / innovation growth & productivity? EPL procedure destinated to skills adjustment to the need for the technological demands of the employer s firm need.
10 Romania is still a modest innovator, with an economy driven by transition efficiency towards the stage of innovation-led development (Global Competitiveness Index of the WEF World occupies 53/140, with a score of 4.32 / 7 for 2015, comparable to the 2014 level). * the effectiveness of innovation policies for development is still below potential! Romania ranks 18th in the 2014 Eco-Innovation Scoreboard of the EU 28 (Roman, 2015), (Dutta et al., 2015), with low productivity
11 In view to identifying the need for labour allocation, reallocation among occupations and sectors of economic activity we shall calculate for Romania the gap in eco-innovation and in labour productivity with the best performers (in terms of Eco-innovation), looking also at the labour productivity. Both dimensions of productivity reflect indirectly a capital, skill and technology input, assuring a production (GAV expressed in gross value added) and Green Gases Emissions.
12 The Intensity of Greenhouse Gases (IGG) indicator measures the relationship between the environment and economy by comparing two indicators. IGG is a measure of Carbon productivity while it will decrease enough so that the facility s total GHG emissions will also decrease even with increases in production. The processes of improving energy efficiency, conservation and the use of lower-carbon energy sources is a knowledge intensive one and for us is a measure of Eco-innovation
13 Where W s =Y s /L s, labour productivity (1) A measure for the Eco-Innovation productivity gap of Romania to the best performers in terms of Eco-Innovation UK (second rank in the Eco-Innovation Scoreboard, below Switzerland no full data provided by Eurostat): Ratios of IGG Air emissions accounts by NACE Rev. 2 activity for Greenhouse Gases (CO2, N2O in CO2 equivalent, CH4 in CO2 equivalent) for Romania compared to the UK: rigg_ro s /UK s =IGG_Ro s /IGG_UK s (2) A measure for the Eco-Innovation productivity gap of Romania to the EU28 average: Ratios of IGG Air emissions accounts by NACE Rev. 2 activity for Greenhouse Gases (CO2, N2O in CO2 equivalent, CH4 in CO2 equivalent) for Romania compared to EU28: rigg_ro s /EU28 s =IGG_Ro s /IGG_EU28 s (3) A measure of the labour productivity gap of Romania to the best performers in terms of Eco-Innovation UK: productivity ratios Romania to UK relative (see Figure 2): rw_eu28 s /Ro s = W_EU28 s /W_Ro s (4) A measure of the labour productivity gap of Romania to EU28 average: productivity ratios Romania to UE28 relative (see Figure 2): rw_uk/ro s = W_UK/W_Ro s (5) A quantitative measure of improvement of carbon productivity during t1-t2 period, in the country c, by sector s (see Figure 1) IGGcs t1-t2 =(IGG_cs t2 - IGG_cs t1 )/ IGG_cs t1 *100 (6)
14 Figure 1 - Fewer emissions produced per unit of real GAV (gross added value) indicates a quantitative measure of improvement of carbon productivity. a divergent pattern for carbon productivity in Romania compared to UK and EU28. In Romania for 1/3 from all sectors during is increasing the air emissions intensity compared to UK and Eu28 average that indicates analmost universal tendency ofdecreasing this indicator. The structural economic change is Romania towards the green economy is strongly heterogeneously in both terms sectoral and spatial while in UK and EU 28 average this tendency is homogenous across all sectors;

15
16 The carbon and labour productivity gap presented in Figure 2: The ratio of air emissions intensities by NACE Rev. 2 activity Romania to EU28 and Romania to UK and ratios of (Labour) productivity Romania to EU 28and Romania to the UK in 2014 illustrates a high variability across economic activity sectors: - C21, C17, C20, E36, and H15 present in Romania labour and carbon productivity gaps for 15 times lower than the UK and EU28 levels, and G46 E37-E39 and E sector have this gap greater than 10 times and lower than 15 times; - The labour productivity gap is higher than 2 times lower level in Romania compared to EU28 and UK on the first 57 items of sectors (Figure 2) - The carbon productivity gap is higher than 2 times lower level in lower level in Romania compared to EU28 and UK in 45 items of sectors, respectively in: C R93 N O M69_M70 C22 TOTAL S96 G47 M72 K66 J C23 C24_C25 C22_C23 M73 G G45 E37-E39 S K64 K Q87_Q88 E C18 M73-M75 C26 L J58 G46 N78 M74_M75 K65 B S95 C20 J58-J60 J59_J60 C25 C21 N79 L68A
17
18 81.8% sectors at NACE Rev.2 at 2 digits present high skilled workers with the global tendency of clustering /agglomeration at NUTS 5 level,: 73.9% reject NH strong general clustering tendency for 66 sectors from 88 sectors NACE Rev. 2 considered from micro data INS Census 2011 (Moran s I z value >2, p<0.05 significant). 23 core locations HH and a maximum 132 HH core locations from the total of 3189 locations NUTS5 (Figure2); 8.0% reject NH weak clustering tendency for 66 sectors from 88 sectors NACE Rev. 2 considered from micro data INS Census These sectors are: ; 18.2% sectors at NACE Rev.2 at 2 digits present high skilled workers without the tendency of agglomeration at NUTS 5 level, for this cases we accept NH complete spatial randomness (CSR) - no clustering tendency. These sectors are:
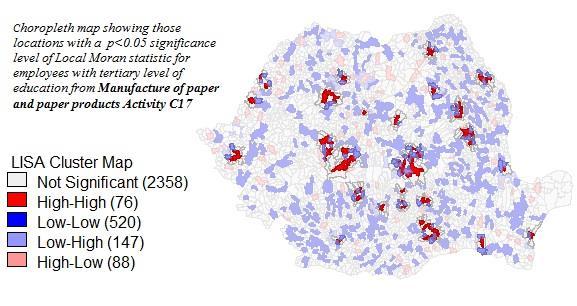
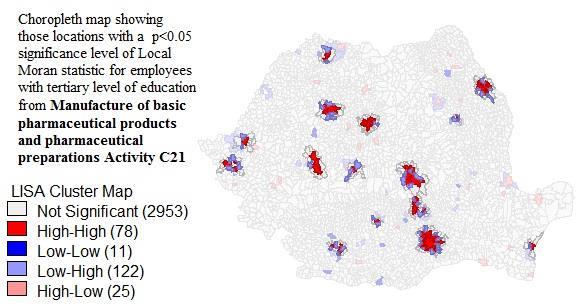
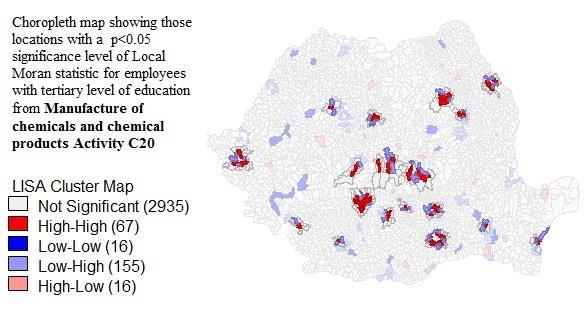
19 Choropleth map showing those locations with p<0.05 significance level of Local Moran statistic for employees with a tertiary level of education from: - Manufacture of basic pharmaceutical products and pharmaceutical preparations Activity C21 (Figure 4), first rank by labour and carbon productivity gap of Romania in a report to UK and EU 28 (Figure 2). In this case there are 12 functional brain hubs" or "innovation clusters covering 78 core locations HH from the total of 3189 locations NUTS5. - Manufacture of paper and paper products Activity C17 (Figure 5), second rank by labour and carbon productivity gap of Romania in report to UK and EU 28 (Figure 2) in this case there is no clustering tendency ; - Manufacture of chemicals and chemical products Activity C20 (Figure 6), third rank by labour and carbon productivity gap of Romania in a report to UK and EU 28 (Figure 2). In this case there are 18 functional brain hubs" or "innovation clusters covering 67 core locations HH from the total of 3189 locations NUTS5.

20
21
22 Job Protection s sectoral and local adjustments instrument in view to accelerating eco-innovation implementation. The rethinking of EPL is imperious required by three main aspects: The expansion of the work content in the ILO s perspective that learning is work; EPL s highly integrator character for many policies, not only the traditional ones of labour market; EPL needs to be seen as a smart mechanism that conducts simultaneous harmonisation of many policies at different levels local and sectorial.
23 Thank you for you attetention! /Va multumim pentru atentie!