Project Quality Management. For the PMP Exam using PMBOK
|
|
|
- Warren Daniel
- 5 years ago
- Views:
Transcription
1 Project Quality Management For the PMP Exam using PMBOK Guide 5 th Edition
2 PMI, PMP, PMBOK Guide are registered trade marks of Project Management Institute, Inc.

3 Contacts Name: Khaled El-Nakib, PMP, PMI-RMP URL:
4 Objectives Introduction to Quality Management Quality Tools Project Quality Management Processes
5 Quality Definition The degree to which a set of inherent characteristics fulfill requirements American Society for Quality
6 Quality Management Compatible with: ISO Deming Approach Grospy Approach Juran Approach Total Quality Management (TQM) Six sigma Cost of Quality (COQ)

7 Deming s P.D.C.A. cycle Plan improvements Implement the plan Take corrective action Verify the results
8 Edwards Deming: (No Cost for Quality) Deming s view is that quality management and improvement are the responsibility of all the firm s employees: Top-management must adopt the new religion of quality, lead and push for improvement and be involved in all stages of the program. Workers should be trained and encouraged to prevent defects and improve quality, and be challenging, rewarding jobs. Quality professionals should educate other managers in statistical techniques and concentrate on improving the methods of defect prevention. Statisticians should consult with all areas of the company.
9 Philip Crosby: (Zero Defects) 1. Management commitment. 2. Quality improvement team. 3. Quality measurement. 4. Cost of quality evaluation. 5. Quality awareness. 6. Corrective action. 7. Establish ad hoc committee for the zero defects program 8. Supervisor training. 9. Zero defects day. 10. Goal-settings. 11. Error cause removal. 12. Recognition. 13. Quality councils. 14. Do it over again.
10 Juran: (cost of quality) 1. Build awareness of the need and opportunity for improvement. 2. Set goals for improvement. 3. Organize to reach the goals. 4. Provide training. 5. Carry out projects to solve problems 6. Report progress. 7. Give recognition. 8. Communicate results. 9. Keep the score. 10. Maintain momentum by making annual improvement part of the regular system and process of the company.

11 Total Quality Management (TQM)
12 Quality Vs. Grade Quality is the degree to which a set of inherent characteristics fulfill requirements Grade is the category assigned to products or services having the same functional use but different technical characteristics. Low quality is always a problem. Low grade may not be.
13 Precision Vs. accuracy Precision is consistency that the value of repeated measurements are clustered and have little scatter. Accuracy is correctness that the measured value is very close to the true value.

14 Precision Vs. accuracy (continued)
15 Modern quality management and project management Both recognize Customer satisfaction Conformance requirements Fitness to use Prevention over inspection Quality is planned, designed, and built in Continues improvement P-D-C-A cycle Management responsibility
16 Common Quality Tools

17 Cost of Quality (COQ) Cost of Quality Cost of Conformance Cost of nonconformance Prevention cost Appraisal Cost Internal failure Cost External failure Cost
18 Cost of conformance Prevention Cost Training Document processes Equipment Time to do it right Appraisal Cost Testing Destructive testing loss inspection Money spent during the project to avoid failure
19 Cost of non-conformance rework scrap Internal Failure Cost External Failure Cost Liabilities Warranty work Lost business Money spent during and after the project because of failure
20 Cost Benefit Analysis The primary benefit of meeting quality requirements can include less rework, higher productivity, lower cost, and increased stakeholders satisfaction

21 Control Chart USL UCL LCL LSL
22 Benchmarking Benchmarking involves comparing actual or planned project practices to those of comparable projects to identify best practices, generate ideas for improvement, and provide a basis for measuring performance.
23 Design of Experiments Design of Experiments (DOE) A.K.A. Experimental Design is a statistical method for identifying which factors may influence specific variable of a product or process under development or in production.
24 Statistical Sampling Statistical sampling involves choosing part of the population of interest for inspection. Simple random sampling Systematic sampling Stratified sampling Probability proportional to size sampling Cluster sampling Matched random sampling Quota sampling Convenience sampling Line-intercept sampling Panel sampling Event sampling methodology

25 Flowchart A flowchart is a graphical representation of a process showing the relationships among process steps.
26 Cause and Effect Diagrams A.K.A Ishikawa diagrams or fishbone diagrams. It illustrates how various factors might be linked to potential problems or effects.

27 Cause and Effect Diagrams
28 Cause and Effect Diagrams
29 Cause and Effect Diagrams
30 Histogram A histogram is a vertical bar chart showing how often a particular variable state occurred

31 Histogram Frequency Weeks

32 Pareto Chart A specific type of histogram ordered by frequency of occurrence. Pareto s Law holds that a relatively small number of causes will typically produce a majority of problems or defects. It is commonly referred to as the 80/20 principle.

33 Pareto Chart
34 Run Chart A line graph the shows data points in the order in which they occur. It shows the trend over time
35 Run Chart
36 Scatter Diagram A scatter diagram shows the relationship between two variables, dependent variable and independent variable.

37 Scatter Diagram

38 Affinity Diagram Classification of generated ideas
39 Process Decision Program Chart (PDPC) Used for contingency planning since it aids team to predict intermediate actions that can derail objectives
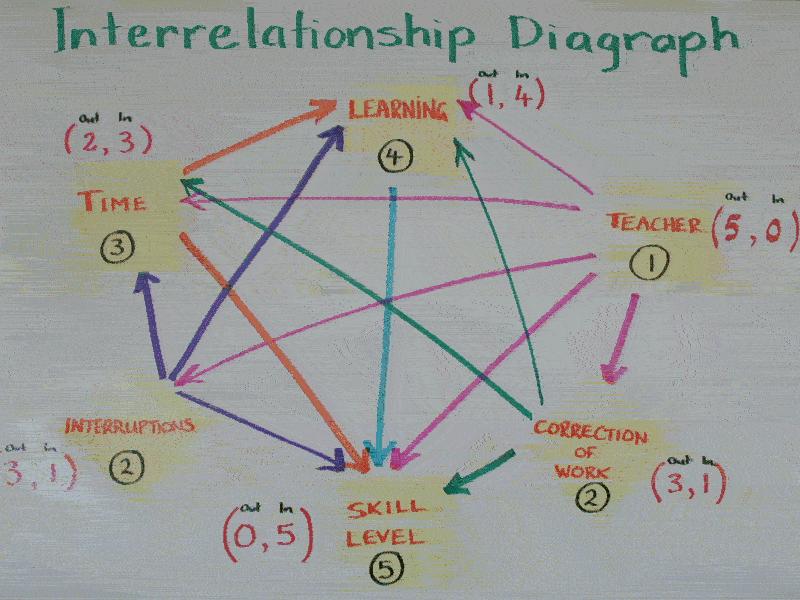
40 Interrelation Digraph

41 Tree Diagram A.K.A Systematic Diagram, used to represent hierarchical decompositions. Examples include WBS, RBS and OBS
42 Prioritization Matrix

43 Matrix Diagrams The Matrix diagram seeks to show the strength of relationships between factors, causes, and objectives that exists between the rows and columns
44 Inspection An inspection is the examination of work product to determine whether it conforms to documented standards.
45 Quality Audits A quality audit is a structured, independent review to determine whether project activities comply with organizational and project policies, processes, and procedures.

46 Project Quality Management Processes
47 Project Quality Management Project Quality Management processes includes all the activities of the performing organization that determine quality policies, objectives, and responsibilities so that, the project will satisfy the needs for which it was undertaken
48 Project Quality Management Project Quality applies on all Project Meeting schedule Team satisfaction Within budget Customer satisfaction Product Quality is industry specific Bug free Meeting requirements Meeting performance requirements


49 Project Quality Management Plan Quality Perform Quality Assurance Perform Quality Control
50 Assurance VS Control Perform Quality Assurance Are we following standards? Use measurements from QC Perform continuous improvements Perform quality audit Find good practices Share good practices Perform Quality Control Are we meeting standards? Measure quality Identify quality improvements Verify deliverables Complete checklists Update lessons learned Submit change requests
51 Plan Quality Plan Quality is the process of identifying quality requirements and/or standards for the project and product and documenting how the project will demonstrate compliance.


52 Plan Quality (continued) Customer Satisfaction
53 Inputs 1. Project Management Plan Scope Baseline Scope statement WBS WBS dictionary Cost performance baseline Schedule baseline Other management plans 2. Stakeholder register 3. Risk register 4. Requirements Documentation
54 Inputs (continued) 5. Enterprise environmental factors Standards, rules, regulations, guidelines 6. Organizational process assets Quality policy, procedures, historical data, lessons learned,
55 Tools and techniques 1. Cost-benefit analysis 2. Cost of quality 3. Seven basic quality tools 4. Benchmarking 5. Design of experiments 6. Statistical sampling 7. Additional quality planning tools 8. Meetings

56 Out-1: Quality Management Plan The quality management plan describes how the project management team will implement the performing organization s quality policy.

57 Out-2: Process Improvement Plan The process improvement plan details the steps of analyzing processes to identify activities which enhance their value. Areas to be considered: Process boundaries Process Configuration Process Metrics Target for performance improvements
58 Out-3: Quality Metrics A quality metric describes a project deliverable or product attributes and how control quality process will measure it. Length : Budget ± 10% Duration ± 1 day The tolerance defines the allowable variation on the metric.

59 Out-4: Quality Checklists A checklist is a structured tool, usually component specific, used to verify that a required steps has been performed

60 Out-5: Project Documents Update Stakeholder register Requirements Traceability Matrix (RTM)
61 Perform Quality Assurance Perform Quality Assurance is the process of auditing the quality requirements and the result from quality control measurements to insure appropriate quality standards and operational definitions are used. Quality Assurance seeks to build confidence that work in progress will be completed in a manner that meets the specified requirements and expectations
62 INPUTS 1. Quality management plan 2. Process improvement plan 3. Quality Metrics 4. Quality control measurements 5. Project documents
63 Tools and Techniques 1. Quality Management and Control Tools 2. Quality Audits

64 TT-3: Process analysis Process analysis follows the steps outlined in the process improvement plan to identify needed improvements. Process analysis includes root cause analysis a specific technique to identify a problem, discover the underlying causes that lead to it, and develop preventive actions

65 Outputs 1. Change requests 2. Project management plan updates 3. Project documents updates 4. Organizational process assets updates
66 Control Quality Control Quality is the process monitoring and recording results of executing the quality activities to assess performance and recommended necessary changes. Objectives: Identify cause of poor process and product quality Validate project deliverables

67 Inputs 1. Project management plan 2. Quality metrics 3. Quality checklists 4. Work performance data 5. Approved change requests 6. Deliverables 7. Project documents 8. Organizational process assets
68 Tools and techniques 1. Seven Basic Tools 2. Statistical Sampling 3. Inspection 4. Approved Change Requests Review

69 Out-1: Quality Control Measurements Quality control measurements are the documented results of quality control activities in the format specified in the quality planning
70 Out-2: Validated Changes Any changed or repaired items are inspected and will be either accepted or rejected.

71 Out-3: Verified deliverable Deliverables that passed quality tests Verified deliverables are in input to validate scope for formalized acceptance
72 Out-4: Work Performance information Performance data collected from various controlling processes, analyzed in context and integrated based on relationships across areas.
73 Common outputs 5. Change requests 6. Project management updates 7. Project documents updates 8. Organizational process assets Completed checklists Lessons learned documentation

74
75 Thank you,