CACI International Inc. Jefferies Technology Conference May 2017
|
|
|
- Christopher Spencer
- 5 years ago
- Views:
Transcription
1 CACI International Inc Jefferies Technology Conference May 2017
2 Forward-looking Statements There are statements made herein which do not address historical facts and, therefore, could be interpreted to be forward-looking statements as that term is defined in the Private Securities Litigation Reform Act of Such statements are subject to factors that could cause actual results to differ materially from anticipated results. The factors that could cause actual results to differ materially from those anticipated include, but are not limited to, the following: regional and national economic conditions in the United States and globally; terrorist activities or war; changes in interest rates; currency fluctuations; significant fluctuations in the equity markets; changes in our effective tax rate; failure to achieve contract awards in connection with re-competes for present business and/or competition for new business; the risks and uncertainties associated with client interest in and purchases of new products and/or services; continued funding of U.S. government or other public sector projects, based on a change in spending patterns, implementation of spending cuts (sequestration) under the Budget Control Act of 2011 and the Bipartisan Budget Act of 2013; changes in budgetary priorities or in the event of a priority need for funds, such as homeland security; government contract procurement (such as bid protest, small business set asides, loss of work due to organizational conflicts of interest, etc.) and termination risks; the results of government audits and reviews conducted by the Defense Contract Audit Agency, the Defense Contract Management Agency, or other governmental entities with cognizant oversight; individual business decisions of our clients; paradigm shifts in technology; competitive factors such as pricing pressures and/or competition to hire and retain employees (particularly those with security clearances); market speculation regarding our continued independence; material changes in laws or regulations applicable to our businesses, particularly in connection with (i) government contracts for services, (ii) outsourcing of activities that have been performed by the government, and (iii) competition for task orders under Government Wide Acquisition Contracts (GWACs) and/or schedule contracts with the General Services Administration; the ability to successfully integrate the operations of our recent and any future acquisitions; our own ability to achieve the objectives of near term or long range business plans; and other risks described in our Securities and Exchange Commission filings. 2

3 CACI Over 55 Years Supporting National Priorities +$4 billion annual revenue A Fortune World s Most Admired Company in IT Services Fortune 1000 Largest Companies in America Approximately 20,000 employees, ~70% with security clearances Consistently recognized as a top employer of veterans, who make up approximately 30% of our workforce Growth over past 25 years against foundation of well-articulated strategy, augmented significantly through highly successful M&A Successful acquisition of over 30 companies during last 10 years More than 60 successful acquisitions since 1992 Character-based culture of ethics, integrity, and operational excellence 3
4 A History of Growth *FY17 values based on mid-point of most recent guidance 5/3/2017 4
5 Third Quarter Highlights Record revenue, up 11%; net income up 18%; diluted EPS up 17% Record $1.4 billion of contract awards driving a TTM bookto-bill of 1.5 times Backlog now $11.8 billion, or about 3 years of revenue on a TTM basis Operating cash flow of $81 million Raised FY17 guidance Reflects higher demand for our solutions and services throughout FY17 5
6 Continued Strong Cash Flow Generated $81 million in operating cash flow for the quarter, 200% of net income Net debt of ~$1.2 billion Days sales outstanding 58 days versus 64 days in Q3 16 $400 $350 TTM Operating Cash Flow as a % of TTM Net Income (right scale) TTM Free Cash Flow 250% 200% $ millions $300 $250 TTM Operating Cash Flow (left scale) 150% 100% $200 $150 50% 0% 6
7 Raising FY17 Guidance Current FY17 Guidance Previous FY17 Guidance Revenue (millions) $4,275 - $4,350 $4,150 - $4,300 Net Income (millions) $157 - $163 $155 - $162 Diluted EPS $ $6.49 $ $6.45 Diluted shares (millions) FY17 revenue expected to be 14% to 16% above FY16 revenue FY17 net income expected to be 10% to 14% above FY16 net income FY17 diluted EPS expected to be 8.5% to 12.7% above FY16 diluted EPS FY17 operating cash flow expected to be greater than $260 million This guidance represents our views as of May 3, Investors are reminded that actual results may differ from these estimates for reasons described in our Safe Harbor Statement and our filings with the SEC. 7
8 Current Market Dynamics Omnibus appropriations bill passed for Fiscal Year 2017 Stated priorities for government s Fiscal Year 2018 align well with CACI s position in the marketplace Have minimal exposure to agencies that may be potential bill payers Increased national security spending New border protection initiatives Space domain Cyber Regulatory and corporate tax relief Remain confident in the health of our core market and our ability to deliver on our stated long-term goals 8


9 Strategy to Drive Long-Term Performance Winning New Business W W W Market aligned, focused on government s high-priority missions Optimizing business development Bidding selectively and winning larger contracts Increasing solutions and fixed price content Driving Operational Excellence Credentialing value delivery systems Efficient, effective, ethical program management Deploying Capital In Support Of Future Growth M&A is 1 st priority of capital deployment Add capability and customers to accelerate growth Deliver long-term shareholder value 9
10 Executing Market Aligned Strategy Each Market has a stand-alone Execution Strategy Market Trends and Growth Rates Identifies trends and spend rates by segment Key buyers Technology Roadmap Legacy to next-generation technology Human Capital Plan Cost Structure/Competitive Bidding Rates Recruiting Investments Capability/technology development M&A targets Each Market has a dedicated Management team with Leading Market Credentials Each Market has a Consistent Delivery Model with talented Program Managers and Certifications needed 10

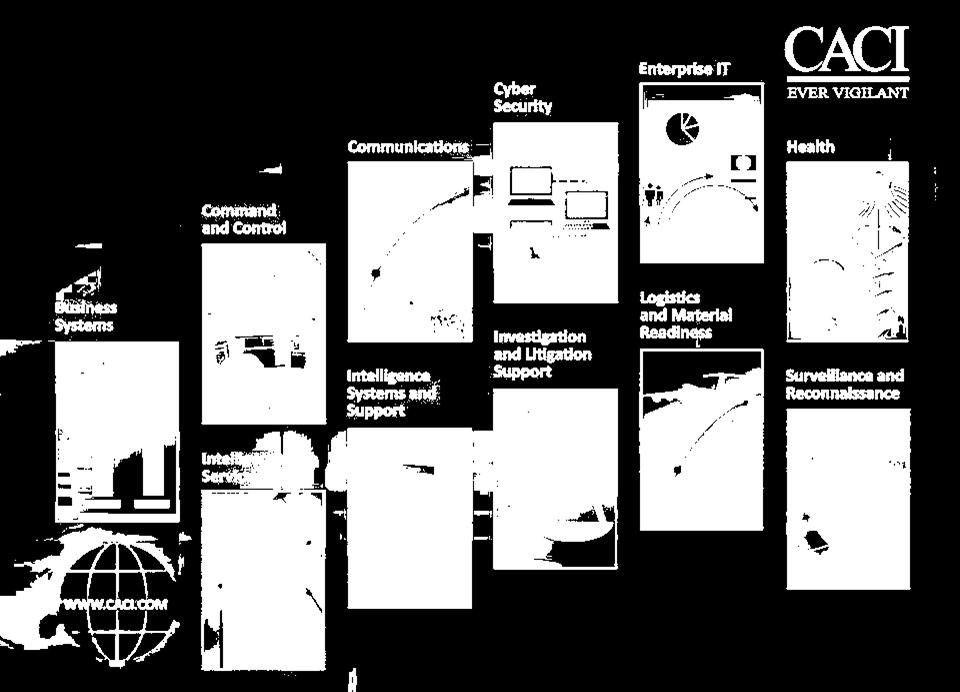
11 11 Markets We Serve


12 Intelligence Systems and Support Systems that Collect Data End-to-End RF Systems Operations Management Analytical Tools Tactical Integration Key Capabilities Software Defined Solutions that enable Multi-Mission Adept at Firm Fixed Price Development Mission Centric Easy to Use, Highly Relevant Proven Innovation for High Profile Threats 12
13 Enterprise IT Large / Broad Technology Fueled Market Our Focus: Where IT Meets Mission Progressive Customers Key Capabilities Cloud Powered Solutions / Migration S/W Defined Networking Automation / ITIL / CMMI 3 Services Performance Based Service Management SLA and FUP Based Implementations Mission Integrated IT and IT Cyber 13


14 Business Systems Human Capital Management Systems Financial Management Systems Acquisition Systems Supply Chain / Logistics Management Systems Agency-Specific Systems Key Capabilities Domain Knowledge + Technology + Know-How C-Suite Understanding Finance, HR, Contracts, SAP, Oracle, People Soft Holistic Data Integration Model-Driven Design and Implementation (MDDI) 14


15 Intelligence Services Insight from available data/information for a specific purpose including action, decision support, and/or gaining further information. Operations to systematically collect, process, and evaluate data/information and report to meet specific requirements Customers include NSA, CIA, DIA, NGA, NRO, etc. Terms: Single-Source, All- Source, Language, Counterintelligence 15


16 16 Intelligence Services Sense Making - Mission Outcome Terrorism, F3EA, Proliferation, Regional Expertise EXISTING CAPABILITY BASE Near-Term Organic Growth Focus Expand Offering Long-Term Goal Cyber Exploit and Attack Leverage footprint in key commands to expand DoD presence. Highlight CT, F3EA, FMV, and regional expertise. Leverage DoD experience into the Homeland Security arena. Expand insider threat and coalition info sharing offering Transition to key info/mission services provider beyond DoD/IC STRATEGIC GOALS Become Go-To Contractor to provide enduring, highpriority intelligence support Agility to provide skilled personnel able to perform critical missions in rapidly evolving environment. Differentiate our services in process, tradecraft, tools, technical innovation, and proven mission excellence Guide contracts to FP and FUP where possible Help Customers Disrupt Their Own Markets Adapt evolving IT and sensor advances to meet current and future intelligence requirements Leverage related CACI market capabilities to set conditions for sustained growth


17 Executing Market-Aligned Strategy Market Strategies + Enhanced Mix of Business + Operational Excellence + Deployment of Capital for Growth Predictable, Profitable Growth Organic Revenue 1-4% Margin Expansion bps 17 17

18 Q&A Supporting critical missions for Intelligence, Defense, Homeland Security, Healthcare, and Federal Civilian customers 18
 Access the CACI Financial & Operating Database for")
19 Investor Resources ( Access the CACI Financial & Operating Database for historical financials and metrics 19