4/26/2017. Financial Disclosure. Why So Much Hiring? Hiring a New Provider Use Benchmarks to Understand Productivity Expectations Maureen Waddle
|
|
|
- Virginia Powers
- 5 years ago
- Views:
Transcription


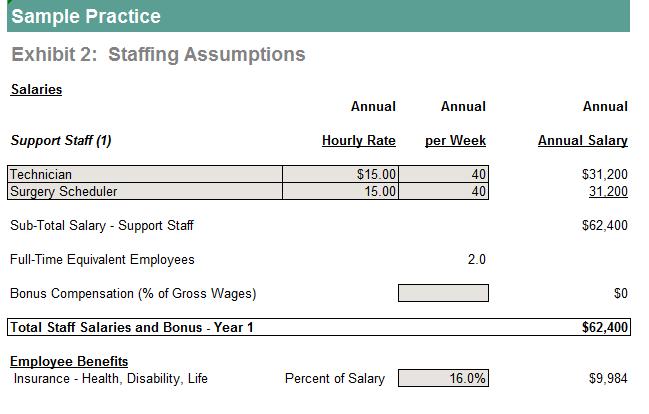
1 Ophthalmologists Hiring a New Provider Use Benchmarks to Understand Productivity Expectations Maureen Waddle Principal and Senior Consultant, BSM Consulting 07 ASCRS ASOA Meeting Financial Disclosure Hiring a New Provider? Presented by: Maureen Waddle Maureen is a Principal and Senior Consultant at BSM Consulting. BSM Consulting provides practice management solutions to specialty care providers include the online resource BSM Connection for Ophthalmology. Why So Much Hiring? Requirement for ophthalmologists will increase 8% from 005 to 00 6,000 5,000 4,000 3,000,000,000 Expected Oph Required Oph 0,000 9,000 8, Year Source: DHHS Physician Supply and Demand Projections to 00.
2 Successful Provider Recruiting Strategy First Preparation and Clearly Defined Expectations Transparency and Honest Communication Objectives/Agenda Review break-even analysis concepts 3 Understand financial and productivity benchmarks to help with analysis Test concepts with some case studies 4 Provide tools & resources Review Break-Even Analysis Concepts
3 Difference in Expenses Fixed Expenses Do not vary with number of patients seen. Categories include rent, most salary, insurance, and utilities. Relevant range of activity. Increases or decreases are more incremental. Measure of business risk. Variable Expenses Proportional to level of business activity. Relate to number of patients or units of service. Examples include medical and surgical supplies, some salaries. Behavior of Expenses Fixed Expenses $500,000 Volume =,000 Fixed CPV = $500 Volume =,500 Fixed CPV = $333 Volume = 500 Fixed CPV = $,000 Volume = 3,000 Fixed CPV = $67 Variable Expenses Cost / Visit = $00 Volume =,000 VCPV = 00 Total Variable Exp. = $00,000 Volume = 500 VCPV = $00 Total Variable Exp. = $50,000 Volume = 3,000 VCPV = $00 Total Variable Exp. = $300,000 Break Even / Basis for Financial Impact $,000,000 $,800,000 $,600,000 $,400,000 $,00,000 $,000,000 $800,000 $600,000 $400,000 $00,000 $ Volume (000s) Total Rev Fixed Ex Variable exp Staffing Total Exp 3
4 Why do we care about the behavior of expenses? Contribution Margin Analysis CONTRIBUTION ANALYSIS OF CURRENT ASSOCIATES Current Volume 0,50 Revenue ($90/OV) $,947,500 Variable Expense (includes associate comp) $,05,000 Contribution Margin $9,500 CM per office visit $90 Objectives Review break-even analysis concepts Understand financial and productivity benchmarks to help with analysis 4

5 New Provider Analysis Getting Started What information do we need? MD Benchmarks Benchmark Case Study - 5 0: $75-50 $800K - $.3M 4-8 $40K - $00K Cataract Yield Ratio Revenue per OV Revenue per FTE MD Staff per FTE MD Revenue per Staff 5: Ave: $470 Ave: $.3M Ave: $90,000 50% - 70% Operating Overhead 58% 4,000 7,000 Annual OV per FTE MD Ave: 4,5 Benchmarks are 5 th 75 th percentile of BSM client data corroborated with industry resources OD Benchmarks Collections per FTE OD Range: $00,000 - $400,000 Annual encounters per FTE OD Range:,000-4,000 Collections per OV Average visits per clinic day Range: $80 - $50 Average: 6 The ranges are developed by BSM Consulting working with practices throughout the country. The ranges are 5 th 75 th percentile. This information is corroborated working with national survey and databases like the American Academy of Ophthalmology benchmarking survey, the American Optometric Association report on the state of Optometry, and Management & Business Academy Key Metric of Optometry Practices report. 5


6 Compensation Depends on geography / supply & demand Larger organizations tend to have higher guarantee / base salary with little incentives Years of experience Specialty Ophthalmologist Base: $50,000 - $50,000 Average: all ophthalmologists = $30,000 Optometrist Base: $85,000 - $0,000 Average: all optometrist = $5,000 (make more in ophthalmic practices) Objectives Review break-even analysis concepts 3 Understand financial and productivity benchmarks to help with analysis Test concepts with some case studies Conducting the Analysis 6

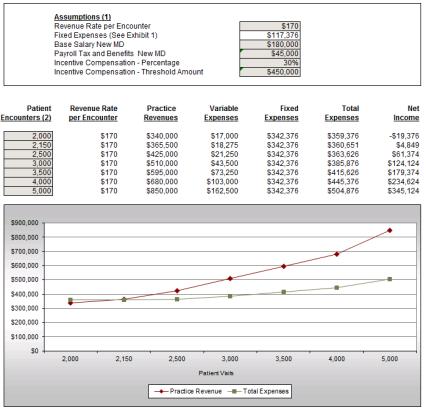

7 Conducting the Analysis Take it one step further Sample New MD Analysis 7
 - provider compensation & production Healthcare Group - Physician Starting Salary Survey Medscape Physician")
8 Objectives Review break-even analysis concepts 3 Understand financial and productivity benchmarks to help with analysis Test concepts with some case studies 4 Provide tools & resources General Resources Physician Compensation Resources: MGMA (Medical Group Management Association) - provider compensation & production Healthcare Group - Physician Starting Salary Survey Medscape Physician Compensation Report Bureau of Labor Statistics (Optometry) Review of Optometry Annual Salary Survey Professional Organizations: American Society of Cataract & Refractive Surgeons, American Academy of Ophthalmology; American Optometric Association Benchmarking Resources: ASOAnalytics (ASOA benchmarking program) AcadeMetrics (AAO benchmarking program) MGMA Provider compensation & Production BSM Connection for Ophthalmology Thank you for participating! Maureen Waddle Principal and Senior Consultant, BSM Consulting mwaddle@bsmconsulting.com 8