Conducting, Sharing, and Utilizing a Community Needs Assessment
|
|
|
- Amberly Freeman
- 5 years ago
- Views:
Transcription


1 Conducting, Sharing, and Utilizing a Community Needs Assessment Training Workshop Beyond the Basics ROMA Series


2 Welcome & Introductions Who s here? Name, Organization, Role What is your prior involvement in a Community Needs Assessment? None Some Lead it What is one thing you d like to improve on or learn?
3 Learning Objectives Clarify importance of Needs Assessments for Community Action Consider infrastructure useful for a successful CNA process Identify tools and strategies for analyzing data by demographics and geography Understand the relationship between data from agency sources and other quantitative and qualitative data that is collected Understanding how clear identification of the causes of poverty in your community can guide the use of the full ROMA Cycle Practice prioritizing the needs Discuss creating succinct explanation of findings Understand the importance of having realistic strategies for sharing findings with your Board and others
4 Why Are Needs Assessments so Important to Community Action?
 49 2001 CSBG Act")
5 Part of Our History Office of Economic Opportunity Instruction 1964 Information Memorandum (IM) CSBG Act 1991, 1998
6 ROMA and Planning
7 Organizational Standards Standard 3.1 The organization conducted a Community Assessment and issued a report within the past 3 years. Standard 3.2 As part of the Community Assessment, the organization collects and includes current data specific to poverty and its prevalence related to gender, age, and race/ethnicity for their service area(s). Standard 3.3 The organization collects and analyzes both qualitative and quantitative data on its geographic service area(s) in the Community Assessment.
8 Organizational Standards Standard 3.4 The community assessment includes key findings on the causes and conditions of poverty and the needs of the communities assessed. Standard 3.5 The governing board formally accepts the completed Community Assessment.
9 Embedded In Our Core Principles Gives Us The Flexibility to Address Specific Local Needs Employs Maximum Feasible Participation Assures Tripartite Board Involved Throughout Provides Data for Agency Focus and Direction Conducted Every 3 Years
10 What a Needs Assessment Can Do Create a detailed picture of the need Add data to support or challenge your personal beliefs and experience Guide development of organizational strategy to address the needs
11 Community Assessment Connecting the CNA with Other Strategic Plan Planning Processes Community Action Plan
12 Key Assessment Goals Assess level of poverty within the whole community. Assess how well the needs of low income individuals and families are currently being met including what assets and resources the community has Identify service barriers that limit the effectiveness of the current service network. Assess relationships with key partners and stakeholders and identify how to strengthen them Build awareness of Community Action and your community agenda Develop recommendations that will enhance the community s ability to address the concerns of low income individuals and families.

13 Be Clear on Your Agency s Goals What do you want to get out of this process? Internal External How are you going to use this data? Strategic Planning Advocacy Fundraising
14 Different Data to Collect & Assess Identifying Appropriate Quantitative (Statistical) Data Gathering Qualitative Data Considering Agency Data Understanding the Resources and Assets in the Community Using Customer Satisfaction Data (to Identify what customers say about the agency)


15 5 Steps of the CNA Plan for the Assessment Prepare and Communicate Report Collect Quantitative Data Analyze Data Collect Qualitative Data
16 Create a workgroup Involve the Board, volunteers, partners Develop goals, data collection plan, timeline Create a Task List Determine how progress on the assessment plan will be monitored Develop status report formats Plan Back to main
17 Engage the Board Help Board Members understand their role in the process. They will: Establish the scope of the assessment Review the data collection plan Approve a proposed budget for the assessment process Assist in outreach to key stakeholders and partners policy makers and media broader community

18 Workgroup Members and Roles
19 What Will the Work Group Do? The work group will: Define the community Clarify: What data will be needed Who/what the sources of data will be How the data will be collected This group sets direction and provides oversight and feedback throughout the assessment process. Facilitates linkages with community leaders and organizations. Is deeply involved in the analysis of the data. Provides long term support for follow up and implementation of recommendations. Develops a recommended budget
20 Who should be on the Assessment Work Group? Identify who will be included in the Assessment Work Group Board Members is there a committee of the board formed? are just a few members of the board asked to participate in this group? Staff Leadership team or upper management Planners or Grant Writers Direct service staff Others From outside the agency? Customers Partners Other stakeholders
21 Data Collection Plan When developing the plan, it is a good idea to brainstorm with your team: 1. What issues or domains will you assess? 2. What are the different sources you will use to get a variety of type and level of data? 3. What data collection method you will utilize for each? 4. How will you identify resources and assets?
22 Develop Task List Review budget and resources for the assessment process Define CAA staff and/or consultant roles Recruit partners and participants who will provide input Choose and finalize data tools

23 Develop a Timeline


24 Recruit Volunteers & Partners Non Profits City or County Community Development Depts Head Start Parents Chamber of Commerce, Lion s Club & Rotary Other service providers Educational Partners Community foundations Hospital systems Private sector Faith based organizations
25 Other Tips in Planning for Data Collection Use a three year time frame if possible to allow for identification of trends Sequence quantitative and qualitative methods (e.g. follow up surveys with focus groups) Pair data collection methods with types of stakeholders and data collection needs (e.g. surveys for customers; key informant interviews for partners) Consider connections to the strategic planning process

26 What Has Happened Before? What challenges have you faced in this stage? What has worked well in setting up process? How has planning process gone one person? Plan as you go? How much time does this take?
27 Decide what quantitative data is needed CNA Online Tool US Census Local Agency Surveys Collect Quantitative Data

28 Quantitative (Quantity confirms) o Numerical/Statistical o Demographic o Economic o Social Can be time consuming... Solution? Web Based Data Tool Comprehensive tool to collect secondary data Provide comprehensive data in one location Trustworthy source Frees up time to focus on primary data and assets State & National Tools University of Missouri CARES
29 Statistical Data 1. Learning to use the CNA Web Tool in the Engagement Network Hub 2. Name 5 conditions of poverty found in your service area data
30 Using the CNA Online Tool Engagement Network Hub Provides summaries of census data (the raw numbers related to many different factors) AND also provides customizable visualizations of the data in different forms (such as maps) Maps of the entire service area Where are the areas of high poverty concentration? Are there any food deserts? Where are the services and other assets? Zip code maps Identify specific data by zip code


31 Maps, Charts and Graphs
32 Sorting the Quantitative Data How do various data points interconnect? Reports from the CNA Online Tool can sort data bringing different areas together High poverty and low education Health indicators and poverty Housing patterns in low income communities
33 Agency Reports Quantitative Data Using whatever data system or methods you have to track who is being served and with what programs, consider... Who is being served? What are their demographics? What programs and services sites are being utilized? Then compare agency data with quantitative data that has been collected.
34 Decide what qualitative data is needed Interviews Focus Groups Forums Open Ended Survey Questions Collect Qualitative Data Back to main
35 Qualitative (Quality explores) o Narrative, themes, perceptions o Available community resources o At risk or threatened resources o Unmet community needs o Current barriers to accessing services External o Key Informant Interviews o Community Forums o Focus Groups o Surveys Internal o Agency Capacity Surveys
36 General Public Getting a Diverse and Representative Community Organizations Key Partners Sample of Your Community Customers and other residents with lowincome
37 Participants for Qualitative Data Clients (Current and Former) Asking about met and unmet needs and desired services Via mail, at agency, online Low Income Community Members Asking about unmet needs and service gaps Through partner organizations and at community locations such as housing developments and local businesses (as grocery stores)
38 Participants for Qualitative Data Community Organizations Asking about their services (collaboration or existing gaps), unmet needs they see, causes Via , phone call, with interview Community Residents Comparison for needs and gaps in services, also for potential resources or strategies Mail via zip code, newspaper and radio, local paper advertisements
39 Internal Participants Board Members Asking about gaps in services, satisfaction, changes foresee in the future Staff Asking about unmet needs, causes of needs, understanding of barriers, recommendations Through meeting, online, may need to be anonymous

40 Survey Question Checklist Courtesy Of University of Wisconsin Madison Office of Quality Improvement

41 One on One or Many Model an interview Select 6 participants and conduct a focus group With all participants conduct a forum
42 Other Agency Level Qualitative Data Customer Satisfaction data is qualitative data that is specifically focused on issues relating to the agency's provision of services or engagement in strategies. Responses to open ended prompts can help you consider.. How well were customers satisfied with the services? Were there any particular issues that were raised? Or Successes that were identified? Then compare this data with other qualitative data that has been collected.

43 Remember the Big Picture Quantitative data can tell you HOW MANY? Qualitative data provides the CONTEXT. Combine what you know with data and stories to build a complete picture for how you will address the needs.
44 In Summary Data to Collect Quantitative Statistics & demographics from: Census Databases Other sector reports Qualitative Narratives, explanations, & stories from: Community Forums Surveys Focus Groups Key Informant Interviews Agency Data Demographics, outputs, & outcomes from: Agency databases CSBG IS/Annual Report Customer Satisfaction Community Assets/Resources Inventory of what is available System of Services Gaps, underserved populations, challenges in service integration, etc
45 Most crucial part of the assessment process Analyze Rank Categorize Organize for Report Analyze Data Back to main
46 Remember Why You Started: Goals of the Assessment Assess level of poverty within the whole community. Assess how well the needs of low income individuals and families are currently being met including what assets and resources the community has Identify service barriers that limit the effectiveness of the current service network. Assess relationships with key partners and stakeholders and identify how to strengthen them Build awareness of Community Action and your community agenda Develop recommendations that will enhance the community s ability to address the concerns of low income individuals and families.
47 Analyze the Collected Data to Identify: areas of need needs by demographic categories geographic areas of need gaps in services new partners and resources root causes of poverty and to gather customer, staff, and partner feedback
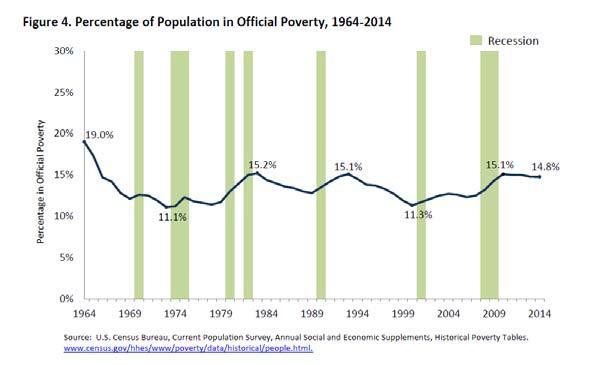
48 Why Analyze Data? Data is facts that are observed, measured, collected and aggregated. Data only becomes information once it has been analyzed in some fashion. Knowledge (or insight) is derived from the interaction of information and experience with a topic. Decisions, based on databased knowledge, produce potential Actions to take to improve. Action Collection Insight Analysis

49 Organize the Data Organize Data by Domain Employment Education and Cognitive Development Infrastructure /Income/Asset Building Housing Health and Social/ Behavioral Development Civic Engagement and Community Involvement
50 Aggregate by Domains Collected qualitative and quantitative data for each domain Each domain will have information about: Demographic data (age, race/ethnicity, gender) Geographic data (distribution of need by census tract/zip code, comparison to regional, state, and national data) Trended data over time (data from the last three years is preferable)
51 Analysis by Domain Identify the needs for your domain (using all sources) Note differences based on age, gender, race/ethnicity for each need where available Identify potential barriers and causes (that were mentioned by the group and also from your knowledge and experience) Identify assets/partners/opportunities/ recommendations for this domain (that were mentioned by the group and also from your knowledge and experience)
52 Other Categories Locations (neighborhoods, sections of the service area by rural or urban, etc.) Other
53 Analysis Techniques After you have aggregated the data (sorted into meaningful categories) then you can: Count Compare Examine Trends Use Tools for Visualization Mapping Charts & Dials
54 One Technique Is To Count How many responded in a certain way? How many identified a similar need? How many of a certain characteristic? How many in a certain geographical area?
55 Compare Data from year to year (looking at prior years). Your community with national trends. Assessment of needs that were done by other groups. Differences that may be seen within groups or between groups. Data from other providers or other programs.
56 Looking at the trends
57 Using Trend Data Analyze the trend you have seen in the past few years. Did the number of people in need of a particular thing remain the same over the past few years or are there annual fluctuations? If there are differences? What caused them? (changes in resources, changes in circumstances in the community, new population in need) How stable is the population? If there is a lot of movement, can that help to explain any changes in the trend?
58 Breaking Down Need by Level Need Domain: Employment Level: Clients lack skills to obtain living wage jobs (Family) Community lacks living wage job opportunities (Community) Agency lacks resources to work with job training program participants (Agency)
59 Creating Need Statements and Assigning Level of Need Family, Agency, or Community? For each need identified, write as a need statement and decide if it is primarily a family, agency, or community need. Write F, A, or C by each need listed on flip chart.
60 What Is Important? Of course, all of the issues you have identified are important and have an effect on poverty and the community but they all may not fall within the scope of your mission. The act of prioritizing can: determine which issues to address, decide if you want to focus on one issue with various approaches or allow others to address an issue.
61 Establishing Priorities Prioritization can help the agency focus on areas for new funding, trying new strategies, developing more partnerships, integrating services and creating change. After prioritizing, the agency can then move on to determine goals, objectives and action steps for their strategic plan.
62 Prioritizing Needs Prioritization Using feasibility, importance, and analysis, participate in a nominal group process

63 Consider what format is needed for the Assessment report Reports to meet state or funder requirements Report that classifies needs by domains and national Community Action goals Develop a plan for Communication Present to Board Publicize and Distribute Prepare and Communicate the Report Back to main
64 Causes and Conditions of Poverty: Crux of Who We Are We are expected to be the experts on poverty What you see everyday: Conditions WHY: Causes Why certain demographics experience need Why certain geographies experience need Why issues influence each other Why there are barriers to success Why the war on poverty isn t over
65 Format for Reporting Outline the report in a way that will meet the agency s overall needs and will address specific needs of various funders. Identify the sections of the report: By domains By geographical areas of the community By???
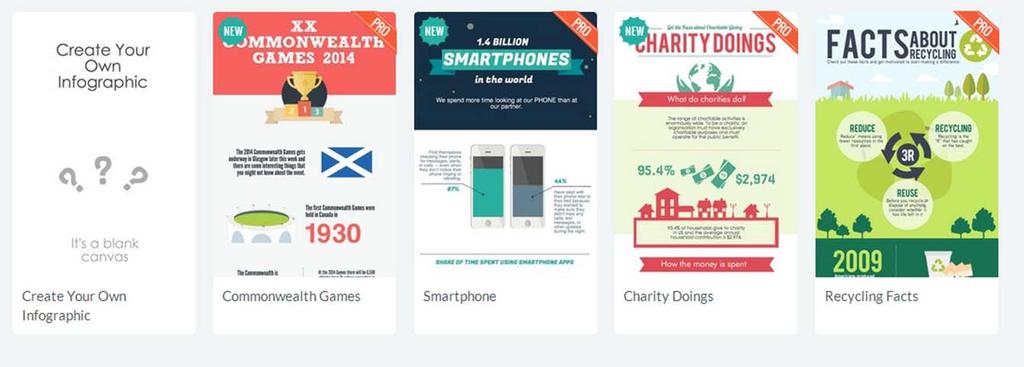
66 Include in Each Section Some things to consider including: Demographic profile of population Geographic distribution of need Trended data over time Programs and systems issues Assets And A concluding section on causes of the needs
67 Sample Sentences to Get Started My community includes the following demographics My community has important resources that help families reach self sufficiency such as My community needs the following resources to help families reach self sufficiency Families in my community need the following support if they are to reach self sufficiency Potential partners for my agency include the following organizations that provide specific services to revitalize our community and assist families as they move toward self sufficiency
68 Utilizing the Assessment & Sharing with the Board and others
69 Best Practices in Board Acceptance Deeper discussion/presentation with Program Committee of the Board Receive report to review before the meeting Pay attention to the key findings section Share big analysis findings that will help members obtain information they need to fully participate in the development, planning, implementation, and evaluation of the program to serve low income communities (IM 82) Required: Vote to accept and record in minutes (Standard 3.5)
70 Utilize Findings in Strategic Planning Remember those prioritized needs? Remember the recommendations the team made considering prioritization and partners? Remember the discussion on causes and the desire to get at the root issues? Be Accountable to that put in Strategic Plan Short Term and Long Term Goals and Objectives What direction do you need to go? What issues are you going to take on?
71 Your Board Should Know How demographics in service area have changed What the biggest needs are What your customers and community think works best to address their needs What gaps in services exist What your team recommends moving forward
72 Encourage Your Board to Share Findings Raise Awareness of Poverty We are needed in this community Raise Awareness of Agency Analysis of need and what you will do about it are great PR Build Partnerships Bring knowledge and experience grounded in data to the table Fundraise We understand the need, we have a strategic plan to address it Advocate Raise awareness about reality of poverty; the need to make change


73 Outline the Message Needs We have identified these needs, and have prioritized to address Outcomes We feel we will be able to make a difference in these areas and expect to see these changes: Resources We identified these existing resources and these resources that need to be developed Recommendations Our recommendations for agency action are:

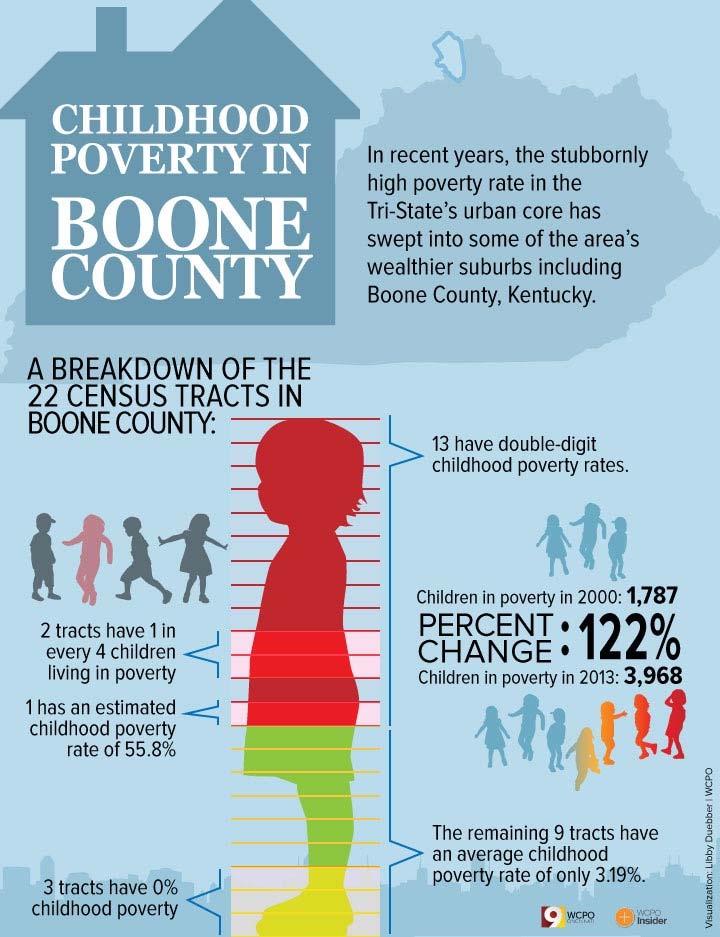
74 Be Creative & Make Findings Accessible Use charts, graphs, and dials from Community Commons for visual appeal Create infographics to display the numbers on piktochart.com or word cloud to show the most voiced needs as wordle.net Post on agency website and social media

75 Share From Community Commons What to share Dials + Charts + Maps


76 Share Demographics Let the community know who has the need

77 Share Geography Let the community know where the need is


78 Share Comparisons Let the community know how the need is in relation to the state or national averages or other areas


79 WHY to Share share Infographics CCNA Share with? Officials Share infographics and bite size pieces with EVERYONE -Keep it simple -Keep the conversation going -Contextualize numbers with client success stories
80

81
82
83

84 Request a nonprofit discount! Understand Community Share your with Target Members Officials Audience Where to share the CCNA for Maximum Impact piktochart.com canva.com

85 Make a Word Cloud From Qualitative Data Go to
86 Where Community to share Members Where to Share Where to share the CCNA for Maximum Impact Website - Define the need - Share your goal - Share your strategies Social Media - Share facts - Contextualize data

87 Understand Share Community Share on website your with Target Members Officials Audience WHY to share CCNA Where to share the CCNA for Maximum Impact


88 Understand Share Community Share on social your with Target media Members Officials Audience Where to share the CCNA for Maximum Impact


89 Understand Share Where Community Share on to social share your with Target media Members Officials Audience


90 Understand Share Community Share on social your with Target media Members Officials Audience
![Sample CNA Tweets [agency] is assessing community needs, all local input is valuable #talkpoverty [link to survey] [county] has [_] kids living in #poverty,](/docs-images/95/124853317/images/91-0.jpg "we are working with @[partner] to change that #CommunityAction View our key findings on causes and conditions of poverty here [link to website]")
91 Sample CNA Tweets [agency] is assessing community needs, all local input is valuable #talkpoverty [link to survey] [county] has [_] kids living in #poverty, we are working to change that #CommunityAction View our key findings on causes and conditions of poverty here [link to website] #CommunityAction
92 Facebook Can say more than on Twitter tell a story Show pictures from your CNA process Talk about the challenges you faced and the depth/importance of final product Link to your full report and website Say thank you to the clients and community members who participated
93 Where Community to share Members Where to Share Where to share the CCNA for Maximum Impact Community/Advocacy Meetings -Show that you are the poverty expert in your area -Share resources you bring to the table Demonstrate resources still needed

94
95 How will you share?

96 Questions
97 Requirements and Roles Resources Technical Assistance Guide Organizational Standards Category 3 This toolkit, created by the Partnership s Organizational Standards Center of Excellence walks through the documentation required for each of the Standards related to Needs Assessments. A Community Action Guide to Comprehensive Community Needs Assessments The toolkit, written by the National Association for State Community Services Programs (NASCSP) in July 2011 walks through the assessment process at large with specific information for this standard starting on page 32. Community Needs Assessment Tool Kit This toolkit, written by the Missouri Association for Community Action and Missouri State CSBG Office in April 2009 walks through the assessment process with specific information for this standard Statistical Data, Agency Gathered Data and Conditions of Poverty and Issue Areas on pages 7 30.

98 Technical Assistance Guides
99 CNA Online Tool Links Access this free site by visiting User Guides and Videos available
100 Data Collection & Analysis Resources A Community Action Guide to Comprehensive Community Needs Assessments The toolkit, written by the National Association for State Community Services Programs (NASCSP) in July 2011 walks through the assessment process at large with specific information for this standard starting on page 32. United States Census American Fact Finder This part of the Census Bureau website allows users to search and select different demographics to generate state tables. Smart Survey Design This guide from Survey Monkey walks through some basic survey tips. Living Wage Calculator From the Massachusetts Institute of Technology, this tool is designed to provide a minimum estimate of the cost of living for low wage families CFED Assets & Opportunity Local Data Center For statistics and maps on asset poverty, liquid asset poverty, unbanked, and underbanked rates by city, county, metro area and state HUD egis Community Assessment Reporting Tool For both needs and available resources including Community Planning and Development Grants, Rental Assistance, Mortgage Insurance, Fair Housing, Housing Counseling, and Demographics Centers for Disease Control and prevention Community Health Status Indicators Peer Counties Comparison Access this dashboard for how different counties in your service area compare to peer counties across various health indicators Food Research and Action Center s Interactive Data Tools on Nutrition Visit the FRAC Research Library to access data and maps on school breakfast, summer food programs, and state profile reports
101 Sharing CNA Resources CAP/NASCSP/NCAF/CAPLAW Social Media Webinar This recording gives tips on telling your story by sharing your outcomes on social media. Additionally, how to use this data for advocacy in a legally responsible way. Story Guide and Brochure from NASCSP Look for infographic webinars from NYSCAA Check out updates on Virtual CAP Infographics on piktochart Word Clouds on Wordle Check out talkpoverty.org
102 CNA Webinar Series Planning for a Community Needs Assessment webinar, click here Collecting Community Needs Assessment Data webinar, click here Analyzing Community Needs Assessment Data, click here Communicating Community Needs Assessment Data, click here


103 Share with To Educate us! We want to highlight your agency! Tag the Partnership: CAP Facebook /Community Action Partnership National Office
104 Contacts at the Partnership Jarle Crocker, PhD, CCAP, NCRT Director of Training and Technical Assistance Community Action Partnership National Office Courtney Kohler, MPA, CCAP, NCRT Senior Associate, T/TA Community Action Partnership National Office Natalie Kramer, MSW, NCRT Policy Associate Community Action Partnership National Office This presentation was created by the National Association of Community Action Agencies Community Action Partnership, in the performance of the U.S. Department of Health and Human Services, Administration for Children and Families, Office of Community Services Grant Number, 90ET0445 and 90ET0465. Any opinion, findings, and conclusions, or recommendations expressed in this material are those of the author(s) and do not necessarily reflect the views of the U.S. Department of Health and Human Services, Administration for Children and Families.
105 Thanks to The Association of Nationally Certified ROMA Trainers (ANCRT) And ROMA Professionals who reviewed this material and provided input for clarity and completeness on the topic. ~ Barbara Mooney barbaramooney@windstream.net