Powerful Performance Measurements for Control and Rapid Improvement
|
|
|
- Natalie Young
- 5 years ago
- Views:
Transcription

1 Powerful Performance Measurements for Control and Rapid Brian H. M askell Pr esident, B M A I nc. BMA Inc. 100 Springdale Road, Cherry Hill NJ USA
2
3 1
4 2
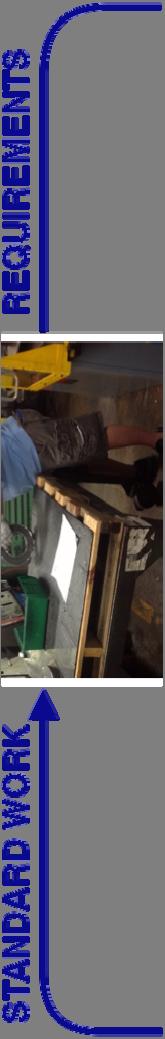
5 Lean Performance Measurements Measurements that motivate people to lean improvement. Measurements that motivate people to lean improvement. Measurements that reflect the business strategy of the company at every level. Measurements that are lean themselves & can be gathered and reported simply and easily. Use Measures for Learning and Problem Solving Traditional Use Lean Use Measures the results. Top-down control. Authority Oriented. Hides the problems. One-shot image. Success or failure based on targets. Focus on control of resources, people, & results. Concerned with results and the process of getting results. Local control & responsibility Reveals the problems & leads directly to solutions. Feedback loops to drive problem-solving, measure results, & learning. Focus on process & resources, standard work, & people development 3
6 Use Measures for Learning and Problem Solving Customer Value Stakeholder Needs Technology Changes STRATEGIC MEASUREMENTS VALUE STREAM MEASUREMENTS CELL & PROCESS MEASUREMENTS Business Strategy Hoshin Kanri Strategy Deployment Sales, Operations, & Financial Plan (SOFP) Value Stream Cell & Process BREAKTHROUGH IMPROVEMENT CONTINUOUS IMPROVEMENT JUST-DO-IT IMPROVEMENT The Purpose of Performance Measurements CELL & PROCESS MEASUREMENTS Enable the cell/process teams to monitor, control, & improve their own activities. VALUE STREAM MEASUREMENTS BUSINESS STRATEGIC MEASUREMENTS Guide the value stream team in their continuous improvement pursuit of perfection. Enable senior managers of the company to monitor the achievement of strategic goals & initiate strategy changes. 4
7 Starter Set of Performance Measurements for Lean Manufacturing STRATEGIC ISSUES STRATEGIC MEASURES VALUE STREAM MEASURES CELL/PROCESS MEASURES Increase Cash Flow Increase sales & market share Continuous improvement culture Provide Customer value Sales Growth Cash Flow from Operations Inventory Days On-Time Delivery Customer satisfaction Sales per Person On-Time Delivery Dock-to-Dock Time First Time Through Average Cost per Unit Day-by-the-Hour Production WIP-to-SWIP First Time Through Operational Equipment Effectiveness Sales per Employee 5
8 Performance Measurement Linkage Chart Order Fulfillment Value Stream 6


9 Cell Performance Measurements Typical Cell Performance Measurements Day-by-the-Hour Focus on making to takt time Linearity of production First Time Thru Focus on making perfect quality without scrap or rework Focus on standardized work Supporting measures or reporting Safety cross 5S audit Cross-Training matrix Daily improvement projects WIP-to-SWIP Work-in-process inventory compared to standard work-inprocess inventory Focus on consistency of flow Focus on the pull process Operational Equipment Effectiveness Focus on machines making to takt time Bottleneck operations 7


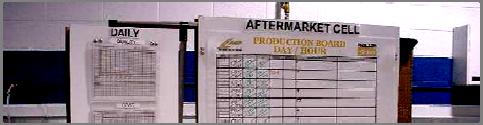
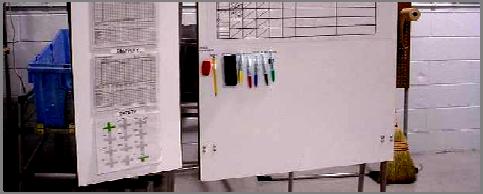
10 Example Day-by-the-Hour Board Support Measurements In addition to the primary measurements many companies also collect some supporting information at the cell. Safety Cross Cross-Training Chart 5S Audit or Self-Audit Number of Continuous Projects Completed 8

11 The Key to Effective Cell Performance Measurement Managers and support people frequently visiting the cells and solving problems. The focus must be on the value-creating processes. Making what the customers want, on-time & perfect quality. 9
12 10


13 Cell Measurement Board Cell Measurement Cube 11
 completed by the cell team members.")

14 Day-by-the 4 Hour Boards WHAT IS THE CELL OR PROCESS BOARD FOR? Control the cell process through frequent tracking of on-time and right-firsttime. Drive many small improvements (JDI s) completed by the cell team members. Provide real data about issues and problems to drive cell & value stream continuous improvement. WHAT MUST BE IN PLACE TO BE SUCCESSFUL? Standardized work. Standard, disciplined cell or process measurements Trained and engaged workforce completes JDI s each week. Cell or process people are empowered and have scheduled time for JDI s. Leaders daily gemba walks review, discuss, and authorize JDI s 12


15 Value Stream Performance Measurements Typical Production Value Stream Performance Measurements Sales per Person Productivity of everyone in the value streams On-Time Shipment Can we ship on-time? Are our processes under control? Dock-to-Dock Days Rate of material flow through the value stream Raw material, WIP, finished goods First Time Thru Quality & standardized work for the entire value stream Average Cost per Unit Are we reducing costs and making improvement? Supporting measurements Safety cross Cross training matrix Continuous improvement projects 13
 Pareto Chart (or other analysis) Pareto")

16 Productivity Value Stream Continuous Board Process Control Quality Material Flow Cost Sales or Units On-Time First Time Dock-to-Dock per Person Shipment Through Days Average Cost Pareto Chart (or other analysis) Pareto Chart (or other analysis) Pareto Chart (or other analysis) Pareto Chart (or other analysis) Pareto Chart (or other analysis) Projects Projects Projects Projects Projects Current Value Stream Map Future Value Stream Map Transition Plan BOX SCORE Value Stream Income Statement Value Stream Continuous Boardç 14


17 Value Stream Board Weekly Meeting Value Stream Continuous The primary purpose of the weekly reporting is to guide the value stream manager and his/her team towards continuous improvement. Tools Value stream performance measurement boards Value stream income statement Box Score Pareto charts Continuous improvement projects 15
18 16
19 WHAT IS THE VALUE STREAM BOARD FOR? Monitor the value stream performance and show the problems that need to be solved. Create continuous improvement projects to address root causes of value stream performance. Provide timely, valid data to drive continuous improvement WHAT MUST BE IN PLACE TO BE SUCCESSFUL? Visual boards update by the value stream team members The Vital Few focused measurements with pareto charts showing causes of the problems. Engaged workforce completing kaizen events continuously week-in and week-out. 17

20 WHAT IS THE VALUE STREAM BOARD FOR? Monitor the value stream performance and show the problems that need to be solved. Create continuous improvement projects to address root causes of value stream performance. Provide timely, valid data to drive continuous improvement WHAT MUST BE IN PLACE TO BE SUCCESSFUL? Visual boards update by the value stream team members The Vital Few focused measurements with pareto charts showing causes of the problems. Engaged workforce completing kaizen events continuously week-in and week-out. Strategic Measurements Sales Growth Cash Flow from Operations Are we generating enough cash? Inventory Days General indicator of lean improvement On-Time Delivery Measurement of control and meeting customer delivery needs Customer Satisfaction Direct feedback from the customers Sales per Employee Overall productivity 18


21 Monthly Plant or Corporate Measurements Corporate level measurements are reported visually at the Enterprise Visual Obeya Room 19
22 How Do Performance Measurements Apply in Support & Administration? We use similar measurement methods in the office & administrative processes. Administrative i i Process Measures Productivity of the process On-Time Delivery (to internal customers Rate of Flow of information through process First Time Thru of the process Administrative i i Cell Measures Day-by-the-Hour or Week-by-the-Day First Time Thru WIP-to-SWIP of the cell Other specific control measurements for the process Average Cost per Unit 20
23 Sales/Marketing Value Streams Measurements STRATEGIES STRATEGIC MEASUREMENS VALUE STREAM GOALS VALUE STREAM MEASUREMENS Increase Sales & Market Share Sales Growth Increase Sales & Profitability Sales Growth Increase Cash Flow & Reduce Debt Create Culture of Continuous Cash from Operations Customer Satisfaction Inventory Days or Turns Sales per Employee Suggestions per Person % People Engaged in Increase Number of Customer Match Sales to Value Stream Capabilities Improve Productivity Collect Cash Quickly Increase CI Project Participation Provide Advancement for Employees Customer Satisfaction Order to Cash Days Profitability of Order Fulfillment Value Streams Value Stream Cost per Sales $ Accounts Receivable Days # People on Teams Cross Training per Person Maintain Stable & Educated Workforce Annual Employee Survey Eliminate Accidents & Injuries Number of Accidents & Injuries 21
24 Sales/Marketing Value Stream: Quote Process VALUE STREAM MEASUREMENTS Sales Growth CELL CRITICAL SUCCESS FACTORS Understand Customer Value CELL GOALS Increase quote success by understanding needs PROCESS MEASUREMENTS Quote Success Rate % Customer Satisfaction Order to Cash Days Meet or Exceed Customer Expectations Fast & Effective Processes Maximum market price based on value Provide quotes quickly & to customer format Financial Contribution of the Orders Linearity of Sales Orders Profitability of Order Fulfillment Value Streams Value Stream Cost per Sales $ Obtain orders matching capacity & mix Eliminate waste Effective visual management Standardized work for quote processes First Time Through% Average Quote Response Time Accounts Receivable Days Eliminate variability Track Projects # People on Teams Increase CI Project Involvement Empowered continuous improvement 5S Audit Cross Training per Person Increase Training & Cross Training Widespread Cross Training Cross Training Chart 22
25 VALUE STREAM MEASURES CRITICAL SUCCESS FACTORS ACTIONS NEEDED SUPPLY CHAIN MEASURES S Q D C C Q D C E Safety Cross Quality First Time Through Level Production & On-Time Average Unit Costs Units per Employee Dock to Dock Material Flow Cross Training High Quality Parts Lowest Overall VS Material Costs Reliable Suppliers Selected Suppliers with Long Term Relationship Certified Suppliers Delivery Quality Reliability More Use of Common Parts Work with suppliers to reduce costs. Long term Agreements Pull Delivery Systems Simple Receiving & Quality Transactions Supplier First Time Through On Time Delivery % parts on Pull, Certified Supplier, & Long Term Contract # kaizens between ATK & supplies # Material Receipt, Quality & AP Transactions Q D Q D C Q D C Q D C E Employees Engaged in CI Versatile Buyers Cross Training Buyers Cross Training Chart 23 E
26 Strategic and NPD Value Streams Measurements STRATEGIES Increase Sales & Market Share Increase Cash Flow & Reduce Debt Create Culture of fcontinuous STRATEGIC VALUE STREAM VALUE STREAM MEASUREMENTS GOALS MEASUREMENTS Sales Growth Cash from Operations Customer Satisfaction Inventory Days or Turns Sales per Employee Suggestions per Person % People Engaged in Introduce High Value Products Short & Reliable Product Design Processes Match Products to Value Stream Capabilities Improve Productivity Create Unique & Innovative Products Increase CI Project Participation Provide Advancement for Employees Sales from New Products On-Time Design Projects Customer Satisfaction with New Products Profitability of Order Fulfillment Value Streams Value Stream Cost per New Product Sales $ Number of Patents & Innovations # People on Teams Cross Training per Person Maintain Stable & Educated Workforce Annual Employee Survey Eliminate Accidents & Injuries Number of Accidents & Injuries 24
27 Lean Performance Measurements Challenge: Replace the traditional cost accounting measurements with performance measurements that are designed to motivate and monitor lean behavior. Develop a set of measurements throughout h t the organization that thoroughly reflect the company s strategy and goals. As people work to improve the measurement results, they will be actively working to achieve the company s strategic goals. 25


28 BMA Inc. 100 Springdale Road, Cherry Hill NJ USA 26
29 27