OBA Outcomes-Based Accountability
|
|
|
- Jeffrey Simpson
- 5 years ago
- Views:
Transcription
1 OBA Outcomes-Based Accountability The Fiscal Policy Studies Institute Book - DVD Orders amazon.com clearimpact.com

2 Fiscal Policy Studies Institute Headquarters
3 SIMPLE COMMON SENSE PLAIN LANGUAGE MINIMUM PAPER USEFUL
4 Outcomes-Based Accountability is made up of two parts: Population Accountability about the well-being of WHOLE POPULATIONS For Communities Cities Counties States - Nations Performance Accountability about the well-being of CUSTOMER POPULATIONS For Services Agencies and Service Systems
5 Results-Based Accountability COMMON LANGUAGE COMMON SENSE COMMON GROUND
6 COMMON LANGUAGE
7 THE LANGUAGE TRAP Too many terms. Too few definitions. Too little discipline Outcome Benchmark Result Indicator Modifiers Measurable Core Urgent Qualitative Priority Programmatic Targeted Performance Incremental Strategic Systemic Goal Measure Target Objective Lewis Carroll Center for Language Disorders Measurable Core Your qualitative made urgent strategic up systemic jargon objectives here indicators
8 Performance Population DEFINITIONS OUTCOME or RESULT 1. A condition of well-being for children, adults, families or communities. Children born healthy, Children ready for school, Safe communities, Clean Environment, Prosperous Economy INDICATOR or BENCHMARK 2. A measure which helps quantify the achievement of an outcome. Rate of low-birthweight babies, Percent ready at K entry, crime rate, air quality index, unemployment rate PERFORMANCE MEASURE 3. A measure of how well a program, agency or service system is working. Three types: 1. How much did we do? 2. How well did we do it? 3. Is anyone better off? = Customer Outcome
9 Performance Population From Ends to Means From Talk to Action From Talk to Action Population RESULT ENDS INDICATOR PERFORMANCE MEASURE Customer result = Ends Service delivery = Means MEANS
10 RESULT INDICATOR PERF. MEASURE RESULT INDICATOR RESULT INDICATOR PERF. MEASURE IS IT A RESULT, INDICATOR OR PERFORMANCE MEASURE? 1. Safe Communities 2. Crime rate 3. Average police response time 4. People are physically & mentally healthy 5. Rate of heart disease 6. People have living wage jobs and income 7. % of people with living wage jobs and income 8. % of participants in job training who get living wage jobs
11 POPULATION ACCOUNTABILITY
12 1. A Safe City Community Outcomes for Christchurch, NZ 2. A City of Inclusive and Diverse Communities 3. A City of People who Value and Protect the Natural Environment 4. A Well-Governed City 5. A Prosperous City 6. A Healthy City 7. A City for Recreation, Fun and Creativity 8. City of Lifelong Learning 9. An Attractive and Well-Designed City
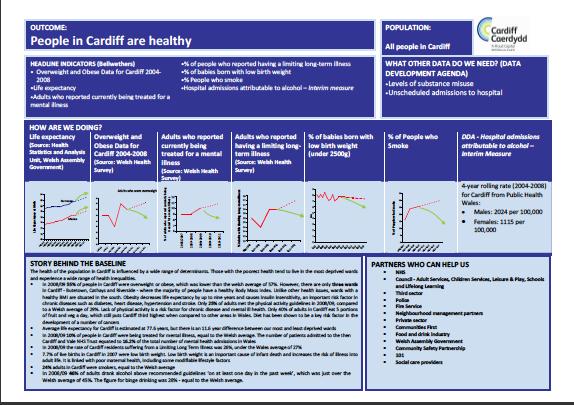
13 CARDIFF, WALES Community Outcomes 1. People in Cardiff are healthy 2. Cardiff has a clean attractive and sustainable environment 3. People in Cardiff are safe and feel safe 4. Cardiff has a thriving and prosperous economy 5. People in Cardiff achieve their full potential. 6. Cardiff is a great place to live, work and play. 7. Cardiff has a fair, just and inclusive society.
14 Draft Programme for Government We prosper through a strong, competitive, regionally balanced economy 2 We live and work sustainably protecting the environment 3 We have a more equal society 4 We enjoy long, healthy, active lives 5 We are an innovative, creative society, where people can fulfill their potential 6 We have more people working in better jobs 7 We have a safe community where we respect the law, and each other 8 We care for others and we help those in need 9 We are a shared society that respects diversity 10 We are a confident, welcoming, outward-looking society 11 We give our children and young people the best start in life 12 We have high quality public services 13 We have created a place where people want to live and work, to visit & invest 14 We connect people and opportunities through our infrastructure


15 New Zealand Santa Cruz County Cardiff, Wales Kruidenbuurt Tilburg, Netherlands
16
17
18

19
20
21 Leaking Roof (Outcomes thinking in everyday life) Experience Measure Inches of Water BASELINE Not OK? Fixed Turning the Curve Story behind the baseline (causes) Partners What Works Action Plan #2
22 Outcomes Experience Indicators Baseline & Story
23 Criteria for Choosing Indicators as Primary vs. Secondary Measures Communication Power Does the indicator communicate to a broad range of audiences? Proxy Power Does the indicator say something of central importance about the result? Does the indicator bring along the data HERD? Data Power Quality data available on a timely basis.
24 Choosing Indicators Worksheet Outcome or Result Safe Community Candidate Indicators Communication Power Proxy Power Data Power Measure 1 H M L H M L H M L Measure 2 Measure 3 H H H Measure 4 Measure 5 H H L Measure 6 Measure 7 Data Development Measure 8 Agenda
25 Three Part Indicator List for each Result Part 1: Primary Indicators 3 to 5 Headline Indicators What this result means to the community Meets the Public Square Test Part 2: Secondary Indicators Everything else that s any good (Nothing is wasted.) Used later in the Story behind the Curve Part 3: Data Development Agenda New data Data in need of repair (quality,timeliness etc.)
26 The Matter of Baselines H M OK? L History Point to Point Forecast Turning the Curve Baselines have two parts: history and forecast
27 Alcohol-Related Traffic Fatalities United States 1975 to people per day 45 people per day Thousands MADD people per day Source 1982 to 2005: Actual data from the NHTSA Fatality Analysis Reporting System (FARS) Source 1975 to 1981: Estimate based on NHTSA data on % of fatality drivers with BAC of.10 or greater. 2010

28
29 Rebound


30 Newcastle, UK 20.00% 18.00% 16.00% 14.00% 12.00% 10.00% 8.00% 6.00% Ncle Nov 08 Jan Revised 9 Nov 2007 Source: Connexions Tyne and Wear, UK
31
32 If I include you, you will be my partner. If I exclude you, you will be my judge. - Rosell
33 PERFORMANCE ACCOUNTABILITY
34 Outcomes-Based Accountability is made up of two parts: Population Accountability about the well-being of WHOLE POPULATIONS For Communities Cities Counties States - Nations Performance Accountability about the well-being of CUSTOMER POPULATIONS For Services Agencies and Service Systems
35 PERFORMANCE ACCOUNTABILITY
36 All Performance Measures that have ever existed for any service in the history of the universe involve answering two sets of interlocking questions.
37 Service Performance Measures Quantity Quality How Much did we do? ( # ) How Well did we do it? ( % )

38 Performance Measures Effort How hard did we try? Effect Is anyone better off?
39 Service Performance Measures Effort How Much How Well Effect
40 Output Input Effect Effort Service Performance Measures Quantity Quality How much service did we deliver? How well did we deliver it? How much change / effect did we produce? What quality of change / effect did we produce?
41 Effect Effort Service Performance Measures Quantity Quality How much did we do? How well did we do it? Is anyone better off? # %
42 Effect Effort Education Quantity How much did we do? Quality How well did we do it? Number of students Student-teacher ratio Is anyone better off? Number of 16 olds with 5 A to C GCSE s Number with good school attendance Percent of 16 yr olds with 5 A to C GCSE s Percent with good school attendance
43 Effect Effort Drug/Alcohol Treatment Program Quantity How much did we do? Quality How well did we do it? Number of persons treated Percent of staff with training/ certification Number of clients off of alcohol & drugs - at exit - 12 months after exit Is anyone better off? Percent of clients off of alcohol & drugs - at exit - 12 months after exit
44 Effect Effort Waste Management Services Quantity How much did we do? Quality How well did we do it? # tonnes of residential waste Unit cost per tonne collected Is anyone better off? #/amt to land fill #/amt diverted from landfill % to land fill % diverted from landfill
45 Home Care Services How much did we do? # of persons served # visits How well did we do it? # visits per week Ave length of visit % service users who say the service is reliable, flexible, respectful, friendly (SPRU)) Is anyone better off? # entry into hospital, residential or nursing care # carers report the service helped the service user remain at home Rate entry into hospital, residential or nursing care % carers report the service helped the service user remain at home Social Policy Research Unit Leeds University
46 Effect Effort Fire Department Quantity How much did we do? Quality How well did we do it? Number of responses Response Time Is anyone better off? # of fires kept to room of origin % of fires kept to room of origin
47 Not All Performance Measures Are Created Equal Effect Effort Quantity How much did we do? Quality How well did we do it? Least Important Also Very Important Is anyone better off? Most Important
48 Effect Effort The Matter of Control Quantity How much did we do? Quality How well did we do it? Most Control Is anyone better off? Least Control PARTNERSHIPS
49 Advanced Baseline Display Create targets only when they are: FAIR & USEFUL Goal (line) Target or Standard Aspiration NOT Punishment Your Baseline Avoid publicly declaring targets by year if possible. x Comparison Baseline Instead: Count anything better than baseline as progress.
50 Performance Accountability Types of Measures found in each Quadrant How much did we do? # Clients/customers served # Activities (by type of activity) # # # # Is anyone better off? Point in Time vs. 2 Point Comparison How well did we do it? % Common measures e.g. client staff ratio, workload ratio, staff turnover rate, staff morale, % staff fully trained, % clients seen in their own language, worker safety, unit cost % Activity-specific measures e.g. % timely, % clients completing activity, % correct and complete, % meeting standard % Skills / Knowledge (e.g. parenting skills) % Attitude / Opinion # % (e.g. toward drugs) % Behavior (e.g.school attendance) % Circumstance (e.g. working, in stable housing)
51 Service: School Hospital Job Training Fire Department How much did we do? Primary customers # students patients persons trained Primary activity # job hours diagnostic alarms courses of tests instruction responded to How well did we do it? Unit cost Workload ratio % of x that happen on time Is anyone better off? If your service works really well, how are your customer's better off? # % fires patients persons students kept who to room fully get of recover jobs graduate origin
52 Primary v. Secondary Direct v. Indirect LR Internal v. External UR Baseline & Story
53

54

55
56
57 How Population & Performance Accountability FIT TOGETHER
58 THE LINKAGE Between POPULATION and PERFORMANCE POPULATION ACCOUNTABILITY Healthy Births Rate of low birth-weight babies Children Ready for School Percent fully ready per K-entry assessment Self-sufficient Families Percent of parents earning a living wage PERFORMANCE ACCOUNTABILITY Job Training Program POPULATION OUTCOMES Contribution relationship Alignment of measures # persons receiving training Unit cost per person trained Appropriate responsibility # who get living wage jobs % who get living wage jobs CUSTOMER OUTCOMES
59 1. Data Different Kinds of Progress a. Population indicators Actual turned curves: movement for the better away from the baseline. b. Service performance measures: customer progress and better service: How much did we do? How well did we do it? Is anyone better off? 2. Accomplishments: Positive activities, not included above. 3. Anecdotes: Stories behind the statistics that show how individuals are better off.
60 Board of Directors Meeting AGENDA 1. New data 2. New story behind the curves 3. New partners 4. New information on what works. 5. New information on financing 6. Changes to action plan and budget 7. Adjourn
61 SUMMARY
62
63 OBA in a Nutshell kinds of accountability Population accountability Performance accountability 3 - kinds of performance measures. How much did we do? How well did we do it? Is anyone better off? plus language discipline Outcomes & Indicators Performance measures 7 - questions from ends to means in less than an hour. Baselines and Turning the Curve
64 If you do what you always did, you will get what you always got. Kenneth W. Jenkins President, Yonkers NY NAACP
65 We will succeed together or fail separately. - Winston Churchill or - Sonny and Cher
66 THANK YOU!! The Fiscal Policy Studies Institute Book - DVD Orders amazon.com clearimpact.com