Wake Wellness Strategies: Employee Health Center. NC Budget Conference July 9, 2015
|
|
|
- Eric Phillips
- 5 years ago
- Views:
Transcription


1 Wake Wellness Strategies: Employee Health Center NC Budget Conference July 9,
2 Presentation Overview Overview at Health Insurance and Wellness in Wake County Why an Employee Health Center? Marathon Health Who they are and what they do Health Center Results to Date 2
3 Wake County Health Insurance $34 million annual expenditures 3,375 actives, 988 retirees Philosophy on Medical Plan Premiums Strategically shift costs to drive desired behaviors and those who use more pay more through plan design changes rather than everyone paying through higher premiums Past two years, did not increase employee premiums 3
4 Employee Wellness at Wake County Major Programs: Know Your Numbers ( KYN ) Employees, covered spouses and retirees must do an annual biometric screening or pay $20 more per month per adult not in compliance Before KYN, less than 50% of employees had an annual doctor visit; percentage is now at 94% Diabetes Management Program Participants receive free supplies for program participation; diabetes no longer in the Top 10 diseases Employee Health Center 4
5 Why an Employee Health Clinic Center? Name was important Not just a clinic services much broader Reasons for: Improves employee health Provides an easy way for employees to access health and wellness services Improves productivity Reduces absenteeism/presenteeism Provides personalized disease management Reduces medical costs 5

, Preventive, Living Well At Work 6")
6 Disease Management Opted out of BCBS disease management programs; not cost effective; not widely used Center will provide this in a more personalized and effective approach via engagement Compliments our wellness strategy i.e.. Know Your Numbers (KYN), Preventive, Living Well At Work 6
7 Why Will Employees Use It? They told us they would in 2012 survey Easy access to services Saves time The clinic is free no copays No leave time usage required for center appointments Two strategically chosen locations in close proximity to more than 50% of employees 7
8 Our Baseline: How Many and Who? 3,331 EE currently covered under medical plan 2012 office visits = 47,099 (3,252 exam/biometric) 2012 survey indicated 85% of respondents will use clinic (1,316) 2012 Know Your Numbers = 91.3% completed (2,976 EE) 15 patients per day; 3,900 per year Employees covered under medical plan Pre-65 retirees 8
9 Top Risk Factors Risk Factor/Chronic Condition Data Source # of EE's with risk factor / disease Sample Size Wake County 2014 U.S. Prevalence Rate Obesity Screening % 33.8% Inadequate Sleep HRA % 30.4% High Stress Levels HRA % 10.0% Work-Loss Days HRA % 20.0% Physical Inactivity HRA % 36.2% High Cholesterol Screening % 16.3% Tobacco Use HRA % 20.6% High Blood Pressure/Hypertension Screening/Claims % 29.9% Life Dissatisfaction HRA % 5.0% Asthma Claims/Health Center % 8.4% Job Dissatisfaction HRA % 55.0% Chronic Bronchitis (COPD) Claims/Health Center % 4.0% High Blood Sugar/Diabetes Screening/Claims % 7.8% Coronary Artery Disease (CAD) Claims/Health Center % 4.9% Alcohol Abuse HRA % 8.5% Perception of Health HRA % 10.0% No Seat Belt Use HRA % 15.0% Congestive Heart Failure (CHF) Claims/Health Center % 1.8% Status Top Risks Identified: Obesity Inadequate Sleep High Stress *************************** Other Areas of Concern Work Loss Days Physical Inactivity High Cholesterol As of June 30,
10 RFP Process Committee: Community Services (1),County Manager Office (1), EMS (1), Facilities, Design & Construction(1), GSA (1), Human Resources (3), Human Service (ERC, NRC & Public Health) (4) Seven Responses Evaluated by Committee Short-listed to Three Finalists for Presentations and Second Ranking 10
11 Why Marathon? Model long-term improved health management Health Management Approach uses evidence based clinical decision support tools and a patient centered focus Engagement through Motivational Interviewing fits well with County s wellness philosophy and does not require biometrics for successful interactions One-on-one employee coaching with understanding of readiness to change Excellent reporting tools for evaluating cost / benefit analysis 11
12 12

13 13 2/22/
 14")
14 Return On Investment Customer Satisfaction annual survey Employee s Improved Health use baseline after one year measure standard outcomes Redirection of PCP Visits to Clinic Wake County s unit cost PCP visit compared to actual visits to clinic (reported to us every month) 14
15 What About Employees That Aren t Near a Clinic? Some employees are too far from clinic Some may not take advantage of the clinic All employees will have access to an employee health portal (web based) Free, easy to use tool to help individuals learn more about their health and how they can improve 15


16 ehealth Portal Home Page Benefits One-stop HHRA, health content, and tools Monthly health themes Easy access to Wellness Library Security protected health information and messaging Features Personal Health Record Complete clinical documentation Problem Knowledge Couplers 16
17 Implemenation Timeline March - County Senior Management Team approved moving forward with Center April - BOC approved multi-year contract May/June Finalize Contract with Vendor July/August/September - Implementation, Communication, Center Open House October 2013 First Center opens February 2014 Second Center opens Both Center combined- 40 hours per week 17
18 Workforce Health Services July 9, 2015
19 Today s Topics Marathon Health Overview Background and Differentiators Pricing Model and Performance Guarantees Case Studies/ Customer Results 19
20 Our Mission We are a different kind of healthcare company. Our mission is to inspire people to lead healthier lives. In turn, we help employers stabilize healthcare costs. It s a simple equation that yields powerful results. Healthier people cost less, are more productive, and lead richer more rewarding lives. 20

21 Marathon Nation We are Ambassadors 400 Ambassadors in 35 States serving 180,000+ patients; 69 clients in 77 health centers and in 50+ additional coaching locations. 277 customer clinical team members 21 MDs, 82 NPs, 24 PAs, 34 RNs, 90 MAs, 8 LPN/LVNs, 12 PSSs, 3 RDs, 2 CMs, 1 PT 21
22 Marathon Health What Makes Us Different Population Health Management Not an Onsite Clinic Focus on identifying and managing health risks vs. traditional sick care How We Do What We Do We develop connections that get people to opt-in Customer service agility -- responsible, flexible, passionate Experience Multiple successful transitions from other vendors Continuous focus not only on best practices, but next practices Cultural Match/Shared Beliefs with our Customers 22


23 Shared Missions and Fit


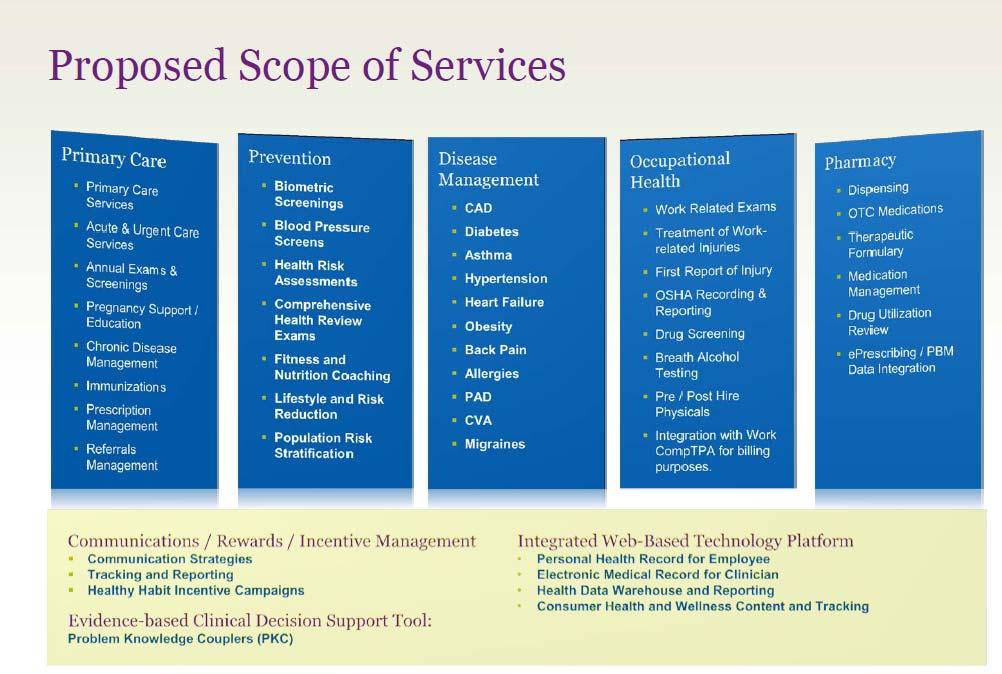
24 Marathon Health Scope of Services Interface / Integrate with Existing Programs 24


25 Capturing Value in Population Health Management Primary Care/Occupational Health/Onsite Rx 25

26 Pricing Model and Performance Guarantees 26
27 Protecting Your Annual Budget Fixed Fee Approach not cost plus arrangement Marathon Health assumes risk for variances in utilization and cost Fees Guaranteed Based on +/- 10% of Quoted Enrollment All Staffing Costs salary, benefits, vacation, insurance, etc. All Medical and Office Supplies Member & Clinical Health Portal Fully Integrated EMR/PHR/HHRA Evidence-based clinical decision support (Problem Knowledge Couplers) Consumer Health Content & Incentive Campaign Tracker Communications and Reporting Packages Fees Typically Exclude: Cost of mass biometric screenings US Wellness or other vendor Cost of medications dispensed onsite and vaccines, if included in program 27

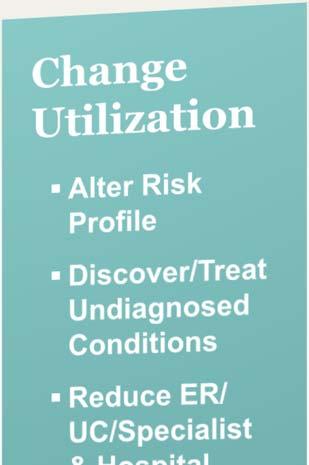
28 Reporting and Analytics Step 1: Risk ID Step 2: Engagement Step 3: Reduce Risk 28


29 Wellness Center Utilization: Addressing Key Risk Factors Top 10 Diagnoses in Top Risks Initially Identified Hypertension / HBP Inadequate Sleep High Cholesterol High Blood Sugar / Diabetes Coronary Artery Disease (CAD) 29


30 Patients Making Progress on Risk Factors
31 Three Year Prevalence Trends for Key Risk Factors Longitudinal Matched Cohort Analysis 50% 45% 40% 35% 30% 25% 20% Systolic BP > 140 Diastolic BP > 90 Total Cholesterol > 200 BMI > 30 15% 10% 5% 0% Year 1 Year 2 Year 3 N= HTN 654, TC 1,112, BMI 1,536 31
32 Book of Business Results 0.1 Year Over Year Medical Claims Trend, Pre and Post Go- Live % % 2.09% % -1.78% -0.1 Baseline claims trend (multi-year) -8.90% Y1 vs Baseline Y2 vs Y1 Y3 vs Y2 Y4 vs Y3 Y5 vs Y4 Clients with > 50% screening rate


33 Six-Year Claims Trend Analysis: Plantation, FL High Cost Claimants > $50K Removed Go-Live Five year savings $10.6M; 3.6:1 ROI 33

 ROI = 1.9:1 $0.")
34 Claims (Med+Rx) - Lexington, SC excluding Spec Reimbursements>$100k Projection based on 9.0% inflation rate Go Live Mar 14-Feb 15 = $1.3M under projection (gross savings) ROI = 1.9:1 $0.6M Net Savings Rx spend includes costs of Rxs dispensed in health center. 34


35 Total Claims through Sept 2014 Wake County Projection based on 9.0% inflation rate $2.4M below projection ROI 5.8:1 (through 11 months) Go Live 35
36 Patient Outcomes vs. Triple Aim Targets Triple Aim Metrics --- Run: 11/4/2014 Customer : Academic Medical Center-- Employees Only Time Frame: 5/1/2013 Thru: 10/31/ Biometric Category Will achieve the following Results Patients Outside of Normal Range Patients Meeting Criteria % of Patients Successful Target Target Year 3 Systolic Blood Pressure (> 140) Reduce by 12 mmhg or below threshold % 35.0% 40.00% Diastolic Blood Pressure (> 90) Reduce by 5 mmhg or below threshold % 35.0% 40.00% Glucose (> 100) Reduce by 15% or below threshold % 13.0% 15.00% Total Cholesterol (> 200) Reduce by 10% or below threshold % 13.0% 15.00% LDL Cholesterol (> 160) Reduce by 10% or below threshold % 13.0% 15.00% HDL Cholesterol (< 40) Increase by 10% or above threshold % 13.0% 15.00% Triglycerides (> 200) Reduce by 20% or below threshold % 13.0% 15.00% Overweight/Obesity (> 24.9) Reduce weight by 5% or BMI below threshold % 4.0% 5.00% Smokers Quit for at least 90 days % 4.0% 5.00% Participants Under our care with the following conditions Will achieve the following results Patients with Condition Patients Meeting Criteria % of Patients Successful Target Target Year 3 Diabetics Average Hemoglobin A1C < % 12.5% 15.00% Diabetics Standard of Care (4 out of 5) * Annual Foot Exam * Annual Eye Exam * Annual Influenza % 75.0% 75.00% * Pneumococcal at least once * Self Glucose Monitoring or A1c Exists Asthmatics Standard of Care (4 out of 5) * Annual Influenza * Pneumococcal at least once * Use of Inhaled Corticosteroids * Asthma Action Plan * Use of short acting bronchodilator % 75.0% 75.00% 36
37 Results To Date A progress report 37 37
38 Monthly Visits to Center October 2014 Know Your Numbers Deadline spike in Labs March 2015 Opened both centers for 40 hours per week Total Coach & Acute for 12 months 2,845 encounters; 1014 unique patients (about 30% of employees) 38
39 Health Improvement Patients Making Progress Toward Normal Range (NR) Biometric Category Initial Pts Outside of NR Pts Who Made Progress Toward NR % of Inital Body Mass Index (< 18.5, > 24.9) % Systolic Blood Pressure (> 120) % Diastolic Blood Pressure (> 80) % Glucose (> 100) % Total Cholesterol (> 200) % LDL Cholesterol (> 129) % HDL Cholesterol (< 40) % Triglycerides (> 150) % Unique Patients % 39
40 Cost Savings Reports YTD Savings From Operations - Beginning 6/1/2014 Category Volume Unit Cost Savings Predictive Impact on Medical Costs YTD Redirected Care 2754 $86 $236,378 Rx Savings From Risk Mitigation 1087 $58 $62,655 Emergency Room Visits Avoided 34 $1,922 $65,362 Specialty Care Visits Avoided 1344 $140 $187,878 Radiology 24 $520 $12,478 Physical Therapy Savings From Risk Mitigation 10 $401 $4,005 Hospital Inpatient 4 $17,630 $70,518 Hospital Outpatient 53 $989 $52,405 YTD Sub Total Medical $691,678 Predictive Impact on Payroll & Productivity Medical cost reduction for DART injuries 3 $27,729 $83,188 Presenteeism 839 $572 $480,143 Saved time away from work 2728 $74 $202,581 Work Loss Days 311 $231 $71,754 Indirect Cost for Injuries 3 $28,775 $86,324 Turnover Reduction 3 $61,787 $185,360 YTD Sub Total $1,109,351. TOTAL SAVINGS $1,801,029 40


41 Please rate your overall satisfaction with the services: respondents. 74% have been to the center. 41
42 How satisfied were you with the following characteristics of the Marathon Health staff? Average Rate, 5 is Highest 42 42


43 How quickly were you able to get an appointment? If you weren't able to be seen at the Wake Employee Health Center, did you see another provider? 43
44 In Summary Health Center has been very successful Employees view it as a significant benefit Health is improving which should yield lower health care costs County is experiencing medical plan savings from redirected care Independent provider was important perceived as a greater protection of privacy Choosing the right provider is key and it is critical to link them with all other health care vendors 44