FINAL REPORT. Survey of Scottsbluff Area Businesses about Skill and Training Requirements
|
|
|
- Gilbert Harrington
- 5 years ago
- Views:
Transcription

1 A Bureau of Business Research Report From the UNL College of Business FINAL REPORT Survey of Scottsbluff Area Businesses about Skill and Training Requirements Prepared for The Nebraska Department of Labor Prepared by Eric Thompson, Associate Professor of Economics, and Director, Bureau of Business Research, Jennifer Bernard, Graduate Research Assistant & Alex Johnson, Undergraduate Research Assistant June 16, 2016 Bureau of Business Research Department of Economics College of Business Administration University of Nebraska-Lincoln Dr. Eric Thompson, Director
2 EXECUTIVE SUMMARY This report discusses results from the Scottsbluff Survey of Hiring and Training Needs conducted by the Nebraska Department of Labor and supported by the Nebraska Department of Economic Development. The report examines employer satisfaction with their current workforce, the types of occupations Scottsbluff area employers are searching for and hiring, and the types of difficulties employers face when hiring. The Scottsbluff area includes nine counties in the Panhandle region of Nebraska, including Banner, Box Butte, Cheyenne, Dawes, Kimball, Morrill, Scotts Bluff, Sheridan and Sioux counties. The survey also asks about the types of training which employers provide. Businesses express a fair degree of satisfaction with their current workforce, although concerns are raised about employee leadership, work ethic and an ability to pay attention to detail. While half of employers are somewhat or very concerned about replacing retiring workers, most firms have taken steps or planned to take steps to ease these transitions, through a mix of training and promoting from within or hiring new workers. Seventy-four percent of employers report that it is difficult to hire workers. The percentage is even higher in blue collar occupations such as installation, maintenance and repair workers, production workers, and transportation and material moving workers. The percentage is also elevated in other select occupations, including health care practitioners and technical support workers, business and financial operations workers, computer and mathematical workers, and personal care and service workers. The primary reason it is difficult to hire is a lack of applicants. More than three in four businesses report that there are too few applicants. In select occupations there also is a significant problem with finding workers who are able to work during required shifts. Employers also have concerns about the applications they do receive. More than one half of employers (53.8%) indicate that it is difficult to hire because applicants lack work experience. Among other difficulties, 43.8 percent of employers report that applicants lack occupationspecific skills and a similar share (44.2%) that applicants have a poor work history. About onequarter of employers report applicants have wage demands which are too high. A lack of occupation-specific skill is a particular concern for two white collar and two blue collar occupations. Among white collar workers, the two occupations are computer and mathematical workers and business and financial operations workers. Among blue collar workers, the two occupations are construction and extraction workers and installation, maintenance and repair workers. These results suggest that training course should be made available to prepare workers for these occupations. Workers in blue collar occupations also would benefit from formal apprenticeship programs or learning on the job through periods of work as helpers or in other support occupations. i
3 Poor work history and failed background checks also are common concerns for selected service and blue collar occupations, including health care support workers, construction and extraction workers, and transportation and material moving workers. This suggests a need to design and encourage pathways and practices whereby workers can improve their work history and address issues which are checked on background. Wage rates also appear to be a barrier to hiring in the personal care and service occupation, the construction and extraction occupation and the transportation and material moving occupation. In these occupations, employees, employers, or both need to adjust their wage expectations. With regards to training, employers report that they provide job-specific training to newly hired workers in 87.6 percent of occupations. Of businesses which provide training, most provide individual training courses or a certification program. The vast majority of employers also provide on the job training; for example, by pairing new workers with a more experienced employee or a supervisor. Individual training course are slightly less common in blue collar occupations while full certification courses are most common for health care support occupations, installation, maintenance and repair occupations, and computer and mathematical occupations. ii
4 TABLE OF CONTENTS Executive Summary... i 1. Introduction Details of the Business Survey Results of the Survey... 7 Hiring Workers... 7 Replacement of Retiring Workers Difficulties Finding Workers Worker Training Existing Workers Profile of Selected Occupations Conclusion Appendix Appendix 1: Scottsbluff Survey of Hiring and Training Needs Appendix 2: About the Bureau of Business Research and Key Personnel iii
5 LIST OF FIGURES AND TABLES Figure 1.1: Would Issues with Labor Availability such as Difficulty Finding Workers, or a Need to Raise Wages, Be Present?... 2 Figure 1.2: Would Issues with Labor Availability Limit Your Ability to Expand?... 2 Figure 1.3: Would Issues with Labor Availability Limit Your Ability to Expand by Type of Industry... 3 Table 2.1: Profile of Responding Businesses... 5 Table 2.2: Employment Characteristics of Responding Businesses... 6 Figure 3.1: When Hiring, How Much Does Your Business Consider Whether an Applicant is Currently Working?... 7 Figure 3.2: When Hiring, What is Your New Worker's Experience in Your Industry?... 8 Figure 3.3: When Hiring, What is Your New Worker's Experience in Your Occupation?... 9 Table 3.1: Overall Competency of Typical Applicant Pool for Specific Skills Figure 3.4: Percent of Applicant Pool Ranked "Less Than Adequate" by Industrys Figure 3.5: Percent Concerned About Potential Loss of Skills and Experience from Retiring Workers Figure 3.6: How Businesses are Addressing the Potential Skill Gaps that May Occur as Workers Retire.. 13 Figure 3.7: Is it Difficult to Find Workers? Figure 3.8: Is it Difficult to Find Workers? Percent Yes by Industry Figure 3.9: Is it Difficult to Find Workers? Percent Yes by Occupation Figure 3.10: Why is it Difficult ot Find Workers? Table 3.2: Why is it Difficult ot Find Workers by Industry? Table 3.3: Why is it Difficult ot Find Workers by Occupation? Figure 3.11: Is Job-Specific Training Provided to New Workers? Figure 3.12: Share of Occupations Where Out-of-House Training is Provided by Industry Figure 3.13: Share of Occupations Where Out-of-House Training is Provided by Occupation Figure 3.14: Type of Training Provided Table 3.4: Type of Training by Industry Table 3.5: Type of Training by Occupation Figure 3.15: Percentage Reporting Skill Deficiencies are Present for the Majority of Current Workforce 28 Figure 3.16: Percentage of Full-Time Workers Eligible for Benefits Figure 3.17: Percentage of Part-Time Workers Eligible for Benefits Figure 4.1: Computer Programmers and Developers ( , , , Figure 4.2: Computer and Network Support Specialists ( , ) Figure 4.3: Registered Nurses ( ) iv
6 Figure 4.4: Licensed Practical Nurses ( ) Figure 4.5: Nursing Assistants ( ) Figure 4.6: Crew Member, Food Truck, Porter ( ) Figure 4.7: Retail Salesperson ( ) Figure 4.8: Heavy and Tractor Trailer Truck Drivers ( ) Figure 4.9: Loaders, Experienced Equipment Operators, Warehouse Labor ( ) v
7 1. INTRODUCTION This report discusses the results from a survey of employers in the Scottsbluff area entitled the Scottsbluff Survey of Hiring and Training Needs. This survey was conducted by the Nebraska Department of Labor under contract with the Nebraska Department of Economic Development. Responses are analyzed by the UNL Bureau of Business Research. Specifically, this report examines the types of occupations Scottsbluff area employers are searching for and hiring, and the types of degrees, certifications, and skills that the employers require. The Scottsbluff area include nine counties in the Panhandle region of Nebraska, including Banner, Box Butte, Cheyenne, Dawes, Kimball, Morrill, Scotts Bluff, Sheridan and Sioux counties. The survey identifies occupations where employers have difficulty hiring and the types of difficulties encountered. The survey asks about the types of training which employers provide. The report is organized as follows. The survey process is discussed in Section II. Section III describes the results of the survey. Section IV provides a profile of the top hiring occupations, that is, the occupations which employers are most commonly hiring. Section V is the conclusion. The survey instrument is provided in Appendix 1 and information about the UNL Bureau of Business Research and the project Principal Investigator is provided in Appendix 2. Before turning to the survey methodology, several key results are presented below. These results show the importance of labor force issues and the challenges presented to businesses facing expansion. Figure 1.1 shows the role of worker availability in economic development. Specifically, the Scottsbluff Survey of Hiring and Training Needs asked employers the following question: If asked to consider a possible major expansion at this location, would issues with labor availability such as difficulty finding workers, or a need to raise wages, be present? The responses, both overall and by industry, are revealing. A majority of businesses (54.1%) reported that issues with labor availability would be present in the Scottsbluff area if they were asked to consider an expansion. Another quarter of businesses suggested that availability issues might be present (27.9%). Only 18.0 percent reported that they would labor availability issues. Those that answered Yes or Maybe to the previous question were also asked specifically about labor availability. Nearly half (47.3%) of respondents reported that labor availability would limit their ability to expand at their present location (Figure 1.2). 1
8 Figure 1.1: Would labor availability be an issue for a major expansion? 60.0% 54.1% 50.0% 40.0% 30.0% 27.9% 20.0% 18.0% 10.0% 0.0% No Maybe Yes Source: UNL-BBR calculations based on the Scottsbluff Survey of Hiring and Training Needs 50.0% 40.0% Figure 1.2: Would issues with labor availability limit your ability to undertake a major expansion at this location? 41.3% 47.3% 30.0% 20.0% 10.0% 11.4% 0.0% No Maybe Yes Source: UNL-BBR calculations based on the Scottsbluff Survey of Hiring and Training Needs Results also can be broken out for the manufacturing industry, a nationally competitive sector with potential to expand wherever business conditions are most favorable. As seen in Figure 1.3, results for the manufacturing industry are similar to results for all industries, which were presented in Figure 1.2. One-half of manufacturing businesses would be limited in their ability to expand, while 35 percent indicated labor availability might limit expansion and 15 percent indicated expansion would not be limited. 2
9 60.0% 50.0% 40.0% Figure 1.3 Would issues with labor availability limit your ability to undertake a major expansion at this location? (Manufacturing Businesses) 35.0% 50.0% 30.0% 20.0% 15.0% 10.0% 0.0% No Maybe Yes Source: UNL-BBR calculations based on the Scottsbluff Survey of Hiring and Training Needs These results demonstrate the need for the current report. Challenges with finding labor are not just an operating concern for business; it is a factor which is impacting economic development in the Scottsbluff area. This creates a need to develop a detailed understanding of the labor needs of Scottsbluff area businesses, and the challenges these business face in recruiting workers. The report will address the variety of issues faced by Scottsbluff area businesses. We begin by discussing the Scottsbluff Survey of Hiring and Training Needs which is the source of this data. 3
10 2. DETAILS OF THE BUSINESS SURVEY The Scottsbluff Survey of Hiring and Training Needs of employers was designed to gather detailed information on the hiring and training needs and priorities of Scottsbluff area businesses. That information is gathered through a series of questions which examine business preferences for hiring, hiring challenges, key hiring needs, education and training requirements and plans for training new hires. A copy of the Scottsbluff Survey of Hiring and Training Needs is in Appendix 1. The survey was developed in conjunction with the Nebraska Department of Labor (NDOL) and the Nebraska Department of Economic Development (NEDED). The survey was administered by the Nebraska Department of Labor. The survey begins by asking some basic questions about the employment conditions at each establishment such as the age of the business, the share of part- and full-time employees, the share of seasonal employees, the current number of job openings, and preferences for hiring workers in the same occupation and industry. The initial section of the survey also asks about the role of labor availability in potential expansion, gathering the types of information displayed in Figures 1.1 through 1.3. It also asks about the overall competency of the typical applicant pool. Section one concludes with several questions addressing potential issues with a loss of skills or experience from workers retiring. The second section of the survey asks detailed questions about the three most common occupations that each firm is trying to hire or hired recently. Respondents are asked to name and describe each occupation, report average starting wage, minimum required education, licenses and certificates, whether and where training is provided for new employees, whether it is difficult to find workers for the occupation and why. Businesses are also invited to name any other occupations where it is difficult to hire workers. The survey concludes by asking businesses about their current employees including overall skill level and benefits provided. The survey was mailed to all businesses with 10 or more employees in the Scottsbluff area (Banner, Box Butte, Cheyenne, Dawes, Kimball, Morrill, Scotts Bluff, Sheridan and Sioux counties in Nebraska). The Nebraska businesses were taken from the 1st Quarter 2015 NDOL Quarterly Census of Employment and Wages. The list of businesses was cleaned to remove duplicate businesses at the same address to ensure each business only received one survey. The final survey list included 549 establishment locations throughout the 9 Nebraska counties listed above, although the majority (281 of 549) were located in Scotts Bluff County. A total of 248 complete surveys were received as a result of the three mailings for a 45.2 percent response rate. Table 2.1 shows the breakdown of responding businesses according to business size and industry groupings. Results show that the vast majority of responding businesses have less than 50 employees and are in service industries. This result is consistent with our approach of surveying all Scottsbluff area establishment with 10 or more employees. The survey did not specifically target goods-producing businesses or large employers. 4
11 Table 2.1: Profile of Responding Businesses Responses Group Number Share Size of Business Small (Less than 50 employees) % Mid-size ( employees) % Large (More than 100 employees) % Industry Goods-Producing % Service-Producing % Wholesale and Retail Trade % Health Care % Source: UNL-BBR calculations based on the Scottsbluff Survey of Hiring and Training Needs Turning to specific figures, 89.1 percent of respondents were businesses with few than 50 employees. These are designated as small businesses in the discussion of the survey. Another 6.0 percent of businesses have between 50 and 100 employees. These are designated as mid-size businesses. The remaining 4.8 percent of respondents were large employers with more than 100 employees. Goods-producing businesses accounted for 16.5 percent of respondents. The goods-producing category primarily includes manufacturers and construction businesses but also includes one or two agricultural service-providers. Services businesses accounted for 83.5 percent of respondents. Services is a broad category which includes trucking and warehousing, wholesale and retail activity, finance and insurance, information, professional and business services, health care services, leisure and hospitality, and personal services. The sector includes a large majority of the businesses in the economy with more than 10 employees as well as a large majority of the respondents to the Scottsbluff Survey of Hiring and Training Needs. Table 2.1 also lists the number of responses received from businesses in two primary services sectors. There were 68 responses from wholesale and retail trade businesses and 35 responses from health care businesses. Table 2.2 shows several key employment characteristic of the survey responses including the number of years the business has been operating, the average share of full-time versus part-time workers, the average share of seasonal workers, the average current job openings and the share of respondents which had hired or tried to hire over the last two years. Given the focus on establishments with 10 or more employees, it was expected that the sample would primarily 5
12 include older, established firms. After all, most new establishments start small and grow over time. However, it is notable that 78.9 percent of respondents had been in business for more than 10 years, while just 9.3 percent had been in business for 1 to 5 years and 11.4 percent had been in business for 6 to 10 years. Based on a simple average across the responding businesses, 72.5 percent of jobs were full-time versus 27.5 percent par-time. Only 4.5 percent of jobs at responding business were seasonal. Table 2.2: Employment Characteristics of Responding Businesses Measure Value or Share Years in Operation Less than 1 year 0.4% 1 to 5 years 9.3% 6 to 10 years 11.4% More than 10 years 78.9% Percentage of Employment Full-Time 72.5% Part-Time 27.5% Seasonal 4.5% Average Current Job Openings 1.6 Hired or Tried to Hire Last Two Years 97.1% Source: UNL-BBR calculations based on the Scottsbluff Survey of Hiring and Training Needs Responding businesses also were very active in the labor market, with 97.1 percent of respondents reporting that their business hired or tried to hire employees during the last two years. Respondents also had job openings. On average, responding businesses reported having 1.6 job openings at the time that the survey was completed. Therefore businesses responding to the survey had approximately 400 job openings at the time the surveys were completed. Survey respondents are typically small, established firms, which primarily provide full-time and full-year employment. Most have a significant number of current job openings and have been active in hiring over the last two years. While it may have been desirable to reach a larger sample of young firms, the respondents otherwise are an appropriate group for study in order to provide insights about hiring and training in the Scottsbluff area. 6
13 3. RESULTS OF THE SURVEY This section describes the key results from the Scottsbluff Survey of Hiring and Training Needs, including information on the types of workers businesses seek to hire and the occupation skills of these workers. Results are presented for all businesses and by industry and occupation. Results are presented first for newly hired workers before discussion turns to job characteristics for the existing workforce. HIRING WORKERS One initial concern is the employment and occupation background of workers that businesses hire. Business may strongly consider working status implying a preference to hire currently employed workers. As seen in Figure 3.1, just over one in six businesses (16.7%) indicated that employment status is strongly considered. Nearly one-third (32.1%) indicate that employment status is somewhat considered. Just over half of businesses in the Scottsbluff area (51.3%) indicate that current employment status is considered only slightly or not considered at all. This last result is encouraging as it suggests that a significant share of businesses are very open to hiring workers who are unemployed or re-entering the workforce. However, nearly half of businesses have a preference, and perhaps even a strong preference, for hiring workers who are currently working. This has positive implications for economic development in an area such as the Nebraska Panhandle with a low unemployment rate. 40.0% Figure 3.1: When hiring, how much does your business consider whether an applicant is currently working? 30.0% 28.5% 32.1% 22.8% 20.0% 16.7% 10.0% 0.0% Not considered at all Slightly considered Somewhatconsidered Strongly considered Source: UNL-BBR calculations based on the Scottsbluff Survey of Hiring and Training Needs 7
14 Applicant Experience by Industry. Figure 3.2 shows the industry tendencies of applicants when businesses have open positions. Specifically, the figure shows how many applicants have experience in the same or closely related industry. Only 4.9 percent of businesses indicated that all or nearly all applicants are from the same industry or a closely related industry. Another 28.2 percent indicated that most applicants had relevant industry experience. More than two-thirds of businesses reported that a smaller share of applicants had experience from the same or a closely related industry. Specifically, 43.7 percent indicated that only some applicants had experience in relevant industry while 23.3 percent indicated that few or no applicants had that experience. Figure 3.2: When Hiring, What Is Your New Worker's Experience In Your Industry? Few or no applicants have experience in my industry or a closely related industry 23.3% Some applicants have experience in my industry or a closely related industry 43.7% Most applicants have experience in my industry or a closely related industry 28.2% All or nearly all applicants have experience in my industry or a closely related industry 4.9% 0.0% 10.0% 20.0% 30.0% 40.0% 50.0% Source: UNL-BBR calculations based on the Scottsbluff Survey of Hiring and Training Needs Applicant Experience by Occupation. Figure 3.3 looks at these same issues from an occupation perspective. Specifically, the figure shows the share of applicants who were in the same occupation or a closely related occupation. Generally speaking, the match by occupation is much stronger than the match by industry, suggesting that most applicants have relevant occupationspecific skill. In particular, 20.1 percent of businesses indicated that all or nearly all of the applicants are from the same occupation or a closely related occupation, while 43.0 percent of businesses reported that most applicants had this relevant background. By contrast, 31.1 percent of businesses indicated that only some applicants had experience in the same occupation or a closely related occupation, and 5.7 percent of businesses reported that few or no applicants had this relevant background. 8
15 Figure 3.3: When hiring, what is your new Worker's Experience in Your Occupation? Few or no applicants in same or closely related occupation 5.7% Some applicants in same or closely related occupation 31.1% Most applicants in same or closely related occupation 43.0% All or most applicants in same or closely related occupation 20.1% 0.0% 10.0% 20.0% 30.0% 40.0% 50.0% Source: UNL-BBR calculations based on the Scottsbluff Survey of Hiring and Training Needs Skills of the applicant pool. When hiring workers, the overall skill level of the applicant pool plays a large role in determining how successful a business will be in matching applicants to positions advertised. The survey asks businesses to rate the overall competency level of applicants based on different skills. The results are shown in Table 3.1. On average, employers rated skill level as adequate about 50 percent of the time with a significant share of employers rating skills as strong. There are a few notable exceptions. Employers gave applicants a less than adequate rating for leadership skills 43.1 percent of time and IT skills 34.7 of the time. This result for IT skills is of particular importance due to the fact that programming skills are quickly turning into the core competency for all kinds of workers. Over one quarter of employers also gave applicants a less than adequate ranking for work ethic, sales skills, written communication and ability to pay attention to detail. Interestingly, a relatively large share of applicants also received a rating of strong for work ethic and ability to pay attention to detail. Scottsbluff area job applicants seem to be somewhat bifurcated on these two key characteristics. Applicants fared the best in three skills: willingness to learn, attitude and customer service skills. These traits are consistent with known strengths of the Scottsbluff area work force including high labor force participation rates and high rates of multiple job holding. 9

16 Source: UNL-BBR calculations based on the Scottsbluff Survey of Hiring and Training Needs Since leadership skills and IT are rated so low by employers, it is important to understand if this is true of the entire applicant pool or only effects certain industries. This is examined in Figure 3.4. Work ethic also is examined. A large share of businesses in the Transportation and Warehousing, Agriculture, Forestry, Fishing and Hunting and Retail and Wholesale industries rank IT skills as less than adequate. This reinforces the fact that computer skills are important across all industries, including many blue collar industries. Leadership skills are an issue in a somewhat different set of industries. In particular, a large share of businesses in the Health Care, Leisure and Hospitality and Retail and Wholesale industries rank applicants as less than adequate. Work ethic is a leading concern for applicants in lower wage service industries, especially the Leisure and Hospitality and Retail and Wholesale. Note that the Retail and Wholesale industry was among the most likely to report concerns with all three skills. By contrast, businesses in the Manufacturing industry report 20 percent or fewer applicants are less than adequate in terms of leadership skills, IT, and work ethic. These results may reflect that the manufacturing industry is able to attract applications from higher quality workers. 10
17 Figure 3.4: Percentage of applicant pool ranked "less than adequate" by industry Work ethic IT (programming, etc) Leadership Skills Agriculture, Forestry, Fishing and Hunting (11) Manufacturing (31, 32, 33) Retail and Wholesale (42, 44, 45) Transportation and Warehousing (48, 49) Professional, Scientific, Technical, and Information (51, 54) Finance and Insurance (52) Healthcare (62) Leisure and Hospitality (71, 72) Other (21, 22, 23, 53, 55, 56, 61, 81) 20.0% 20.0% 15.8% 10.5% 20.0% 31.3% 37.5% 25.0% 43.8% 28.1% 21.9% 51.6% 42.5% 30.0% 50.0% 34.4% 36.4% 45.5% Source: UNL-BBR calculations based on the Scottsbluff Survey of Hiring and Training Needs 7.7% 14.3% 12.5% 28.6% 34.8% 50.0% 47.0% 47.0% 71.4% 0% 10% 20% 30% 40% 50% 60% 70% 80% REPLACEMENT OF RETIRING WORKERS As older workers retire, it is imperative to replace them with new employees. How will these workers be replaced? The survey addresses this issue by asking several questions about retiring workers and how businesses plan to mitigate a potential skills gap. More specifically, the Scottsbluff Survey of Hiring and Training Needs asked employers the following: how concerned are you about the potential loss of skills and experience that may result from workers retiring from this location? Each business was then prompted to think about the question in terms of the next year and in the next 5 years. The results are reported in Figure 3.5. Two-thirds of businesses reported that they were only slightly concerned or not concerned about a loss of skills resulting from retiring workers within the next year. This drops to approximately 50 percent when thinking about the next 5 years. 11
18 Figure 3.5: Percent concerned about potential loss of skills and experience from retiring workers In the next year? In the next 5 years? 37.3% 30.3% 24.9% 24.9% 26.6% 18.9% 13.5% 23.6% Not at all Slightly Somewhat Very Source: UNL-BBR calculations based on the Scottsbluff Survey of Hiring and Training Needs Steps taken to address the potential skills gap. Businesses were then asked if they had taken steps to address the potential skill gaps that may occur due to the retirement of workers. The majority of businesses (88.3%) answered yes or no, but plan to which highlights the fact that employers are actively thinking about resolving this problem. A follow-up question asked: how is management at this location addressing potential skill gaps that may result from workers retiring in the near future? Of the employers responding to this question, the most common answer selected was to train workers in the skills that will be lost. (See Figure 3.6.). While a significant share of employers were concerned about replacing retiring workers, most firms had taken steps or planned to take steps to make these transitions, through a mix of training and promoting from within or hiring new workers. Hiring new workers with the needed skills, however, was only the fourth most popular option. This raises several questions. Are employers comfortable with the new workers which they hire? And, do employers feel there is an adequate supply of applicants which have the correct set of skills? These questions are answered in the next section, which addresses employer experiences when hiring. 12
19 Figure 3.6: How businesses are addressing the potential skill gaps that may occur as workers retire Training workers in the skills that will be lost 70.5% Mentoring workers through on-the-job training Formal succession planning Hiring workers with the skills that will be lost 39.3% 46.4% 53.6% Mentoring/Leadership programs Retain workers on a part-time/consultant basis 30.4% 26.8% Encouraging workers to delay retirement Other 5.4% 2.7% 0% 10% 20% 30% 40% 50% 60% 70% 80% Source: UNL-BBR calculations based on the Scottsbluff Survey of Hiring and Training Needs DIFFICULTIES FINDING WORKERS Figures look at challenges businesses face in hiring. The survey asked each employer to name the three most common occupations searched for when hiring. Employers then indicated whether or not it was difficult to find workers in these specific occupations, and if there were difficulties, why? Figure 3.7 looks at how often it was difficult to find workers. Businesses reported 73.8 percent of the time that it was difficult to find workers. This implies that for every 10 workers hired businesses had trouble finding workers for 7 or 8 of those positions. 13
20 80.0% 70.0% 60.0% 50.0% 40.0% 30.0% 20.0% 10.0% 0.0% Figure 3.7: Is It Difficult to Find Workers? 26.2% No 73.8% Yes Source: UNL-BBR calculations based on the Scottsbluff Survey of Hiring and Training Needs Difficulty Finding Workers by Industry. One natural question arises: is it as difficult to find workers in all industries or occupations? Perhaps there are some industries and occupations where it is very difficult to find workers and other industries and occupations where the challenge is less severe. Figure 3.8 begins to address this question by disaggregating the businesses that reported difficulty finding workers and displaying them by industry. A diverse set of production, trade and services industries had the greatest difficulty finding workers. Businesses in the agriculture industry had difficulty finding workers most often, at 81.8 percent of the time. But, three other industries followed close behind including finance and insurance (81.6%), professional, scientific, technical and information (81.3%), and retail and wholesale trade (80.5%). Manufacturing and health care businesses had difficulty 76.0 and 75.6 percent of the time, respectively. The industries where businesses had the least difficulty finding workers were leisure and hospitality (58.4%) and transportation and warehousing (50.0%). 14
21 Figure 3.8: Is it Difficult to Find Workers? Percent "Yes" by Industry Agriculture, Forestry, Fishing and Hunting (11) Manufacturing (31, 32, 33) Retail and Wholesale (42, 44, 45) 76.0% 81.8% 80.5% Transportation and Warehousing (48, 49) 50.0% Finance and Insurance (52) Professional, Scientific, Technical, and Information (51, 54) Healthcare (62) 75.6% 81.6% 81.3% Leisure and Hospitality (71, 72) 58.4% Other (21, 22, 23, 53, 55, 56, 61, 81) 72.0% 0% 20% 40% 60% 80% 100% Source: UNL-BBR calculations based on the Scottsbluff Survey of Hiring and Training Needs Difficulty Finding Workers by Occupation. There is even more variation when observing results by occupation (Figure 3.9). Installation, maintenance and repair workers are especially difficult to find, at 88.1 percent. The level of difficulty is also high for other types of blue collar workers: employers report difficulty 78.7 percent for production workers, 76.4 percent for transportation and material movers, and 82.8 percent for all other blue collar workers. There also is a group of white collar occupations where it is especially difficult to hire workers. These include computer and mathematical workers (87.5%) and business and financial operations workers (81.8%). Healthcare practitioners are the most difficult workers to hire, with businesses reporting difficulty 90.9 percent of the time. Health care support workers are difficult to hire 80.0 percent of the time. 15
22 Figure 3.9: Is it Difficult to Find Workers? Percent "Yes" by Occupation Management (11) Business and Financial Operations (13) Computer and Mathematical (15) Architecture, Engineering, and Sciences (17, 19) Healthcare Practitioners and Technical (29) Healthcare Support (31) Food Preparing and Service Related (35) Personal Care and Service (39) Sales and Related (41) Office and Administrative Support (43) Construction and Extraction (47) Installation, Maintenance and Repair (49) Production (51) Transportation and Material Moving (53) Other Blue Collar (33, 37, 45) Other White Collar (21, 23, 25, 27) 54.8% 77.8% 81.8% 87.5% 66.7% 90.9% 80.0% 83.3% 78.6% 66.0% 76.5% 88.1% 78.7% 76.4% 82.8% 73.7% 0% 20% 40% 60% 80% 100% Source: UNL-BBR calculations based on the Scottsbluff Survey of Hiring and Training Needs Among other occupations, businesses report that personal care and service workers are difficult to hire 83.3 percent of the time, while sales workers are difficult to hire in 78.6 percent of cases. Hiring is less difficult, however, for other types of service workers. Food preparing and service related workers were reported as difficult to hire just 54.8 percent of the time, while office and administrative workers were difficult to hire in 66.0 percent of cases. Reasons for Difficulty. When businesses reported difficulty finding workers, they were also asked why they faced challenges. Figure 3.10 reports on the reasons. Businesses were allowed to select from a menu of options and choose any reason that applied. This follow-up question, naturally, was only asked where firms indicated that workers in an occupation were difficult to find. Number of applicants. Lack of applicants was, by far, the most common factor reported by Scottsbluff area businesses. More than three quarters of businesses faced this problem, while 18.5 percent of employers faced the related problems of finding workers available for required shifts. Two factors are likely contributing to this result. First, the Scottsbluff area economy is at 16
23 full employment, implying that the supply and demand for workers is roughly in balance. Second, with baby boom age workers beginning to retire in larger numbers, there has been slow growth in the labor force. Worker Training and Experience. Lack of work experience also is a common concern (53.8%) along with a lack of occupation-specific skills (43.8%). This is a serious concern. Worker skill partly results from education and training but learning by doing through on-the-job experience is also a powerful source of workers skill. Experience also builds team work, reliability, and other characteristics which are valued by employers. In a related result, employers indicate that for 13.2 percent of occupations it is difficulty to hire because candidates lacked required licenses and certificates. 90.0% 80.0% 70.0% 60.0% 50.0% 40.0% 30.0% 20.0% 10.0% 0.0% Figure 3.10: Why is it difficult to find workers? 77.9% 53.8% 44.2% 43.8% 25.5% 26.0% 18.5% 13.2% 12.3% 3.1% 4.6% 3.1% 11.5% Source: UNL-BBR calculations based on the Scottsbluff Survey of Hiring and Training Needs Applicant history. Applicant history also was a source of difficulty in hiring with 44.2 percent of employers reporting that job-seekers had a poor work history. A failed background check is mentioned by respondents in 25.5 percent of cases. Reasons for Difficulty by Industry. The results in Figure 3.10 show a breadth of challenges faced by employers. Employers face the three issues of experience, occupation skill, and poor work history in at least 43 percent of the searches. That is a daunting task. However, these data 17
24 represent averages across all industries and occupations. The nature of the challenge could vary by industry. Table 3.2 which shows the difficulty in finding workers by industry. In manufacturing, the difficulty of finding workers due to a lack of work experience and occupation specific skills is especially acute. There also is an elevated share of employers who report it is difficult to find applicants who can work required shifts. To address these challenges, workers could spend time serving as a helper or laborer to build their experience in the manufacturing workforce. In agriculture, there also are challenges related to an inability to pass a background check and wage demands which were too high. Wage demands also were a common issue in two other industries. Businesses in the transportation and warehousing industry reported that workers had wage demands which were too high in 42.9 percent of cases. The share was 39.0 percent in the health care industry. Concerns about a poor work history also are heightened in the transportation and warehousing industry. In this industry businesses reported 85.9 percent of the time that poor work history made hiring more difficult. This was by far the highest percentage in any single industry; however the issue also was a challenge for the health care industry, in 54.2 percent of cases. Poor work history also is an issue for businesses hiring in the leisure and hospitality industry, in 54.2 percent of cases. The industry also has a challenge with work force availability. Leisure and hospitality businesses 79.7 percent of the time reported that it is difficult to hire due to a lack of applicants. This percentage is slightly above the average for all industries. More importantly, businesses reported that it is difficult to find workers who could work the required shifts in 33.9 percent of cases, which is well above the all-industry average. There are concerns about a lack of work experience in the professional, scientific, technical and information industry. 18
25 Industry Names (NAICS code) Lack of work experience Poor work history Table 3.2: Why It is Difficult to Find Workers by Industry Lack occupation specific skills Failed Background Check Reason Why It is Difficult to Find Workers Lack required Not licenses/ Language enough certificates barrier Applicants Wage Demands too high Availability for shifts required Lack required education Overqualified Citizenship/ Work Authorization Agriculture (NAICS 11) 44.4% 27.8% 44.4% 38.9% 44.4% 22.2% 11.1% 66.7% 16.7% 0.0% 5.6% 5.6% Manufacturing (32, 33) 60.5% 36.8% 65.8% 21.1% 26.3% 13.2% 7.9% 71.1% 28.9% 13.2% 2.6% 5.3% Retail and Wholesale (42, 44, 45) 58.1% 40.3% 48.4% 37.1% 17.7% 16.9% 1.6% 77.4% 9.7% 9.7% 2.4% 0.0% Transportation and Warehousing (48, 49) Professional, Scientific, Technical, and information (51, 54) Finance and Insurance (52) Health Care (62) 71.4% 85.7% 28.6% 28.6% 42.9% 28.6% 0.0% 71.4% 42.9% 0.0% 28.6% 0.0% 53.8% 19.2% 42.3% 0.0% 19.2% 7.7% 0.0% 76.9% 0.0% 23.1% 7.7% 0.0% 48.4% 22.6% 45.2% 0.0% 35.5% 12.9% 0.0% 77.4% 12.9% 3.2% 16.1% 0.0% 52.5% 54.2% 42.4% 33.9% 39.0% 15.3% 5.1% 81.4% 25.4% 32.2% 3.4% 0.0% Leisure and Hospitality (71, 72) 37.3% 54.2% 18.6% 10.2% 13.6% 3.4% 0.0% 79.7% 33.9% 8.5% 0.0% 0.0% Other (21,23, 53, 55, 56, 61, 81) 63.0% 61.1% 48.1% 31.5% 33.3% 11.1% 5.6% 83.3% 16.7% 5.6% 5.6% 18.5% Total 53.8% 44.2% 43.8% 25.5% 26.0% 13.2% 3.1% 77.9% 18.5% 12.3% 4.6% 3.1% Source: UNL-BBR calculations based on the Scottsbluff Survey of Hiring and Training Needs 19
26 Reasons for Difficulty by Occupation. Table 3.3 reports the difficulties that employers face when hiring by major occupation group. Individual occupation groups are reported separately when sufficient observations were available. Results are shown for a set of other white collar occupations, service occupations, and blue collar occupations. Analysis begins by looking at white collar occupations. In those occupations, relatively few employers report that a poor work history or a failed background checks make it difficult to hire. A lack of occupation-specific skills and experience, however, are frequent concerns, particularly for computer and mathematical occupations. These results suggest significant opportunity for training to prepare individuals for careers in computer occupations such as computer programming or software development. There is no particular source of difficulty in hiring for healthcare practitioners and technical occupations other than a lack of applicants. This may reflect ongoing challenges in attracting and retaining health care professionals in nonmetropolitan areas. The combination of too high wage demands, poor work history and failed background checks creates difficulty in hiring workers in service occupations. Among these occupations, poor work history and a failed background check are especially problematic for hiring in healthcare support occupations. Too high wage demands are especially problematic when hiring workers for personal care and service occupations. Turning to blue collar occupations, there is also a heightened concern about work history and failed background checks for construction and extraction occupations and transportation and material moving occupations. A higher share of employers also report a lack of work experience and occupation-specific skills as a difficulty in hiring for blue collar occupations, especially installation, maintenance and repair occupations and construction and extraction occupations. A lack of occupation specific skills was cited as a difficulty by 68 percent to 77 percent of employers hiring in these occupations. This suggests a significant need for more pre-hire education programs for blue collar workers. A need for licenses and certifications also is reported as challenge for employers hiring in the construction and extraction and the transportation and material moving occupations. 20
27 Occupation Names (SOC Code) Management (SOC 11) Business & Financial Operation (13) Computer & Mathematical (15) Architecture, Engineering and Sciences (17, 19) Other White Collar (21, 23, 25, 27) Healthcare Practitioners and Technical (29) Healthcare Support (31) Food Preparation and Service Related (35) Personal Care and Service (39) Lack of work experience Poor work history Table 3.2: Why It is Difficult to Find Workers by Occupation Reason Why It is Difficult to Find Workers Lack Lack occupation Failed Wage required Not specific Background Demands licenses/ Language enough skills Check too high certificates barrier Applicants Availability for shifts required Lack required education Over qualified 50% 29% 50% 21% 36% 7% 0% 86% 21% 14% 21% 0% 61% 28% 61% 0% 28% 6% 0% 72% 0% 6% 17% 0% 100% 0% 100% 0% 0% 57% 0% 100% 14% 86% 0% 0% 50% 25% 50% 25% 25% 0% 0% 50% 0% 25% 0% 0% 50% 21% 50% 7% 21% 7% 0% 71% 14% 29% 0% 0% 25% 25% 25% 20% 25% 10% 5% 70% 15% 25% 5% 0% 50% 83% 25% 58% 25% 25% 0% 83% 33% 25% 0% 0% 41% 54% 22% 13% 26% 0% 2% 76% 50% 7% 2% 0% 33% 33% 20% 20% 47% 27% 0% 67% 20% 7% 0% 0% Citizenship 21
28 Occupation Names (SOC Code) Sales and Related (41) Office and Administrative Support (43) Construction and Extraction (47) Installation, Maintenance and Repair (49) Production (51) Transportation and Material Moving (53) Other Blue Collar (33, 37, 45) Lack of work experience Poor work history Table 3.2: Why It is Difficult to Find Workers by Occupation (Continued) Reason Why It is Difficult to Find Workers Lack Lack occupation Failed Wage required Not Availability specific Background Demands licenses/ Language enough for shifts skills Check too high certificates barrier Applicants required Lack required education Over qualified 52% 36% 34% 14% 11% 2% 2% 71% 9% 5% 0% 0% 49% 41% 38% 13% 24% 2% 0% 75% 9% 10% 10% 0% 69% 62% 77% 69% 46% 31% 8% 62% 15% 0% 0% 46% 84% 38% 68% 24% 19% 14% 0% 78% 5% 22% 0% 0% 57% 49% 54% 32% 27% 11% 11% 76% 43% 5% 3% 5% 48% 55% 43% 52% 41% 52% 2% 62% 17% 5% 5% 5% 46% 42% 38% 33% 25% 8% 17% 88% 33% 4% 4% 13% Source: UNL-BBR calculations based on the Scottsbluff Survey of Hiring and Training Needs Citizenship 22
29 WORKER TRAINING More than half of all employers (53.4%) report a lack of work experience as a difficulty in hiring. The lack of occupation specific skills is also a concern, cited by 43.8 percent of employers. This suggests a significant need for education and training programs, including posthire training. Figure 3.11 reports on whether Scottsbluff area employers provide job-specific training after workers are hired. Employers respond that job-specific training is provided to nearly 87.6 percent of new workers. Results are consistent by industry and occupation. Nearly all new workers are receiving post-hire training % Figure 3.11: Is Job-Specific Training Provided For New Workers? 87.6% 80.0% 60.0% 40.0% 20.0% 0.0% Yes 12.4% No Source: UNL-BBR calculations based on the Scottsbluff Survey of Hiring and Training Needs Another question is where that training is taking place. Is it only occurring in house at the business? If off-site training ( out-of-house ) is occurring, how often is it used? Survey results indicate that for employers who provide post-hire training, 95.1 percent provide in-house training. Another 32.2 percent provide out-of-house training opportunities. This suggests ample need for out-of-house training as well as for training providers to bring training opportunities into the state. Results regarding in-house training hold for all industries and occupations. The share of employers providing out-of-house training, however, varies quite a bit by industry and occupation. Out-of-house training activity is reported below by industry and occupation, in Tables 3.12 and
30 Out-of-house training by industry. Figure 3.12 shows the share of out-of-house training by industry. Shares ranged from 0.0 to 60.0 percent, depending on the industry. Out-of-house training for new workers is most common in the finance and insurance and the leisure and hospitality industries. Out-of-house training was least common for new hires in the agriculture and the professional, scientific, technical and information industries. Figure 3.14: Share of Occupations Where Out-of- House training is Provided by Industry 70.0% 60.0% 50.0% 60.0% 53.3% 40.0% 30.0% 29.4% 32.1% 28.6% 35.7% 30.8% 20.0% 10.0% 0.0% 0.0% 9.4% Source UNL-BBR calculations based on the Scottsbluff Survey of Hiring and Training Needs Out-of-house training by occupation. Figure 3.13 shows the share of out-of-house training by occupation. Out-of-house training is most common for new hires into computer and mathematical occupations. Other white collar occupations with more frequent out-of-house training are: business and financial operations and health care professional and technical occupations. Out-of-house training for new hires is also more frequent in two blue collar occupations, construction and extraction workers and installation, maintenance and repair workers, and one service occupation, personal care and service workers. 24
31 120.0% 100.0% Figure 3.13: Share of Occupations Where Out-of- House Training is Provided by Occupation 100.0% 80.0% 60.0% 40.0% 20.0% 43.8% 57.9% 61.5% 62.5% 55.0% 52.9% 52.6% 48.7% 42.9% 38.8% 23.7% 14.1% 16.5% 8.9% 17.4% 0.0% Source: UNL-BBR calculations based on the Scottsbluff Survey of Hiring and Training Needs Since the majority of businesses provide post-hire training of some sort, it is natural to ask what type of training is provided. Figure 3.14 begins to answer that question. Generally speaking, the interest or ability to provide training appears to fall as the time commitment and cost rises. 90.0% 80.0% 70.0% 60.0% 50.0% 40.0% 30.0% 20.0% 10.0% 0.0% 17.1% Figure 3.14: Type of Training 81.0% 18.1% 8.7% 4.8% 12.9% Source: UNL-BBR calculations based on the Scottsbluff Survey of Hiring and Training Needs 25
32 Classes and full certification courses are the most common type of training classroom training, provided 17.1 percent and 18.1 percent of cases, respectively. A full certification course would include multiple classes or on-line training sessions. Preparation for a license is provided in 9.7 percent of cases while a college or community college course 4.8 percent. The most common type of training, at 81.0 percent, is on-the-job training provided by other workers or a supervisor. Training by Industry. Table 3.4 shows the type of training by industry. The share of workers provided with a training class varies. Workers are rarely given the opportunity to take a college course, with the greatest share being in the finance and insurance industry (11.1%). Industry Table 3.4: Type of Training by Industry Class but no certification course License Certification Course College/ Community College Course Training by Other Worker or Supervisor Construction (23) 0.0% 15.0% 5.0% 0.0% 95.0% Manufacturing (31,32,33) 10.9% 8.7% 6.5% 6.5% 84.8% Retail and Wholesale (42,44,45) Transportation and Warehousing (48,49) Professional, Scientific, Technical and Information (51,54) Finance and Insurance (52) 25.0% 8.3% 27.3% 4.5% 84.1% 41.7% 16.7% 0.0% 0.0% 83.3% 12.5% 12.5% 4.2% 8.3% 70.8% 25.0% 5.6% 11.1% 11.1% 94.4% Healthcare (62) 23.3% 9.6% 24.7% 11.0% 71.2% Leisure and Hospitality (71,72) 7.2% 3.6% 15.7% 0.0% 77.1% Other (21,22,23, 53,55,56,61,81) 10.0% 11.4% 20.0% 1.4% 80.0% Source: UNL-BBR calculations based on the Scottsbluff Survey of Hiring and Training Needs Training by Occupation. Table 3.5 shows the type of training by occupation. Training is common in all occupations although class-based training is less common for food preparation and service related occupations and in a number of blue collar occupations including production workers, and other blue collar workers. Certification courses were most common for computer and mathematical occupations, installation, maintenance and repair occupations and health care support occupations. Full college or community college courses are most common for computer and mathematical occupations. 26
33 Table 3.5: Type of Training by Occupation Occupation Class but no certification License Certification course College/ Community College Course Training by Other Worker or Supervisor Management (11) 12.5% 12.5% 25.0% 6.3% 87.5% Business and Financial Operations (13) 31.6% 5.3% 10.5% 21.1% 84.2% Computer & Mathematical (15) 0.0% 0.0% 75.0% 50.0% 100.0% Architecture, Engineering and Sciences (17,19) 42.9% 0.0% 28.6% 14.3% 85.7% Other White Collar (21,23,25,27) 35.7% 14.3% 7.1% 7.1% 57.1% Healthcare Practitioners and Technical (29) 28.6% 23.8% 14.3% 19.0% 66.7% Healthcare Support (31) 5.9% 17.6% 58.8% 17.6% 70.6% Food Preparation and Service Related (35) 9.4% 3.1% 12.5% 0.0% 75.0% Personal Care and Service (39) 12.5% 12.5% 18.8% 6.3% 68.8% Sales and Related (41) 26.0% 10.0% 22.0% 2.0% 82.0% Office and Administrative Support (43) 15.2% 0.0% 9.8% 0.0% 87.0% Construction and Extraction (47) 0.0% 21.1% 10.5% 0.0% 78.9% Installation, Maintenance and Repair (49) 40.0% 2.5% 47.5% 2.5% 72.5% Production (51) 5.1% 7.7% 7.7% 5.1% 92.3% Transportation and Material Moving (53) 14.9% 23.4% 8.5% 0.0% 89.4% Other Blue Collar (33,37,45) 4.2% 8.3% 8.3% 0.0% 87.5% Source: UNL-BBR calculations based on the Scottsbluff Survey of Hiring and Training Needs EXISTING WORKERS The Scottsbluff Survey of Hiring and Training Needs also examines the characteristics of the existing workforce. Specifically, employers were asked to rate the overall skill level required of existing workers and indicate if there were deficiencies for the majority of the workforce. Figure 3.15 shows their responses. Employers were allowed to select all answers that applied. Skill Level of Existing Workers. Results indicate that leadership and critical thinking skills are among the most commonly perceived deficiencies amount current workers. Leadership and critical thinking are among the more sophisticated skills that students are supposed begin building through education and then practice both in and out of the workplace. These results send a clear message to educators that it is critical to continue to devote resources to building these skills and perhaps devote even further resource. These results also send a clear message to students and employees to devote themselves to writing and analytic assignments. 27
34 45.0% 40.0% 35.0% 30.0% 25.0% 20.0% 15.0% 10.0% 5.0% 0.0% 21.0% Figure 3.15: Deficiencies Among the Current Workforce of Businesses 38.7% 40.8% 27.6% 24.7% 23.2% 21.5%19.9% 36.5% 42.2% 33.7% 32.3% 32.1%31.3% 28.0% 37.6% 35.8% 40.1% Source: UNL-BBR calculations based on the Scottsbluff Survey of Hiring and Training Needs Another common and related set of skill deficiencies involve work ethic, attitude, ability to pay attention to detail, ability to adapt to change, and to problem solve. Employers are looking for workers who understand and buy into the mission and goals of the organization, and adapt to meet challenges as they arise with the same vigor as employers. Employers often hope to share the responsibility and work ethic required to meet deadlines, satisfy clients, or win new business. Employees that share that burden create value for employers. Employers are less likely to select specific hard skills that are often an emphasis of education and training such as computer skills, information technology and sales skills. These skills have been a point of emphasis in education in recent years and perhaps should be an even greater point of emphasis. The lower frequency with which these deficiencies have been selected could indicate that education and training in this area has been effective. But, there is another potential explanation. It could be that these skills, while needed in many occupations, are not needed as often as universal soft skills like work ethic or leadership. This may be the reason for the lower percentages observed in Figure Benefits Provided to Existing Workers. The survey also gathered detailed information about the benefits provided to workers. This information pertains to the ability of businesses to retain their workforce. As seen in Figure 3.16, the survey results reveal the benefits received by full-time workers. A majority of firms (58.2%) offer all workers health care benefits, while 72.7 percent 28
35 offer paid vacation and 68.5 percent paid holidays. Sixty-one percent of firms offer retirement benefits to all workers. Dental insurance is available to all workers in 44.0 percent of businesses and vision insurance in 37.2 percent. These benefits also are provided to some workers in another 5 to 10 percent of businesses. Naturally, the value of all these benefits depends on the specific programs offered. The survey also included a question about tuition reimbursement which is important given the emphasis on worker skill in the survey. This benefit was provided to all workers in 24.2 percent of businesses. 90.0% 80.0% 70.0% 60.0% 50.0% 40.0% 30.0% 20.0% 10.0% 0.0% Figure 3.16: What Percentage of Full-Time Workers Are Eligible For the Following Benefits 58.2% 58.9% 60.9% 50.4% 44.0% 37.2% 30.5% 29.2% 72.7% 8.4% 68.5% 17.9% 52.2% 35.1% 24.2% 62.8% 33.8% 31.1% 2.3% 85.6% All workers Some workers No Workers Source: UNL-BBR calculations based on the Scottsbluff Survey of Hiring and Training Needs As would be expected, the level of benefits provided to part-time workers is substantially less. These results are reported in Figure Only 8.2 percent of business reported providing health insurance coverage to all of their part-time workers while 6.0 percent reported providing it to some part-time workers. Slightly higher percentages were reported for dental and vision insurance. Tuition reimbursement benefits are provided to even few part-time workers. Between 17.0 percent and 23.9 percent of employers provide retirement benefits, paid vacation and paid holidays to all part-time workers. Part-time employees fared much worse with tuition reimbursement. The large majority of firms (88.2%) offered no tuition reimbursement to any employees. Similar to full-time workers, part-time workers were least likely to be offered any telecommuting benefits. 29
36 100.0% 90.0% 80.0% 70.0% 60.0% 50.0% 40.0% 30.0% 20.0% 10.0% 0.0% Figure 3.17: What Percentage of Part-Time Workers Are Eligible For The Following Benefits? 85.8% 83.1% 84.1% 8.2% 10.9% 10.4% 71.4% 17.0% 19.3% 66.3% 62.8% 23.9% 12.4% 78.7% 3.4% 88.2% 41.4% 35.9% 1.7% 92.1% All workers Some workers No Workers Source: UNL-BBR calculations based on the Scottsbluff Survey of Hiring and Training Needs 30
37 4. PROFILE OF SELECTED OCCUPATIONS This section provides a summary of information gathered for a set of key occupations throughout the Scottsbluff area economy. The occupations were chosen because employers frequently mentioned each as a top occupation when hiring. The chosen occupations also represent a variety of education and training needs. Some commonly hired but lower skill occupations were not included. In total, 9 particular occupations are listed. Nursing Assistant is the first occupation listed, in Table 4.1. This occupation provides low wages, with an average hourly wage of $ Wages range between $8.00 and $12.40 per hour. The minimum degree requirement at 42.9 percent of employers is a high school degree with 28.6 percent of employers requiring a technical or vocational degree. Another 28.6 percent of employers do not have a minimum education requirement. Seven of eight employers will consider applicants without experience while one in eight have a minimum experience requirements between 1 and 2 years. One hundred percent of employers report that it is difficult to hire workers in this occupation. Eighty-six percent report it is difficult to hire due to a lack of applicants while 57.1 percent indicate that it is difficult to find workers for required shifts. There are few concerns about occupation-specific skills (14.3%) but more concern about a lack of required licenses (42.9%) and work experience (42.9%). Concerns about the quality of applicants are most common. One hundred percent of employers report that it is difficult to hire because applicants have a poor work history while 85.7 percent report applicants cannot pass a background check. Fifty percent of employers provide post-hire certification opportunities while 25 percent provide licensing opportunities or community college courses and 12.5 percent provide training courses. The most common type of post-hire training is on-the-job training by others, at 62.5 percent. Waiters and Waitresses is the second occupation listed, in Table 4.2. This occupation provides low wages before tips. The hourly wage including tips is not known. One hundred percent of employers have no minimum education requirement for this occupation. Eighty-two percent of employers require no experience while 17.7 percent require 6 months of experience or less. With so few requirements, just 31.3 percent of employers report that it is difficult to hire workers in this occupation. For those employers who report difficulty in hiring, 60 percent indicate there are not enough applicants, while 40 percent report difficulty in finding applicants who can take required shifts. Another 60 percent report a lack of work experience while 40 percent cite a poor work history. The most common type of post-hire training is on-the-job training by others, which is provided by 52.6 percent of employers Retail Salesperson is the third occupation listed, in Table 4.3. This occupation provides low wages, with an average hourly wage of $ Some jobs in the occupation, such as automobile salesperson, pay wages which are far above this average. Fifty-two percent of employers require a high school degree 41.2 percent do not have a minimum education 31
38 requirement. More than fifty percent of employers (52.9%) will consider workers without experience while 29.4 percent of employers consider workers with 6 months experience or less. A minority of employers require additional work experience. Nearly 70 percent of employers report that it was difficult to hire workers in this occupation. Of these employers, 90.9 percent report it is difficult to hire due to a lack of applicants. Thirty-six percent of employers have concerns about a lack of work experience. There also concerns about the quality of applicants. Specifically, 36.4 percent of employers report that it is difficult to hire because applicants have a poor work history while 18.2 percent report applicants who cannot pass a background check. In terms of post-hire training, 23.5 percent of employers offer training courses while 17.6 percent provide a licensing opportunity. The most common type of post-hire training is once again onthe-job training by others, which is provided at 70.6 percent of employers.. Bookkeeping, Accounting and Auditing Clerks is the fourth occupation listed, in Table 4.4. This occupation provides moderate wages, with an average hourly wage (either reported directly or obtained by dividing the annual salary by 2,000 hours) of $ Wages range between $10 and $30 per hour, indicating that there are some high paying positions in this occupation. Consistent with this, 16.6 percent of employers require an Associate s or Bachelor s degree for this position. Most employers, however, require less education, with 58.3 percent of employers requiring a high school degree and 25 percent having no education requirement. Experience is more of a focus, with 18.2 percent of employers requiring 3 to 5 years of experience and 27.3 percent requiring 1 to 2 years of experience. Just over one-quarter of employers consider workers without experience. Eighty-three percent of employers report that it is difficult to hire workers in this occupation. Among employers who say it is difficult to hire, 90 percent indicate it is difficult due to a lack of applicants, while 50 percent report applicants with a lack of work experience and 30 percent report applicants with a lack of occupation-specific skill. One in six employers provide post-hire training courses but the most common type of post-hire training is one-the-job training by another worker or supervisor, which is provided by 83.3 percent of employers. Customer Service Representatives is the fifth occupation listed, in Table 4.5. This occupation provides low wages, with an average hourly wage of $ Wages range between $8 and $17 per hour. For 68.8 percent of employers, the minimum education requirement is a high school degree while about 25 percent of employers have no minimum education requirement. The occupation also is potentially accessible for new graduates, with 87.5 percent of employers indicating they consider workers with no experience. The remaining employers require less than 1 year of experience. Despite these minimal requirements, 80 percent of employers indicate it is difficult to hire workers in this occupation, primarily due to a lack of applicants. Eight-five percent of employers report there is a lack of applicants for jobs in this occupation, while 53.8 percent of employers indicate that applicants lack work experience and 30.8 percent a lack occupation specific skills. The quality of applicants is also an issue, with 38.5 percent of employers reporting that it is difficult to hire because applicants have a poor work history, and 32
39 15.4 percent reporting that applicants have difficulty passing a background check. In addition, 38.5 percent of employers report it is difficult to hire because applicants have wage demands which are too high. After an applicant is hired, 29.4 percent of employers provide a post-hire training course and 11.8 percent provide training for a certification. The most common type of post-hire training is on-the-job training by another worker or a supervisor, which is provided by 84.2 percent of employers. Stock Clerk and Order Fillers is the sixth occupation listed, in Table 4.6. This occupation provides low wages, with an average hourly wage of $ Wage rates range from $8.00 to $14.00 per hour. In terms of education requirements, 45.5 percent of employers require a high school diploma while 54.6 percent of employers have no minimum education requirement. Employers have few experience requirements, with 72.7 percent of employers willing to consider workers with no experience and the remaining 27.3 percent requiring less than 6 months experience. Despite these minimal requirements, 72.3 percent of employers report that it is difficult to hire workers in this occupation, primarily due to a lack of applicants. Two-thirds of employers report that there is a lack of applicants for jobs in this occupation. The quality of applicants is also an issue with 22.2 percent of employers reporting that it is difficult to hire because applicants have a poor work history and 44.2 of employers indicating that applicants have difficulty passing a background check. The only common type of post-hire training is onthe-job training provided by other workers or supervisors. On-the-job training is provided by 58.3 percent of employers. Welders, Cutters, Solderers and Brazers is the seventh occupation listed, in Table 4.7. This occupation provides moderate wages, with an average hourly wage of $ Hourly wages range between $9.00 and $ Employers have limited education requirements, with 22.2 percent of employers requiring a high school diploma and 77.8 percent of employers having no minimum education requirement. Employers do expect some work experience, however, with 44.4 percent of employers requiring from 6 months to 1 year of previous experience and 11.1 percent 1 to 2 years of experience. The remaining employers require less than 6 months or no previous experience. Eight out of nine employers report that it is difficult to find workers in this occupation. One common reason is a lack of applicants, as reported by 87.5 percent of employers. A lack of work experience (75.0%), a lack of occupation specific skills (62.5%), and a lack of required licenses and certificates (37.5%) are other common reasons it is difficult to hire. The quality of applicants also can be an issue with 37.5 percent of employers reporting that it is difficult to hire because applicants have a poor work history and 25.0 percent indicating that applicants cannot pass a background check. After a hire is made, 11.1 percent of employers provide a post-hire training course, 22.2 percent provide a training certificate program and 77.8 percent provide on-the-job training by another worker or supervisor. 33
40 Heavy and Tractor-Trailer Truck Drivers is the eighth occupation listed, in Table 4.8. This occupation provides moderate wages, with an average hourly wage (either reported directly or obtained by dividing the annual salary by 2,000 hours) of $ Hourly wages range from $10.50 to $37.50, suggesting that there are high wage opportunities in this occupation. In terms of education requirement, 52.3 percent of employers require a high school diploma while 42.1 percent have no minimum education requirement. Employers have more experience requirements with 21.1 percent requiring at least 3 years of experience and another 21.1 percent requiring between 1 and 3 years of experience. Another 47.4 employers require at least some experience while just 10.5 percent are willing to consider drivers with no experience. Ninety-five percent of employers report it is difficult to hire workers in this occupation. One common issue is applicants with a lack of the required licenses and certificates. This issue is named by 68.4 percent of employers. Other common issues are a lack of work experience (63.2%) and a lack of occupation specific skills (52.6%). Employers also have concerns about the quality of applicants, with 47.4 percent of employers indicating it is difficult to hire because applicants have a poor work history and 52.6 percent of employers indicating that applicants cannot pass a background check. In addition, 52.6 percent of employers report it is difficult to hire because applicants have wage demands which are too high. After an applicant is hired, one-third of employers provide applicants with training to earn a required license while 19.0 percent provide a training course. The most common type of training is on-the-job training by another worker or a supervisor, which is provided by 81.0 percent of employers. Laborers and Freight, Stock and Material Movers, Hand is the ninth occupation listed, in Table 4.9. This occupation provides lower wages, with an average hourly wage of $ There is a tight range of wages, from $8.00 to $12.00 per hour. The majority of employers (72.7%) have no minimum education requirement while 27.3 percent of employers require a high school diploma. The occupation is accessible to inexperienced applicants with 100 percent of employers willing to consider applicants with no work experience. Despite these minimal requirements, 63.6 percent of employers indicate that it is difficult to hire workers in this occupation. A common reason is a lack of applicants, an issue noted by 85.7 percent of employers. There are also significant issues with applicant quality with 85.7 percent of employers reporting that it is difficult to hire because applicants cannot pass a background check and another 42.9 percent noting applicants with a poor work history. When an applicant is hired, 27.3 percent of employers provide a training course but the most common type of training is on-the-job training by another worker or a supervisor, which is provided by 72.7 percent of employers. 34
41 Table 4.1: Nursing Assistants ( ) Wages It is Difficult to Find Workers? 100% Yes Mean $10.30 Why is It Difficult to Find Workers? Median $10.50 Lack of Work Experience 42.9% High $12.40 Poor Work History 100.0% Low $8.00 Lack of Occupation Specific Skills 14.3% Failed Background Check 85.7% Wage Demands Too High 28.6% Education Requirements Lack Required Licenses/Certificates 42.9% No minimum requirement 28.6% Language Barrier 0.0% High School Diploma/GED 42.9% Not enough applicants 85.7% Technical/Vocational Degree 28.6% Availability for shifts required 57.1% Associate Degree 0.0% Lack required education 28.6% Bachelor's Degree 0.0% Overqualified 0.0% Master's Degree or Higher 0.0% Citizenship/Work authorization 0.0% Additional requirements? (% Yes) Other 0.0% Special training required 87.5% Training Needs License required 42.9% Where is training provided? Certificate required 85.7% In-House 37.5% Out-of-House 37.5% Minimum work experience for position Both 25.0% No experience required 87.5% Type of Training Provided 6-mo related or less 0.0% Class But No Certification 12.5% 6-mo to 1 year 0.0% License 25.0% 1-2 years 12.5% Certification Course 50.0% 3-5 years 0.0% College of Community College Course 25.0% 5+ years 0.0% Training provided by others 62.5% N/A: No additional training provided 0.0% Other 12.5% 35
42 Table 4.2: Waiters and Waitresses ( ) Wages It is Difficult to Find Workers? 31.3% Yes Mean $5.11 Why is It Difficult to Find Workers? Median $3.00 Lack of Work Experience 60.0% High $10.00 Poor Work History 40.0% Low $2.00 Lack of Occupation Specific Skills 20.0% Failed Background Check 0.0% Wage Demands Too High 0.0% Education Requirements Lack Required Licenses/Certificates 0.0% No minimum requirement 100.0% Language Barrier 0.0% High School Diploma/GED 0.0% Not enough applicants 60.0% Technical/Vocational Degree 0.0% Availability for shifts required 40.0% Associate Degree 0.0% Lack required education 20.0% Bachelor's Degree 0.0% Overqualified 0.0% Master's Degree or Higher 0.0% Citizenship/Work authorization 0.0% Additional requirements? (% Yes) Other 0.0% Special training required 33.3% Training Needs License required 5.9% Where is training provided? Certificate required 5.9% In-House 94.4% Out-of-House 0.0% Minimum work experience for position Both 5.6% No experience required 82.4% Type of Training Provided 6-mo related or less 17.7% Class But No Certification 0.0% 6-mo to 1 year 0.0% License 5.3% 1-2 years 0.0% Certification Course 5.3% 3-5 years 0.0% College of Community College Course 0.0% 5+ years 0.0% Training provided by others 52.6% N/A: No additional training provided 26.3% Other 0.0% 36
43 Table 4.3: Retail Salesperson ( ) Wages It is Difficult to Find Workers? 68.8% Yes Mean $12.84 Why is It Difficult to Find Workers? Median $11.00 Lack of Work Experience 36.4% High $24.00 Poor Work History 36.4% Low $8.50 Lack of Occupation Specific Skills 9.1% Failed Background Check 18.2% Wage Demands Too High 18.2% Education Requirements Lack Required Licenses/Certificates 0.0% No minimum requirement 41.2% Language Barrier 9.1% High School Diploma/GED 52.9% Not enough applicants 90.9% Technical/Vocational Degree 5.9% Availability for shifts required 9.1% Associate Degree 0.0% Lack required education 9.1% Bachelor's Degree 0.0% Overqualified 0.0% Master's Degree or Higher 0.0% Citizenship/Work authorization 0.0% Additional requirements? (% Yes) Other 9.1% Special training required 43.8% Training Needs License required 12.5% Where is training provided? Certificate required 6.3% In-House 66.7% Out-of-House 0.0% Minimum work experience for position Both 33.3% No experience required 52.9% Type of Training Provided 6-mo related or less 29.4% Class But No Certification 23.5% 6-mo to 1 year 5.9% License 17.6% 1-2 years 5.9% Certification Course 11.8% 3-5 years 0.0% College of Community College Course 0.0% 5+ years 5.9% Training provided by others 70.6% N/A: No additional training provided 17.6% Other 5.9% 37
44 Table 4.4: Bookkeeping, Accounting, and Auditing Clerks ( ) Wages It is Difficult to Find Workers? 83.3% Yes Mean $14.33 Why is It Difficult to Find Workers? Median $14.00 Lack of Work Experience 50.0% High $30.00 Poor Work History 20.0% Low $10.00 Lack of Occupation Specific Skills 30.0% Failed Background Check 0.0% Wage Demands Too High 20.0% Education Requirements Lack Required Licenses/Certificates 0.0% No minimum requirement 25.0% Language Barrier 0.0% High School Diploma/GED 58.3% Not enough applicants 90.0% Technical/Vocational Degree 0.0% Availability for shifts required 0.0% Associate Degree 8.3% Lack required education 20.0% Bachelor's Degree 8.3% Overqualified 0.0% Master's Degree or Higher 0.0% Citizenship/Work authorization 0.0% Additional requirements? (% Yes) Other 10.0% Special training required 42.7% Training Needs License required 0.0% Where is training provided? Certificate required 0.0% In-House 75.0% Out-of-House 0.0% Minimum work experience for position Both 25.0% No experience required 27.3% Type of Training Provided 6-mo related or less 9.1% Class But No Certification 16.7% 6-mo to 1 year 18.2% License 0.0% 1-2 years 27.3% Certification Course 0.0% 3-5 years 18.2% College of Community College Course 0.0% 5+ years 0.0% Training provided by others 83.3% N/A: No additional training provided 8.3% Other 25.0% 38
45 Table 4.5: Customer Service Representative ( ) Wages It is Difficult to Find Workers? 80% Yes Mean $11.05 Why is It Difficult to Find Workers? Median $10.00 Lack of Work Experience 53.8% High $17.00 Poor Work History 38.5% Low $8.00 Lack of Occupation Specific Skills 30.8% Failed Background Check 15.4% Wage Demands Too High 38.5% Education Requirements Lack Required Licenses/Certificates 0.0% No minimum requirement 25.0% Language Barrier 0.0% High School Diploma/GED 68.8% Not enough applicants 84.6% Technical/Vocational Degree 6.3% Availability for shifts required 0.0% Associate Degree 0.0% Lack required education 0.0% Bachelor's Degree 0.0% Overqualified 38.5% Master's Degree or Higher 0.0% Citizenship/Work authorization 0.0% Additional requirements? (% Yes) Other 0.0% Special training required 58.8% Training Needs License required 5.9% Where is training provided? Certificate required 5.9% In-House 82.4% Out-of-House 0.0% Minimum work experience for position Both 17.7% No experience required 87.5% Type of Training Provided 6-mo related or less 6.3% Class But No Certification 29.4% 6-mo to 1 year 6.3% License 0.0% 1-2 years 0.0% Certification Course 11.8% 3-5 years 0.0% College of Community College Course 0.0% 5+ years 0.0% Training provided by others 82.4% N/A: No additional training provided 11.8% Other 5.9% 39
46 Table 4.6: Stock Clerk and Order Fillers ( ) Wages It is Difficult to Find Workers? 72.3% Yes Mean $10.45 Why is It Difficult to Find Workers? Median $10.50 Lack of Work Experience 0.0% High $14.00 Poor Work History 22.2% Low $8.00 Lack of Occupation Specific Skills 22.2% Failed Background Check 44.4% Wage Demands Too High 0.0% Education Requirements Lack Required Licenses/Certificates 0.0% No minimum requirement 54.6% Language Barrier 0.0% High School Diploma/GED 45.5% Not enough applicants 66.7% Technical/Vocational Degree 0.0% Availability for shifts required 0.0% Associate Degree 0.0% Lack required education 0.0% Bachelor's Degree 0.0% Overqualified 0.0% Master's Degree or Higher 0.0% Citizenship/Work authorization 0.0% Additional requirements? (% Yes) Other 11.1% Special training required 33.3% Training Needs License required 8.3% Where is training provided? Certificate required 8.3% In-House 81.8% Out-of-House 0.0% Minimum work experience for position Both 18.2% No experience required 72.7% Type of Training Provided 6-mo related or less 27.3% Class But No Certification 8.3% 6-mo to 1 year 0.0% License 0.0% 1-2 years 0.0% Certification Course 8.3% 3-5 years 0.0% College of Community College Course 0.0% 5+ years 0.0% Training provided by others 58.3% N/A: No additional training provided 16.7% Other 16.7% 40
47 Table 4.7: Welders, Cutters, Solderers, and Brazers ( ) Wages It is Difficult to Find Workers? 88.9% Yes Mean $12.89 Why is It Difficult to Find Workers? Median $12.50 Lack of Work Experience 75.0% High $18.00 Poor Work History 37.5% Low $9.00 Lack of Occupation Specific Skills 62.5% Failed Background Check 25.0% Wage Demands Too High 25.0% Education Requirements Lack Required Licenses/Certificates 37.5% No minimum requirement 77.8% Language Barrier 0.0% High School Diploma/GED 22.2% Not enough applicants 87.5% Technical/Vocational Degree 0.0% Availability for shifts required 12.5% Associate Degree 0.0% Lack required education 0.0% Bachelor's Degree 0.0% Overqualified 12.5% Master's Degree or Higher 0.0% Citizenship/Work authorization 0.0% Additional requirements? (% Yes) Other 0.0% Special training required 33.3% Training Needs License required 0.0% Where is training provided? Certificate required 44.4% In-House 88.9% Out-of-House 0.0% Minimum work experience for position Both 11.1% No experience required 22.2% Type of Training Provided 6-mo related or less 22.2% Class But No Certification 11.1% 6-mo to 1 year 44.4% License 0.0% 1-2 years 11.1% Certification Course 22.2% 3-5 years 0.0% College of Community College Course 0.0% 5+ years 0.0% Training provided by others 77.8% N/A: No additional training provided 11.1% Other 0.0% 41
48 Table 4.8: Heavy and Tractor-Trailer Truck Drivers ( ) Wages It is Difficult to Find Workers? 94.7% Yes Mean $17.26 Why is It Difficult to Find Workers? Median $15.00 Lack of Work Experience 63.2% High $37.50 Poor Work History 47.4% Low $10.50 Lack of Occupation Specific Skills 52.6% Failed Background Check 52.6% Wage Demands Too High 52.6% Education Requirements Lack Required Licenses/Certificates 68.4% No minimum requirement 42.1% Language Barrier 0.0% High School Diploma/GED 52.3% Not enough applicants 47.4% Technical/Vocational Degree 0.0% Availability for shifts required 15.8% Associate Degree 0.0% Lack required education 0.0% Bachelor's Degree 5.3% Overqualified 0.0% Master's Degree or Higher 0.0% Citizenship/Work authorization 5.3% Additional requirements? (% Yes) Other 21.1% Special training required 84.2% Training Needs License required 100.0% Where is training provided? Certificate required 40.0% In-House 79.0% Out-of-House 5.3% Minimum work experience for position Both 15.8% No experience required 10.5% Type of Training Provided 6-mo related or less 31.6% Class But No Certification 19.0% 6-mo to 1 year 15.8% License 33.3% 1-2 years 21.1% Certification Course 9.5% 3-5 years 10.5% College of Community College Course 0.0% 5+ years 10.5% Training provided by others 81.0% N/A: No additional training provided 14.3% Other 4.8% 42
49 Table 4.9: Laborers and Freight, Stock, and Material Movers, Hand ( ) Wages It is Difficult to Find Workers? 63.6% Yes Mean $10.21 Why is It Difficult to Find Workers? Median $10.00 Lack of Work Experience 14.3% High $12.00 Poor Work History 42.9% Low $8.00 Lack of Occupation Specific Skills 42.9% Failed Background Check 71.4% Wage Demands Too High 14.3% Education Requirements Lack Required Licenses/Certificates 14.3% No minimum requirement 72.7% Language Barrier 14.3% High School Diploma/GED 27.3% Not enough applicants 85.7% Technical/Vocational Degree 0.0% Availability for shifts required 14.3% Associate Degree 0.0% Lack required education 14.3% Bachelor's Degree 0.0% Overqualified 14.3% Master's Degree or Higher 0.0% Citizenship/Work authorization 14.3% Additional requirements? (% Yes) Other 14.3% Special training required 50.0% Training Needs License required 0.0% Where is training provided? Certificate required 10.0% In-House 100.0% Out-of-House 0.0% Minimum work experience for position Both 0.0% No experience required 100.0% Type of Training Provided 6-mo related or less 0.0% Class But No Certification 27.3% 6-mo to 1 year 0.0% License 0.0% 1-2 years 0.0% Certification Course 0.0% 3-5 years 0.0% College of Community College Course 0.0% 5+ years 0.0% Training provided by others 72.7% N/A: No additional training provided 9.1% Other 0.0% 43
50 5. CONCLUSION This report utilized the results of the Scottsbluff Survey of Hiring and Training Needs to evaluate satisfaction with the existing workforce, transition planning for employee retirement, challenges faced by businesses when hiring and the types of training employers provide. The survey also asked whether the availability of labor was a key factor influencing firm expansion. Business responses indicated that the availability of workers is a significant challenge with potential to slow economic growth in the Scottsbluff area. The challenge is somewhat greater for goodsproducing industries like manufacturing than for service-producing industries. Businesses expressed a fair degree of satisfaction with their current workforce, although there were areas of concern. Businesses consistently raised concerns about the leadership skills of their workforce. Other areas of concern included work ethic and an ability to pay attention to detail. While half of employers were somewhat or very concerned about replacing retiring workers, most firms had taken steps or planned to take steps to make these transitions, through a mix of training and promoting from within or hiring new workers. More generally, 73.8 percent of the time employers report that it is difficult to hire workers. The percentage is even higher in blue collar occupations such as installation, maintenance and repair workers, production workers, and transportation and material moving workers. The percentage is also higher in selected white collar occupations, including health care practitioners and technical support workers, business and financial operations workers and computer and mathematical workers. The difficulty of hiring is lower for two service occupations, food preparing and service related and office and administrative support. The primary reason for difficulty in hiring is a lack of applicants. Over three in four businesses report that it is difficult to hire because there are too few applicants. Two factors are likely contributing to this result. First, the Scottsbluff area is at full employment, implying that the supply and demand for workers is roughly in balance. Second, with baby boom age workers beginning to retire in larger numbers, there will be slow growth in the labor force. The implication is that most applicants come from a slower growing pool of employed workers. In health care occupations, there also is a significant problem with finding workers who are able to work required shifts. Beyond the number of applicants, employers also cite specific concerns about applicants which make it more difficulty to hire. More than half of responding businesses (53.8%) indicate that applicants lack work experience, while 43.8 percent report that applicants lack occupationspecific skills and 44.2 percent note applicants with a poor work history make it difficult to hire. About one-quarter of employers report it is difficult to hire because applicants have wage demands which are too high. Taken together, these issues represent a wide array of challenges 44
51 in hiring. However, a careful look at these issues by occupation reveal patterns. In particular, employers hiring within a particular occupation may only face one or two significant difficulties, creating a more manageable problem with potentially more actionable solutions. A lack of occupation specific skill is a particular concern for two white collar and two blue collar occupations. Among white collar jobs, the two occupations are computer and mathematical occupations and business and financial operations occupations. Among blue collar jobs, the two occupations are installation, maintenance and repair workers and construction and extraction workers. There may be a particular need to have training certification courses available in these industries. Workers in blue collar occupations also would benefit from learning skills on the job whether through formal apprenticeship programs or through periods of lower wage work as helpers and other support occupations. Poor work history and failed background checks are a more common concern for selected service and blue collar occupations. Among service jobs, the occupation is health care support workers. Among blue collar jobs, there is a heightened concern about work history and failed background checks for construction and extraction occupations and transportation and material moving occupations. These results point to a second set of interventions beyond traditional training programs. Particularly, some workers appear to have made themselves difficult to hire due to behaviors that led to a failed background check or a poor work history. One potential area for policy is to design and encourage pathways and practices whereby workers can improve their work history and address issues which are checked on background. Successful efforts in this regard could be very productive for workers and would benefit the business community. Wage rates also appear to be a barrier to hiring in a third set of occupations. Businesses hiring in select occupations reported that a large share of applicants had wage expectations which were too high. These occupations were personal care and service workers, construction and extraction workers and transportation and material moving workers. In these occupations, employees, employers, or both need to adjust their wage expectations. The second goal of this report is to examine the training which businesses provide to newly hired workers. Respondents to the survey report that businesses provide job-specific training to newly hired workers in 87.6 percent of occupations. Of businesses which provide training, 17.1 percent of employers provide training courses without a certification while 18.1 percent provide certification courses. While 8.7 percent of employers provide licensing courses while 4.8 percent provide a full college or community college course. Four-fifths of employers also provide on the job training; for example, by pairing new workers with a mentor. Large shares of new hires are provided training in all industries and occupations. Nearly all workers who received training participate in in-house training. However, responding businesses 45
52 indicate that out-of-house training is provided to new workers in approximately one-third of the time. Generally speaking, training course are slightly less common in blue collar occupations while full certification courses are most common for health care support occupations, installation, maintenance and repair occupations, and computer and mathematical occupations. 46

53 APPENDIX 1: SCOTTSBLUFF SURVEY OF HIRING AND TRAINING NEEDS 47
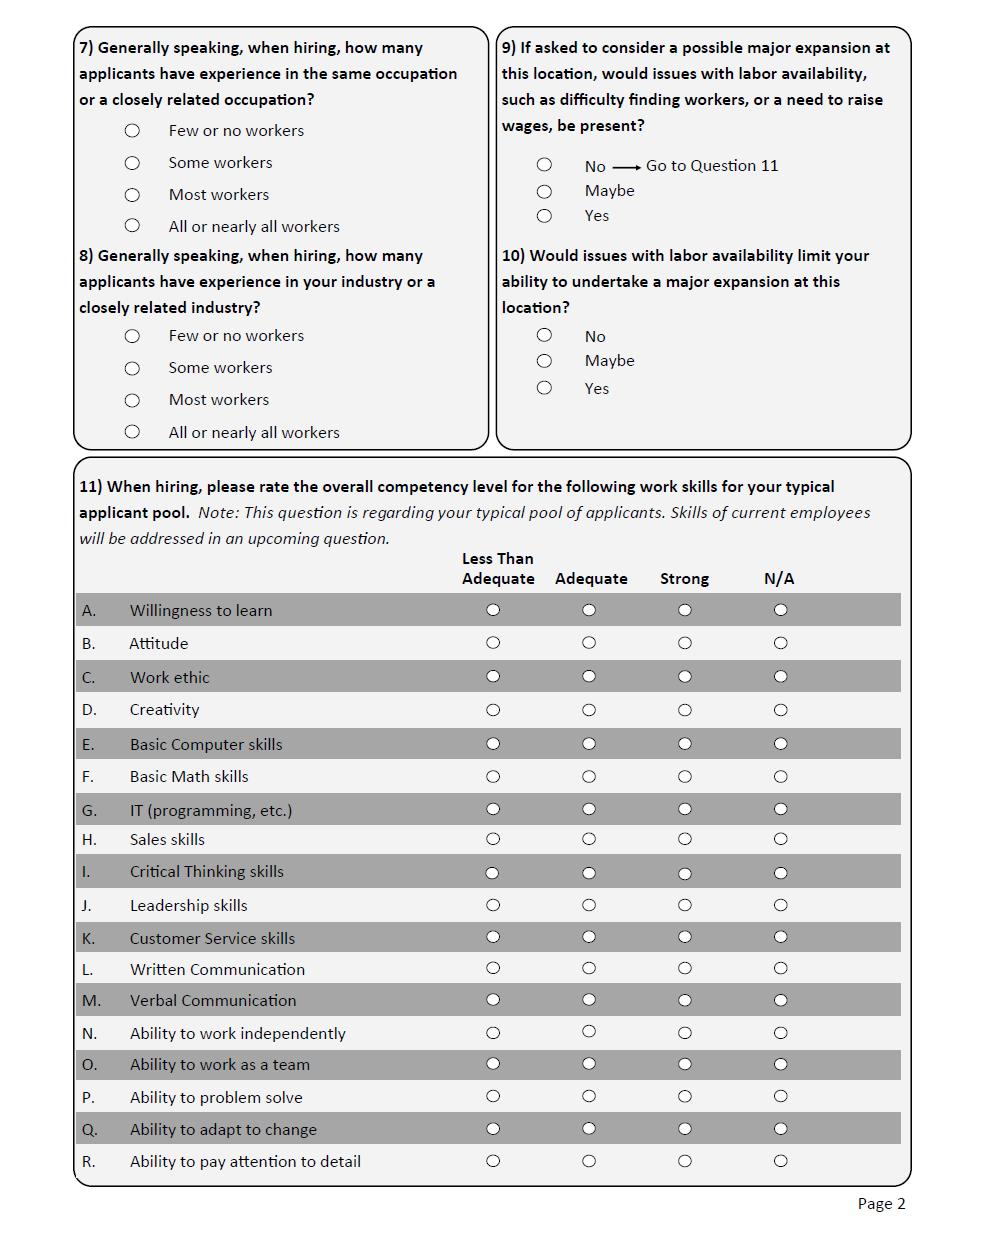
54 48
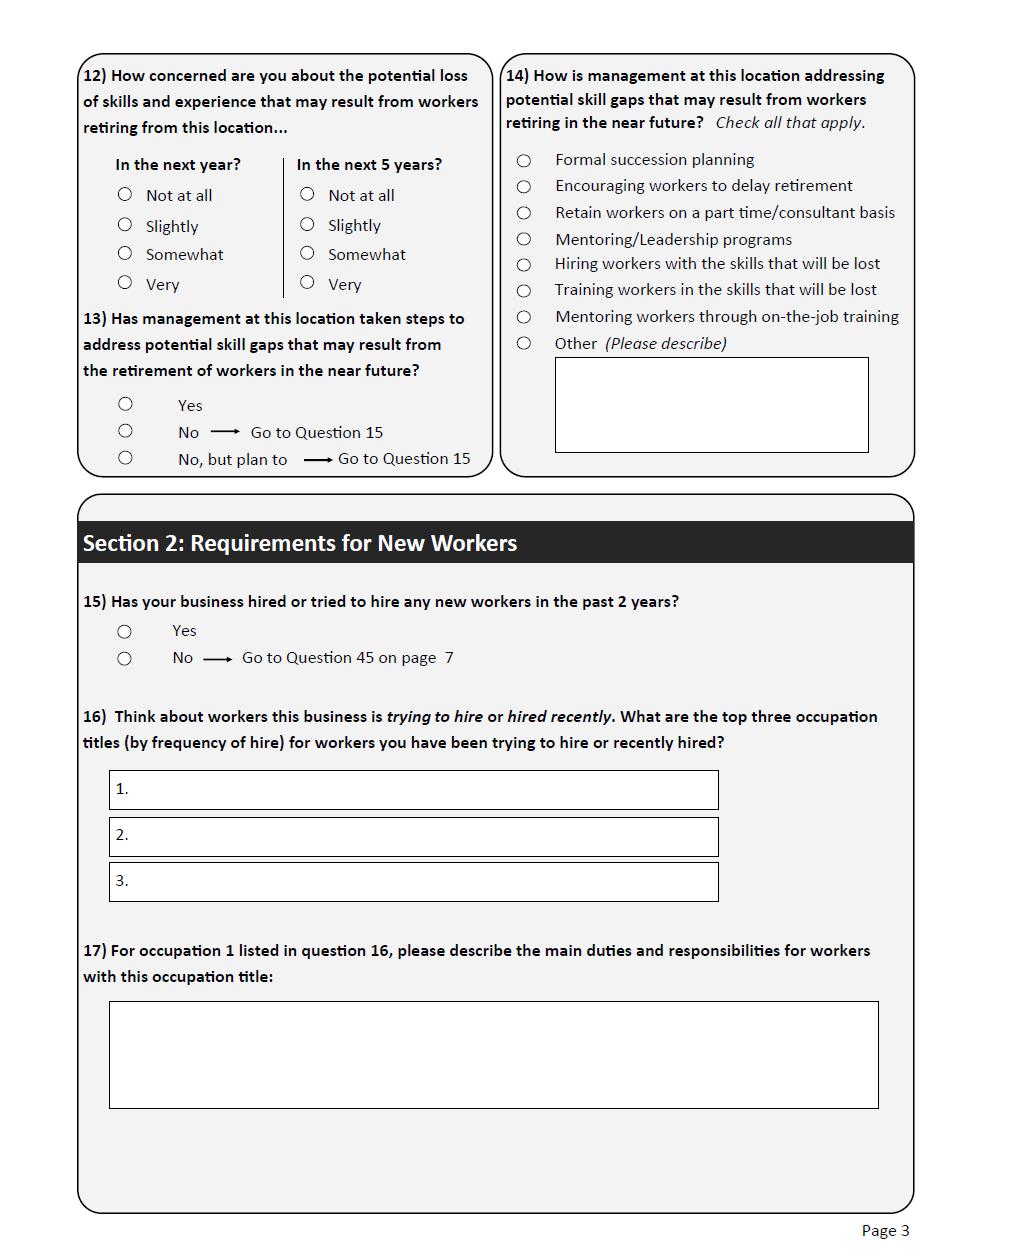
55 49
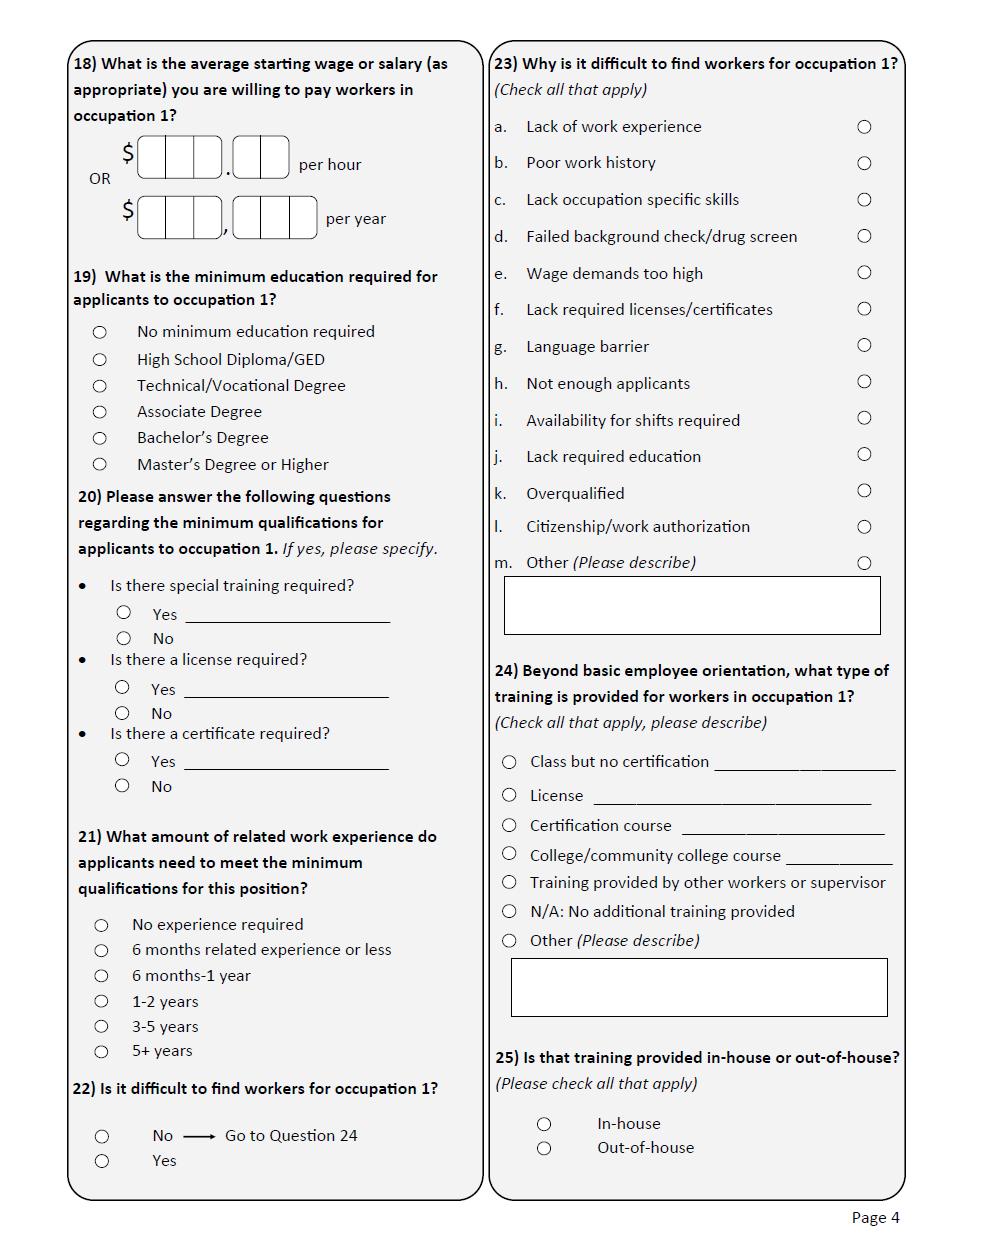
56 50
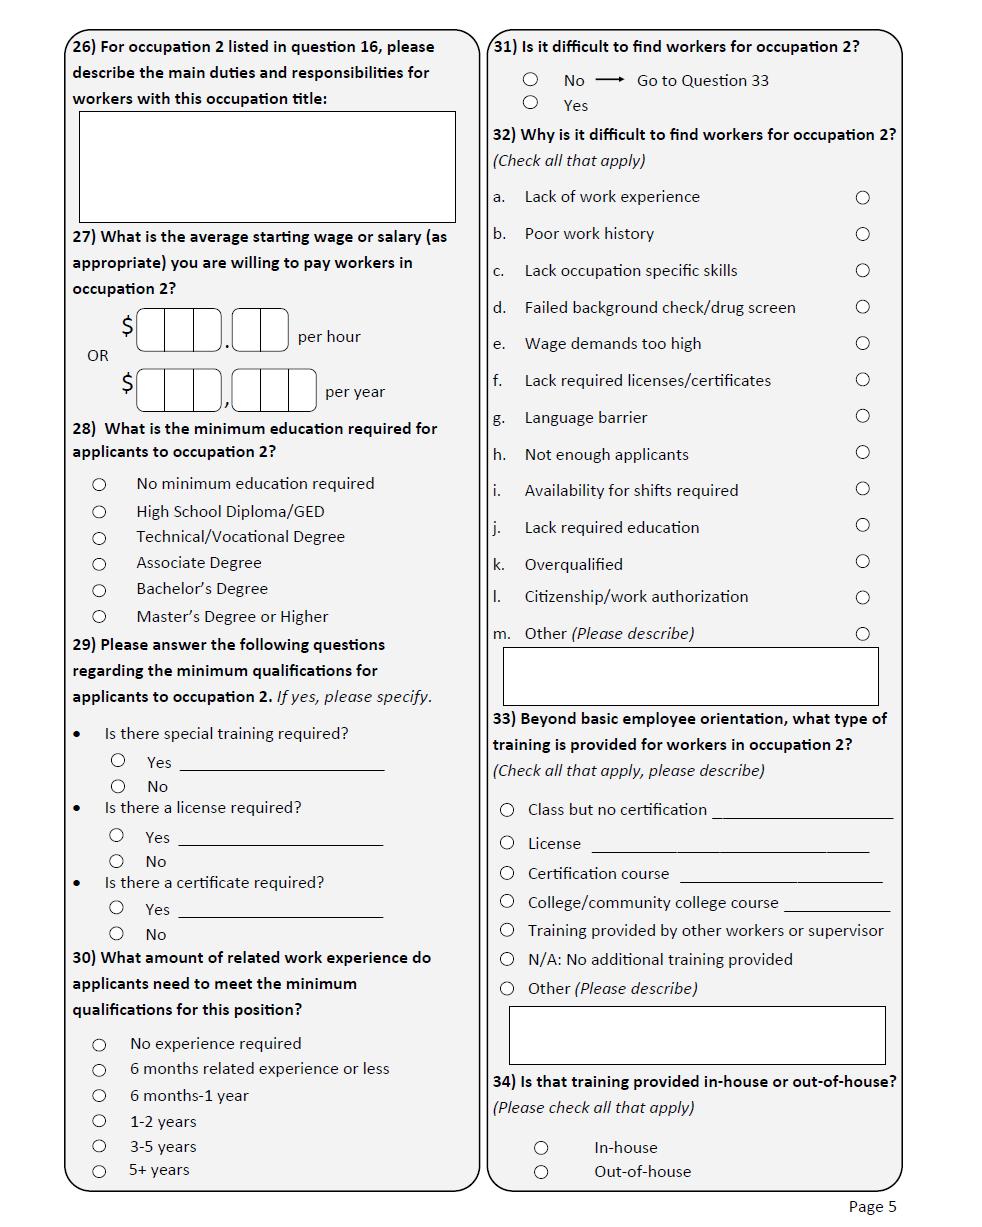
57 51
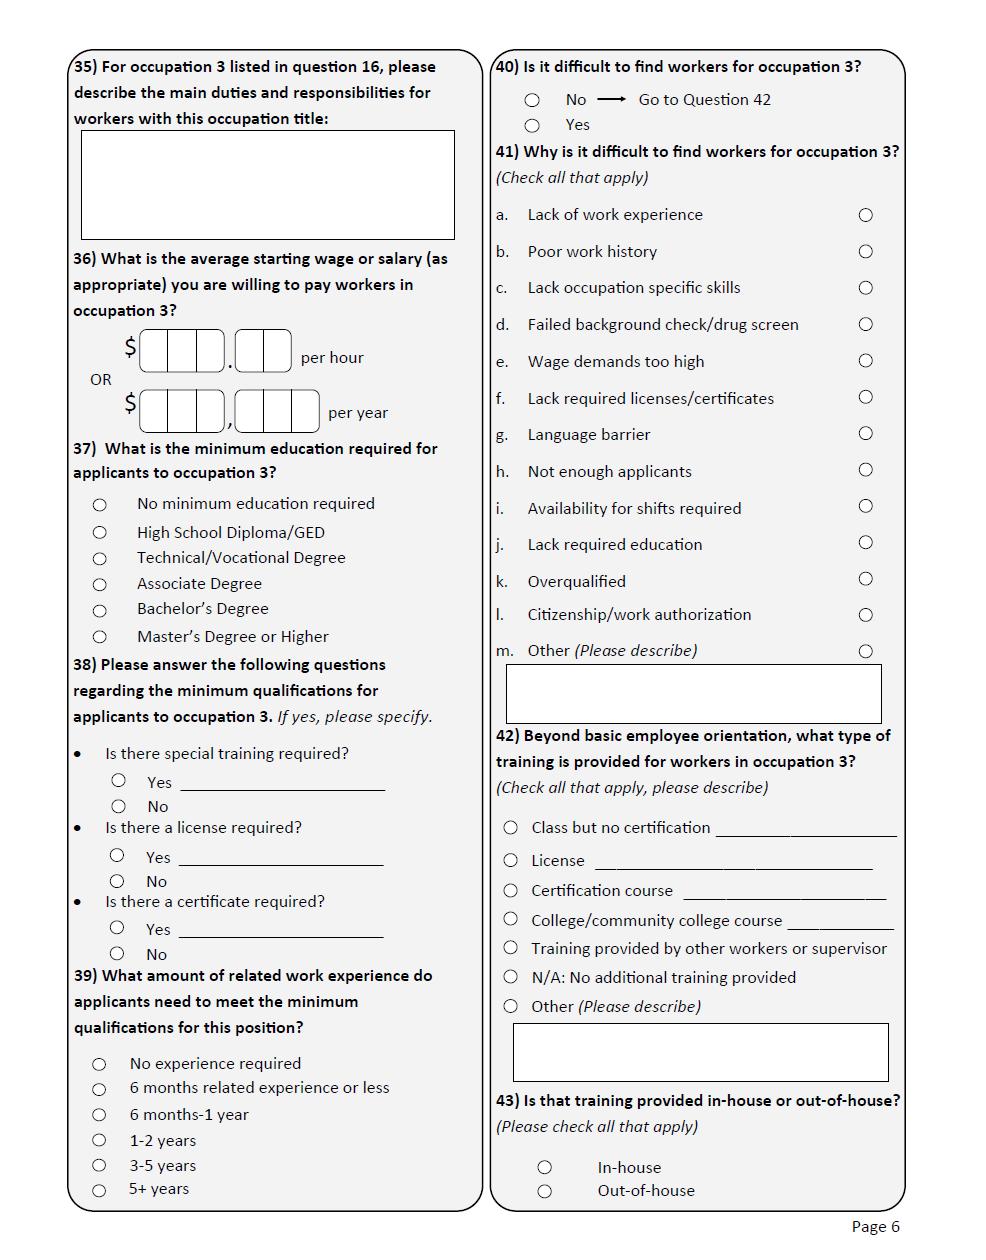
58 52
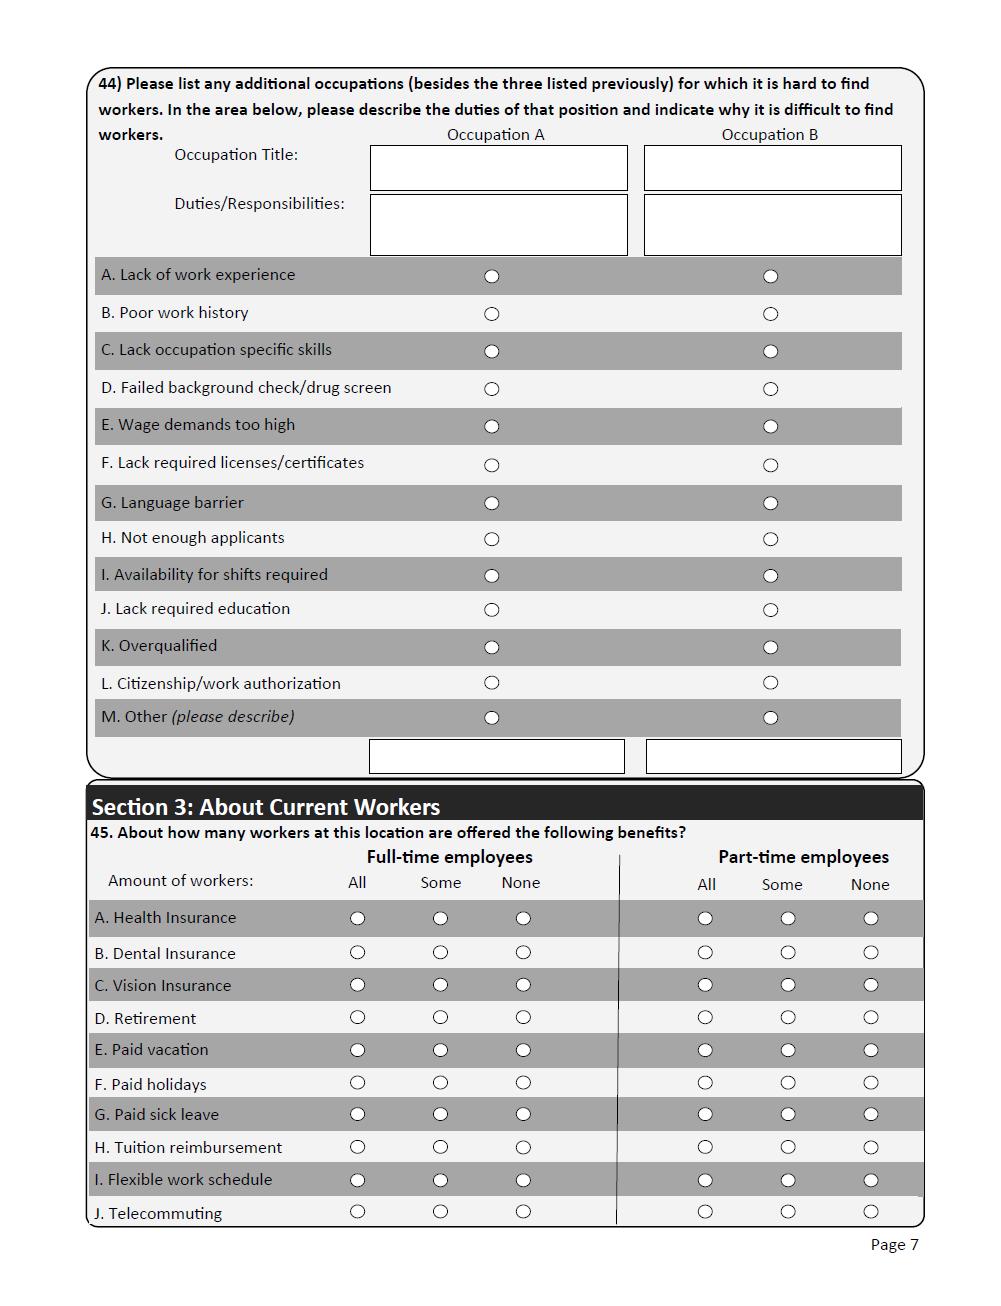
59 53
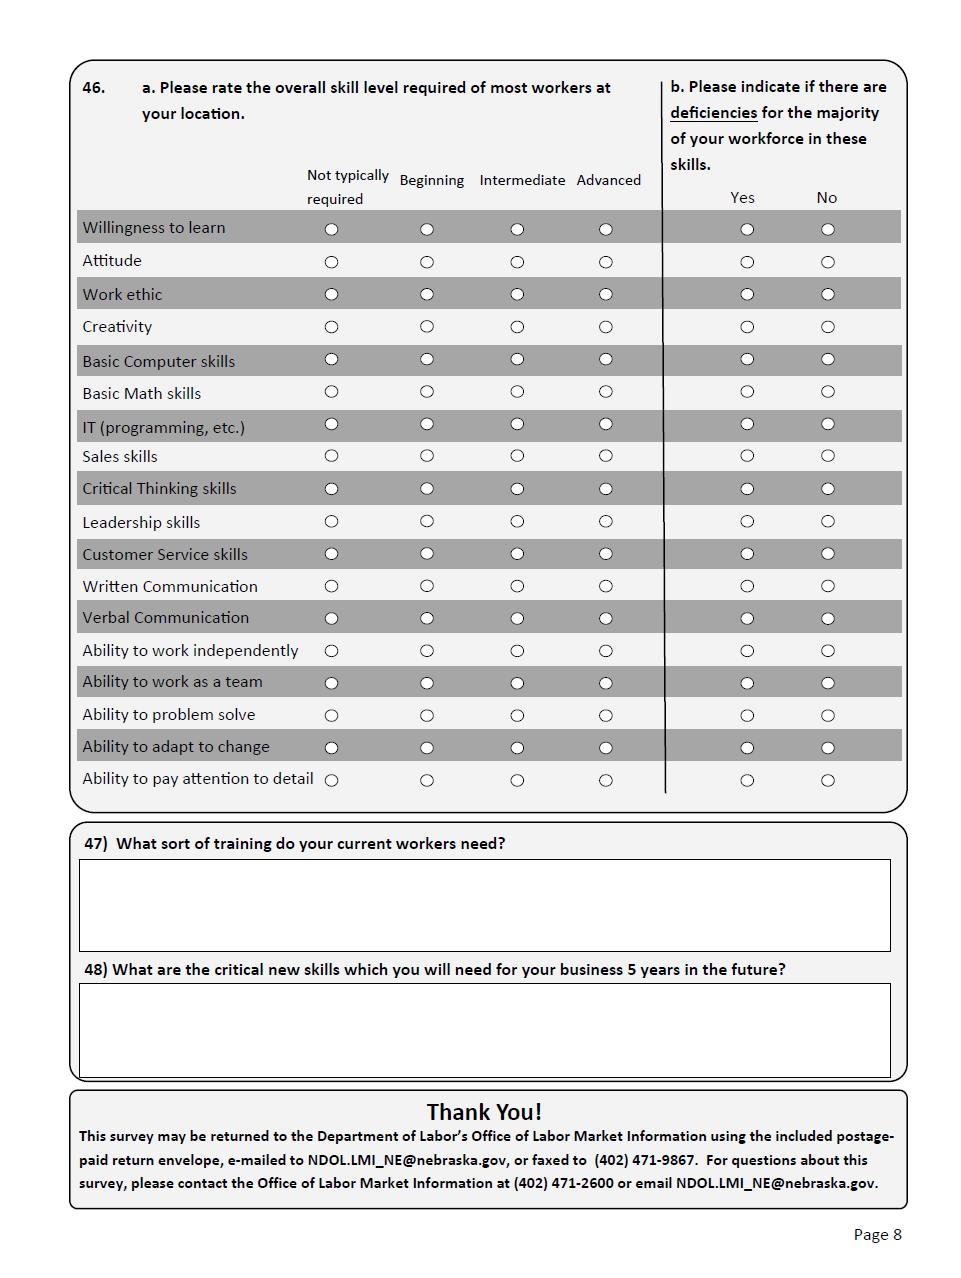
60 54
FINAL REPORT. Survey of Omaha Businesses about Skill and Training Requirements. A Bureau of Business Research Report From the UNL College of Business
 A Bureau of Business Research Report From the UNL College of Business FINAL REPORT Survey of Omaha Businesses about Skill and Training Requirements Prepared for The Nebraska Department of Labor Prepared
Survey of Lincoln Area Businesses about Skill and Training Requirements
 University of Nebraska - Lincoln DigitalCommons@University of Nebraska - Lincoln Bureau of Business Research Publications Bureau of Business Research 12-4-2014 Survey of Lincoln Area Businesses about Skill
Skilled Jobs in Pierce County: Gaps & Opportunities
 Skilled Jobs in Pierce County: Gaps & Opportunities at a Glance Winter 2018 Partnering in pursuit of GREATER ECONOMIC VITALITY FOR ALL. Table of Contents Overview... 3 What are Skilled Jobs?... 4 The State
Regional Prosperity Initiative: Labor Market Information Supplement
 Regional Prosperity Initiative: Labor Market Information Supplement Prepared For: (Region 8) (Berrien, Branch, Calhoun, Cass, Kalamazoo, St. Joseph, and Van Buren) Prepared By: State of Michigan Department
Regional Prosperity Initiative: Labor Market Information Supplement
 Regional Prosperity Initiative: Labor Market Information Supplement Prepared For: (Region 1) (Alger, Baraga, Chippewa, Delta, Dickinson, Gogebic, Houghton, Iron, Keweenaw, Luce, Mackinac, Marquette, Menominee,
Greater Spokane Talent Alignment Survey: Preliminary Report. Submitted December Dan Ash PhD Megan Church- Nally PhD Matt Bergman PhD 1
 Greater Spokane Talent Alignment Survey: Preliminary Report Submitted December 2016 Dan Ash PhD Megan Church- Nally PhD Matt Bergman PhD 1 GREATER SPOKANE TALENT ALIGNMENT SURVEY The Greater Spokane Talent
Q1 How many employees does your company currently employ? Q2 How many hours worked per week does your organization consider to be full-time?
 Q How many employees does your company currently employ? Answered: Skipped: Average Number Total Number Full-time Part-time Seasonal/Temporary 66 2,85 29 4 4,85 2 46,885 95 Total Respondents: Q2 How many
Kansas Automotive Manufacturing and Services
 2008 Kansas Automotive Manufacturing and Services Center for Economic Development and Business Research W. Frank Barton School of Business Wichita State University September 2008 1 Kansas Automotive Manufacturing
Occupational Insights Report Hartford County. February, 2015
 Occupational Insights Report Hartford County February, 2015 Occupational Insights Report (1) Contents and Online Postings in Hartford County... 3 Highlights Hartford County... 3 Industry Overview... 4
Human Resources, Culture, and Diversity
 SLIDE 1 C H A P T E R 8 Human Resources, Culture, and Diversity 8-1 Human Resources Basics 8-2 Managing Human Resources 8-3 Organizational Culture and Workforce Diversity 8-1 Human Resources Basics Goal
Manufacturing Workforce Survey Results. November 2012
 Manufacturing Workforce Survey Results November 2012 Table of Contents Introduction & Methodology 3 Key Findings....... 5 Detailed Findings... 10 Respondent Profile 11 Current Workforce Climate 12 Manufacturing
Kentuckiana Occupational Outlook Projected Occupational Growth,
 Kentuckiana Occupational Outlook Occupational, 2008-2018 by Barry Kornstein Research Manager College of Business University of Louisville June 2010 Researchers at the University of Louisville have produced
Thank you for an outstanding year and supporting our existing Iowa employers.
 December 2016 Iowa is a leader in business retention and expansion programming. The collaboration and coordination between economic development professionals, utilities, community colleges and many others
SURVEY OBSERVATIONS BRUCE GREY HURON PERTH
 SURVEY OBSERVATIONS 20 18 BRUCE GREY HURON PERTH II Acknowledgements Four County Labour Market Planning Board (FCLMPB) is a community-directed, not-for-profit corporation assisting Bruce, Grey, Huron,
Finding Employment Success After Graduation
 Finding Employment Success After Graduation Luke Greiner Regional Labor Market Analyst Department of Employment and Economic Development Labor Market Information Office http://mn.gov/deed/data/ Trial
Occupational Insights Report Hartford County. First Quarter, 2017
 Occupational Insights Report Hartford County First Quarter, 2017 Occupational Insights Report Contents Jobs Growth and Online Postings in Hartford County... 3 U.S. Help Wanted Online Trend... 3 Highlights
REGIONAL WORKFORCE PROFILE
 REGIONAL WORKFORCE PROFILE Lake of the Ozarks Regional Economic Development Council Camden County Miller County Morgan County NOVEMBER 2016 Table of Contents Topic Page Purpose 2 Executive Summary 3 Overview
Bottleneck Vacancies in Bulgaria
 Bottleneck Vacancies in Bulgaria Health care, ICT and manufacturing sectors affected The majority of vacancies exist within health care, IT sector and manufacturing. Since 2008 the vacancies have decreased
The San Gorgonio Pass Business Survey 2010
 The San Gorgonio Pass Business Survey 2010 Prepared by the San Gorgonio Pass Economic Development Association, City of Beaumont, Riverside County Economic Development Agency, Riverside County Workforce
2013 Green-Economy Jobs Report
 Published September 2014 Washington State Dale Peinecke, commissioner Labor Market and Performance Analysis Cynthia Forland, Ph.D., director Report and charts prepared by Gustavo Aviles and Ernst W. Stromsdorfer,
19 th Annual. New Mexico Data User s Conference. November 16, 2017
 19 th Annual New Mexico Data User s Conference November 16, 2017 Economic Research & Analysis Bureau Ashley Leach, Economist Rachel Moskowitz, Bureau Chief Presentation Agenda Introducing the Economic
A TARGETED APPROACH TO APPRENTICESHIP
 A TARGETED APPROACH TO APPRENTICESHIP BUSINESS ENGAGEMENT This resource guide targets state and local business outreach, workforce development, education, and apprenticeship professionals who work with
EXECUTIVE MEMO BACKGROUND. Key Findings from East Stroudsburg University s Workforce Region Workforce Needs Assessment,
 OFFICE OF THE CHANCELLOR EXECUTIVE MEMO Key Findings from East Stroudsburg University s Workforce Region Workforce Needs Assessment, 2016 2026 1 BACKGROUND Pennsylvania s State System for Higher Education
THE NEW TALENT LANDSCAPE RECRUITING DIFFICULTY AND SKILLS SHORTAGES
 THE NEW TALENT LANDSCAPE RECRUITING DIFFICULTY AND SKILLS SHORTAGES KEY FINDINGS HR professionals across industries are reporting a more challenging market for talent in 2016 compared with 2013. The health
A TARGETED APPROACH TO APPRENTICESHIP
 A TARGETED APPROACH TO APPRENTICESHIP BUSINESS ENGAGEMENT This resource guide targets state and local business outreach, workforce development, education, and apprenticeship professionals who work with
ENTRY-LEVEL JOBS IN THE NYC INFORMATION TECHNOLOGY LABOR MARKET
 ENTRY-LEVEL JOBS IN THE NYC INFORMATION TECHNOLOGY LABOR MARKET A LABOR MARKET PROFILE PREPARED BY THE FISCAL POLICY INSTITUTE JULY 18, 2002 Overview Despite numerous local economic development studies
The manufacturing sector,
 Finding Work: New Career s in an Evolving Labor Market Timothy F. Slaper, Ph.D.: Director of Economic Analysis, Indiana Business Research Center, Indiana University Kelley School of Business The manufacturing
RETAIL TRADE Workforce Demographics
 RETAIL TRADE Workforce Demographics Maryland Department of Labor, Licensing and Regulation Division of Workforce Development Office of Workforce Information and Performance 1100 N. Eutaw Street, Room 316
The value of apprentices. A report for the Association of Accounting Technicians March 2014
 The value of apprentices A report for the Association of Accounting Technicians March 2014 Disclaimer Whilst every effort has been made to ensure the accuracy of the material in this document, neither
OLDER WORKER EMPLOYMENT ATTITUDE RESEARCH
 OLDER WORKER EMPLOYMENT ATTITUDE RESEARCH Final Report December, 2003 Prepared for: Older Worker Pilot Projects Initiative Charlottetown, Prince Edward Island in association with Charlottetown Prince Edward
GREATER PHILADELPHIA REGIONAL LABOR MARKET SURVEY RESULTS
 GREATER PHILADELPHIA REGIONAL LABOR MARKET SURVEY RESULTS EXECUTIVE SUMMARY GREATER PHILADELPHIA REGIONAL LABOR MARKET SURVEY RESULTS In 2013, the CEO Council for Growth (CEO Council), an initiative of
Economic Growth Region 10 Statistical Data Report for June 2018, Released August 2018
 Economic Growth Region 10 Statistical Data Report for June 2018, Released August 2018 State Employment and Unemployment Economic Growth Region (EGR) 10 Clark, Crawford, Floyd, Harrison, Scott, and Washington
Workforce Innovation and Opportunity Act (WIOA) Regional Plan
 Regional Plan") ! Workforce Innovation and Opportunity Act (WIOA) Regional Plan Kansas Local Area I and IV! 1 PY16 Regional Plan Signature Page Local Area I and V Four Year Regional Plan Agreement July 1, 2017 Pursuant
! Workforce Innovation and Opportunity Act (WIOA) Regional Plan Kansas Local Area I and IV! 1 PY16 Regional Plan Signature Page Local Area I and V Four Year Regional Plan Agreement July 1, 2017 Pursuant
Labour Market Information
 Our third annual Building Connections event Labour Market Information 101 FOR EMPLOYERS OttawaEmploymentHub.ca This program is funded in part by the Government of Canada and the Government of Ontario We
Region One Workforce Investment Board Partnership. Region One Priority Industry Sectors
 Region One Priority Industry Sectors Executive Summary The four priority target sectors selected by Region one includes: Construction (NAICS 236 238, excluding Residential) Manufacturing (NAICS 324-333),
Occupational Insights Report Hartford County. Third Quarter, 2016
 Occupational Insights Report Hartford County Third Quarter, 2016 Occupational Insights Report Contents Jobs Growth and Online Postings in Hartford County... 3 U.S. Help Wanted Online Trend... 3 Highlights
The Central Wisconsin Job Situation: What types of jobs have been created, and what does the future hold for our area?
 The Central Wisconsin Job Situation: What types of jobs have been created, and what does the future hold for our area? By: John Westbury, Regional Economist Wisconsin Department of Workforce Development
Supplemental Survey Report More Manufacturers Looking to Add Staff, Struggling to Find Qualified Workers
 / Supplemental Survey Report More Manufacturers Looking to Add Staff, Struggling to Find Qualified Workers Supplementary questions in the Empire State Manufacturing Survey and focused on expected changes
Industry, Employment, and Skills in a Time of Transition: An Employment Forecast for Santa Barbara County
 Industry, Employment, and Skills in a Time of Transition: An Employment Forecast for Santa Barbara County Conducted for the Santa Barbara County Workforce Investment Board February 2012 2725 JEFFERSON
Job Retention and Skills Analysis among Newly Hired Workers in Montana
 Job Retention and Skills Analysis among Newly Hired Workers in Montana Presented at the C2ER/LMI Institute Annual Conference June 10 th, 2015 Amy Watson Economist MT Dept. of Labor and Industry Hiring
Employment and Wage Trends 3 rd Quarter 2015 for the Construction Sector by Parish
 Construction Sector Profile for New Orleans RLMA The Labor Market information (LMI) division of Research and Statistics helps provide information on various sectors in the regional economy. Reports and
EXECUTIVE MEMO BACKGROUND. Key Findings from Central Pennsylvania s State System s Workforce Needs Assessment,
 OFFICE OF THE CHANCELLOR EXECUTIVE MEMO BACKGROUND Key Findings from Central Pennsylvania s State System s Workforce Needs Assessment, 2016 2026 1 Pennsylvania s State System for Higher Education recently
SHRM Research Overview: Talent Acquisition. SHRM Research Overview: Talent Acquisition
 SHRM Research Overview: Talent Acquisition SHRM Research Overview: Talent Acquisition HR professionals are undoubtedly in the midst of a challenging period for talent acquisition. Job creation was strong
Northwest Indiana Hiring Needs ( )
") Hiring Needs of Northwest Indiana 2013 to 2018 About our forecast: The job opening estimates contained in this report come from the Indiana Department of Workforce Development Long-Term Occupational Projections
Hiring Needs of Northwest Indiana 2013 to 2018 About our forecast: The job opening estimates contained in this report come from the Indiana Department of Workforce Development Long-Term Occupational Projections
Kansas Advanced Manufacturing
 2008 Kansas Advanced Manufacturing Center for Economic Development and Business Research W. Frank Barton School of Business Wichita State University August 2008 1 Kansas Advanced Manufacturing Summary
The Greening of Louisiana s Economy Summary of Survey Results
 The Greening of Louisiana s Economy Summary of Survey Results Louisiana Workforce Commission www.lmi.laworks.net/green September 2011 In 2009, Louisiana and Mississippi partnered to research economic development
Why Staff Leave and How to Keep Them. Presented By: Eric Scharber
 Why Staff Leave and How to Keep Them Presented By: Eric Scharber Background on Exact Recruiting We have been recruiting in this industry since 2005 (some on my team longer). Exact has placed over 1,500
Economic Impact of the North Dakota Forest Service
 University of Nebraska - Lincoln DigitalCommons@University of Nebraska - Lincoln Bureau of Business Research Publications Bureau of Business Research 9-12-2011 Economic Impact of the North Dakota Forest
WIOA EMPLOYMENT TRAINING PROGRAMS & SECTOR STRATEGIES
 WIOA EMPLOYMENT TRAINING PROGRAMS & SECTOR STRATEGIES North Central Wisconsin Workforce Solutions Summit September 13, 2017 Rene Daniels, Executive Director North Central Wisconsin Workforce Development
Preparing for Career Success in Business, Management and Administration
 CAREER CLUSTERS FOCUSING Preparing for Career Success in Business, Management and Administration Career Clusters Prepare All Students for College, Technical Training and Careers Career Clusters prepare
Kentuckiana Occupational Outlook Projected Occupational Growth,
 Kentuckiana Occupational Outlook Occupational Growth, 2010-2020 by Barry Kornstein Research Manager Urban Studies Institute University of Louisville January 2013 R esearchers at the University of Louisville
High concern from employers on skills
 High concern from employers on skills The NSW Business Chamber s inaugural Workforce Skills Survey has found that member businesses are highly concerned about the impact of skills shortages on their future
2018 THE HIGH COST OF LOW PAY RATES Survey Findings and Recommendations 1 PRIDESTAFF: 2018 HIGH COST OF LOW PAY RATES
 1 PRIDESTAFF: 2018 HIGH COST OF LOW PAY RATES 2018 THE HIGH COST OF LOW PAY RATES Survey Findings and Recommendations ABOUT PRIDESTAFF PrideStaff gets tens of thousands of people working every year. For
TRANSPORTATION, DISTRIBUTION, & LOGISTICS OCCUPATION GROUP
 Q1 2017 January -March TRANSPORTATION, DISTRIBUTION, & LOGISTICS OCCUPATION GROUP Southeast Michigan Transportation, Distribution, and Logistics (TDL) Introduction Online Job Postings Transportation, distribution,
EXECUTIVE MEMO BACKGROUND. Key Findings from Shippensburg University s Workforce Region Workforce Needs Assessment,
 OFFICE OF THE CHANCELLOR EXECUTIVE MEMO BACKGROUND Key Findings from Shippensburg University s Workforce Region Workforce Needs Assessment, 2016 2026 1 Pennsylvania s State System for Higher Education
ECONOMIC PROFILE NESA
 ECONOMIC PROFILE NESA S.C. Department of Employment & Workforce Labor Market Information 1550 Gadsden Street, PO Box 995 Columbia, SC 29202 803-737-2660 www.scworkforceinfo.com http://www.nesasc.org/ Updated:
Alberta Ministry of Labour 2017 Alberta Wage and Salary Survey (AWSS)
") 1 Alberta Ministry of Labour 2017 Alberta Wage and Salary Survey (AWSS) The Alberta Wage and Salary Survey is undertaken by the Alberta Ministry of Labour to provide current wage rates and skill shortage
1 Alberta Ministry of Labour 2017 Alberta Wage and Salary Survey (AWSS) The Alberta Wage and Salary Survey is undertaken by the Alberta Ministry of Labour to provide current wage rates and skill shortage
MIDDLE-INCOME JOB DECLINE IN PENNSYLVANIA
 MIDDLE-INCOME JOB DECLINE IN PENNSYLVANIA Update 2001-13: Business-Cycle, Great Recession and Recovery Prepared at the Center for Economic and Community Development by: Theodore R. Alter, Regional Economist
Talent Management and Rewards Survey. U.S. Report
 2012 2013 Talent Management and Rewards Survey U.S. Report 2012 2013 Talent Management and Rewards Survey U.S. Report Table of Contents Introduction Ensuring Workers Get What They Need, While Organizations
SMALL BUSINESS JOBS REPORT
 THE MEGAPHONE OF MAIN STREET: SMALL BUSINESS JOBS REPORT Small Businesses and Employment presented by FALL 2017 Contact SCORE: media@score.org 703.487.3677 www.score.org TABLE OF CONTENTS Executive Summary...2
Overcoming Workforce Challenges With Strategic Compensation Initiatives. Theresa M. Worman Executive Vice President
 Overcoming Workforce Challenges With Strategic Compensation Initiatives Theresa M. Worman Executive Vice President INTRODUCTION Workforce planning aligns the needs and priorities of the organization with
Labour Market Information
 Labour Market Information 101 FOR EMPLOYMENT SERVICE PROVIDERS OttawaEmploymentHub.ca This program is funded in part by the Government of Canada and the Government of Ontario We will discuss: What is LMI?
The Presidential Management Fellows Program
 The Presidential Management Fellows Program PERSPECTIVES FROM THE CLASS OF 2011 INTRODUCTION The Presidential Management Fellows (PMF) program was created to attract to federal service outstanding men
Computer Cluster Collaborative Labor Market Research
 Parent District Survey Executive Summary Carlsbad Unified School District Orange County Workforce Investment Board Linking Business & People Computer Cluster Collaborative Labor Market Research REPORT
Bottleneck Vacancies in the Czech Republic
 Bottleneck Vacancies in the Czech Republic Bottlenecks appearing in the construction and manufacturing sectors Difficulties with recruitment are reported only by 14% of employers (based on a survey published
The State of Workforce In The Finger Lakes
 The State of Workforce In The Finger Lakes A comprehensive report on current and future workforce trends in Ontario, Seneca, Yates and Wayne counties April 2018 Finger Lakes Workforce Investment Board,
Liverpool City Region. Employer Skills Survey
 Liverpool City Region Employer Skills Survey Background Background The 2017 Liverpool City Region Combined Authority Employer Skills Survey surveyed 1,856 businesses across the City Region between June
For more info, please visit us online at:
 About the 2013 Research The 2013 Allied Workforce Mobility Survey, conducted in April 2013, captures the voice of HR professionals on critical topics relating to workforce mobility, which is defined as
Umatilla County Skilled Workforce Needs STUDY HIGHLIGHTS
 Umatilla County Skilled Workforce Needs STUDY HIGHLIGHTS MISSION To connect with employers to better understand the workforce challenges & successes, to identify opportunities to contribute toward solutions,
Business in Nebraska
 Business in Nebraska VOLUME 64 NO. 694 PRESENTED BY THE UNL BUREAU OF BUSINESS RESEARCH (BBR) APRIL 2009 PRODUCER SERVICES: AN ENGINE FOR JOB GROWTH By Steve Carlson, Hanna Hartman, and Eric Thompson Introduction
Warwickshire County Council: DRAFT Position Statement on Skills Priorities (April 2010)
") Warwickshire County Council: DRAFT Position Statement on Skills Priorities (April 2010) 1. Existing Skills Priorities The strategic approach to skills within Warwickshire is currently guided by the Sub-
Warwickshire County Council: DRAFT Position Statement on Skills Priorities (April 2010) 1. Existing Skills Priorities The strategic approach to skills within Warwickshire is currently guided by the Sub-
2015 Virginia Workforce Development Survey. Prepared by VCU
 2015 Virginia Workforce Development Survey Prepared by CURA @ VCU June 20, 2016 Page left intentionally blank Virginia Job Vacancy Survey Prepared for Virginia Employment Commission Report prepared by
Improving the Employee Experience
 BESTPLACESTOWORK.ORG 2014 BEST PLACES TO WORK IN THE FEDERAL GOVERNMENT ANALYSIS Improving the Employee Experience What agencies and leaders can do to manage talent better When asked in a federal survey
EXECUTIVE MEMO BACKGROUND. Key Findings from the Tri-State Energy Region Workforce Needs Assessment, MAP OF THE TRI-STATE ENERGY REGION
 OFFICE OF THE CHANCELLOR EXECUTIVE MEMO BACKGROUND Key Findings from the Tri-State Energy Region Workforce Needs Assessment, 2016 2026 1 Pennsylvania s State System for Higher Education recently completed
Leadership/Management Occupations
 Leadership/Management s Riverside-San Bernardino-Ontario MSA Please see page 6 of this document for Leadership/Management occupation definitions and alternative job titles. Job Opportunities In the Riverside-San
IT Industry Survey: Exploring the IT Skills Gap
 IT Industry Survey: Exploring the IT Skills Gap To examine the IT skills gap and identify areas where it impacts the organization, TEKsystems surveyed over 1,300 IT leaders and IT professionals on their
AMEREN S AREA MANUFACTURERS ASSESSMENT
 AMEREN S AREA MANUFACTURERS ASSESSMENT AND FRANKLIN COUNTY, MISSOURI ASSESSMENT OF LABOR MARKET QUALITY Research Conducted and Prepared by: THE GROWTH SERVICES GROUP P.O. Box 105093 Jefferson City, MO
Skilled Workforce and Labor Availability
 Skilled Workforce and Labor Availability Logistics Park Kansas City is located in the Southwest Johnson County Kansas community of Edgerton which is approximately 30 minutes from downtown Kansas City,
Supporting our Wealth Driving Sectors: Demand for Technical Talent in Central Indiana
 Supporting our Wealth Driving Sectors: Demand for Technical Talent in Central Indiana Executive summary Hire UP Indy is a collaborative effort to align Central Indiana s education resources with the talent
BUILDING AMERICA S MIDDLE SKILLS WORKFORCE
 BUILDING AMERICA S MIDDLE SKILLS WORKFORCE Joseph B. Fuller, Harvard Business School 13 th Annual Indiana Logistics Summit September 21-22, 2015 P 1 SIGNS OF TROUBLE: DECLINING SHARE OF ROUTINE OCCUPATIONS
STRATEGIC PLAN. Final Report 4/24/17
 STRATEGIC PLAN Final Report 4/24/17 NORTHEASTERN WORKFORCE DEVELOPMENT BOARD (NWDB) PLAN - Final Report 4/24/17 Page 2 Table of Contents Introduction...4 Executive Summary...7 Section 1: Strategic Planning
COUNTY DURHAM & DARLINGTON NHS FOUNDATION TRUST
 COUNTY DURHAM & DARLINGTON NHS FOUNDATION TRUST Introduction County Durham and Darlington NHS Foundation Trust is one of the largest integrated care providers in England, serving a population of around
EXECUTIVE MEMO BACKGROUND. Key Findings from Edinboro University s Workforce Region Workforce Needs Assessment,
 OFFICE OF THE CHANCELLOR EXECUTIVE MEMO BACKGROUND Key Findings from Edinboro University s Workforce Region Workforce Needs Assessment, 2016 2026 1 Pennsylvania s State System for Higher Education recently
THE REGIONAL ECONOMY OF UPSTATE NEW YORK. The Changing Composition of Upstate New York s Workforce. Fall 2003
 BUFFALO BRANCH, FEDERAL RESERVE BANK OF NEW YORK THE REGIONAL ECONOMY OF UPSTATE NEW YORK The Changing Composition of Upstate New York s Workforce Fall 2003 Buffalo Branch, Federal Reserve Bank of New
Keeping Pace with Employers
 Keeping Pace with Employers Making sense of future needs & current hiring difficulties Jeff DeBellis NC Department of Commerce, LEAD NC s primary source of economic & labor market data, information, &
Staffing for Tomorrow
 Staffing for Tomorrow BSB Conference May 5, 2011 Daren Fristoe Over twenty years of professional experience and leadership in the areas of human resources, training and education, and administration. Diverse
EXECUTIVE MEMO BACKGROUND. Key Findings from West Chester University s Workforce Region Workforce Needs Assessment,
 OFFICE OF THE CHANCELLOR EXECUTIVE MEMO BACKGROUND Key Findings from West Chester University s Workforce Region Workforce Needs Assessment, 2016 2026 1 Pennsylvania s State System for Higher Education
A Look Behind the Numbers
 A Look Behind the Numbers Vol. 7, issue 1 January 22, 2016 Published by the Federal Reserve Bank of Cleveland Opportunity Occupations in Ohio: Identification, Online Postings, and Employer Education Preferences
EXECUTIVE MEMO BACKGROUND. Key Findings from Pennsylvania s State System s Workforce Needs Assessment,
 OFFICE OF THE CHANCELLOR 1 EXECUTIVE MEMO Key Findings from Pennsylvania s State System s Workforce Needs Assessment, 2016 2026 BACKGROUND Pennsylvania s State System for Higher Education recently completed
Make or Buy? How You re Acquiring the Talent You Need
 Make or Buy? How You re Acquiring the Talent You Need Career Development in the Canadian Workplace: National Business Survey HRPA West Toronto October 15, 2014 Co-sponsored by: Agenda 1. Skills shortages
Greater Peninsula. State of the Workforce Report Executive Summary. Greater Peninsula Workforce Investment Board
 State of the Workforce Report 201 Executive Summary Workforce Investment Board Acknowledgements Preparation of this State of the Workforce Report was a collaborative effort between the Peninsula Council
Greater Kansas City Employer Survey
 Greater Kansas City Employer Survey 2011 Regional Workforce Intelligence Network of Greater Kansas City Funding provided by Overview A skilled workforce is essential to the attraction of new capital to
READY TO BUILD? The State of Skills in the Infrastructure Workforce
 READY TO BUILD? The State of Skills in the Infrastructure Workforce Burning Glass Technologies and National Network of Business and Industry Associations December 2018 ABOUT THIS REPORT This report has
APTA Preliminary Skill Development and Training Needs Report
 APTA Preliminary Skill Development and Training Needs Report July 2010 July 2010 Table of Contents LIST OF FIGURES... i EXECUTIVE SUMMARY... ii SECTION I SURVEY REVIEW... 1 SECTION II OVERVIEW OF SURVEY
REPORT OF CONTINUING CHALLENGES & BEST PRACTICES
 REPORT OF CONTINUING CHALLENGES & BEST PRACTICES 2015-2016 HR Skills Advisory Council Introduction Introduction... 2-3 FINDINGS Common Reasons for Rejecting Applicants... 4-5 Challenges Finding Qualified
A Hannah News Service Publication. The Character of Ohio s Employment Growth
 ON THE MONEY A Hannah News Service Publication Vol. 132, No. 35 By Bill LaFayette, PhD, owner, Regionomics LLC June 8, 2018 The Character of Ohio s Employment Growth Employment has now been increasing
WHITE PAPER - ADDRESSING THE BARRIERS FACED BY MATURE AGE WORKERS
 THE BEST IN PEOPLE. MAXIMISING THE POTENTIAL OF THE MATURE AGE WORKFORCE. WHITE PAPER - ADDRESSING THE BARRIERS FACED BY MATURE AGE WORKERS PART OF THE ESH GROUP IPA.COM.AU CONTENTS. INTRODUCTION PAGE
EmployerOne Survey 2018 Cross Tabulations
 EmployerOne Survey 2018 Cross Tabulations EMO Workforce Planning and Development Board and Local Employment Planning Council Emilian Siman, Data Analyst emilian@ workforcedevelopment.ca Introduction of
Demand for skills. The World Bank. Main results of the Azerbaijan STEP Employer Survey. Public Disclosure Authorized. Public Disclosure Authorized
 The World Bank Demand for skills Main results of the Azerbaijan STEP Employer Survey Public Disclosure Authorized Public Disclosure Authorized Public Disclosure Authorized Public Disclosure Authorized
Coastal Bend Employer Needs
 Coastal Bend Employer Needs 2017 Survey Released: 12/1/2017 SUMMARY An online survey of employers in the Coastal Bend was conducted in November. This study aims to better understand any existing gaps in