The Rosetta Stone Methodology A Benefits Driven Approach to Software Process Improvement. Fionbarr McLoughlin. Ph.D. 2010
|
|
|
- Kristina Cobb
- 6 years ago
- Views:
Transcription
1 The Rosetta Stone Methodology A Benefits Driven Approach to Software Process Improvement Fionbarr McLoughlin Ph.D Submitted to the University of Limerick October 2010 Supervised by: Dr. Ita Richardson
2 The Rosetta Stone Methodology A Benefits Driven Approach to Software Process Improvement Abstract Part of the maturity process in the fields of software engineering and information technology has involved, and continues to involve, establishing best practices in the various domains that constitute the area. Specifically, from a software development perspective, there are several competing Software Process Improvement (SPI) methodologies such as the Software Engineering Institute s (SEI) Capability Maturity Model Integrated (CMMI) approach and the International Standards Organization s ISO/IEC (previously known as SPICE). All these initiatives aim to improve an organization s systems capabilities but they aim to do so from an Information Technology (IT) perspective. However, the majority of organizations are not IT-centric and IT is but one of several elements which contributes to their success. As a result, organizational leaders are more comfortable seeing the benefits of SPI within the context of organizational benefits and objectives and what SPI can contribute to the organization as a whole, not as a purely IT objective. Unfortunately, there is a dearth of methodologies which approach software improvement from an organizational goals and objectives perspective. In response to the lack of an organization-focused approach to SPI, the research presented in this thesis, the Rosetta Stone Methodology, has been developed. This methodology allows organizations to make SPI decisions based on business- and organizational-driven goals and objectives. The methodology allows practitioners to map from a benefits model which is organization-focused to a proven SPI methodology. The methodology itself is fully customizable and allows organizations to make adjustments to the model where they feel it appropriate. Further, in order to demonstrate the usefulness, appropriateness, and practicality of the generic methodology, the Rosetta Stone IGSI-ISM to CMMI Instance mapping (RS- ICMMI) is developed using a generic set of business objectives developed by IBM Consulting Services which are then mapped to an established SPI methodology, namely the CMMI (Staged) model. Using the RS-ICMMI instance of the methodology, practitioners can readily determine which specific Process Areas should be undertaken to achieve specific business objectives. A validation phase was performed whereby both the methodology and the instance mapping were reviewed by experts.
3 The work presented in this thesis is entirely my own work. It has not been submitted previously to this or any other institute for this or any other academic award. Where use has been made of the work of other people, it has been acknowledged and referenced. Signed: Date: Fionbarr McLoughlin
4 To my beloved parents Evelayn ( ) and Clement ( ) McLoughlin To Eimear, Niamh, Aisling, and Pierce Thank you for your constant love, patience, and support
5 Acknowledgements I could not have completed this work without the help and support of so many people. In particular, I would like to thank my supervisor and part-time psychologist Dr. Ita Richardson. There were so many times I just wanted to give up but Ita always found a way for me to put this in perspective and encouraged me to carry on. I would also like to thank Dr. Dennis Goldenson of the Software Engineering Institute in Carnegie Mellon University, Pittsburgh. Dennis helped me in many, many ways and was always there to answer questions and educate me on the finer points of CMMI. Dr. Liam O Brien, formerly of Lero and the Software Engineering Institute, was also instrumental in helping me out when I started off this work. Thanks also goes to Dr. Tom O Kane of UCC who took a lot of time out of his busy days to help me, as did all the people who agreed to be interviewed by me. Dr. Jim Buckley of the University of Limerick deserves a special mention for his comments and feedback, particularly for his review of the Research Methodology chapter. I would also like to thank Professor Tony Cahill of the University of Limerick for his encouragement in this endeavour. Most importantly, I would like to thank my family. Without the constant support of my wife Eimear I would never have been able to undertake this work - this is just one of the many things I have to thank her for. Without her, this work would not have been possible. In addition, I would like to thank my wonderful children Niamh, Aisling, and Pierce who gave up time with their Daddy so he could work on his thesis. A special mention also goes to my two sisters, Charolotte and Edell, who are always there for me and have provided some invaluable sanity during this work. Without the help and support of my parents, Evelayn and Clement McLoughlin, I honestly don t know where I d be or what I d be doing now. There were many bright people who grew up with me in Southill who never had the opportunities that I received from my parents. My Dad taught me that there s a difference between being smart and being educated. Please God, I ll always remember that.
6 Table of Contents 1 INTRODUCTION BACKGROUND RESEARCH OBJECTIVES OUTLINE OF DISSERTATION STRUCTURE LITERATURE REVIEW INTRODUCTION DEFINITIONS SOFTWARE DEVELOPMENT LIFE CYCLES SOFTWARE PROCESS IMPROVEMENT MODELS CMMI - THE CAPABILITY MATURITY MODEL INTEGRATED The Capability Maturity Model Integration - CMMI CMMI Staged versus Continuous Representations CMMI Staged Representation CMMI Continuous Representation ISO/IEC Overview of ISO/IEC ANALYSIS OF ISO/IEC AND CMMI Relationships and History Comparison of Models The Future of CMMI and ISO/IEC AGILE SOFTWARE DEVELOPMENT AND SPI COSTS AND BENEFITS OF SPI Consistency and Limitations of Reported Benefits of SPI Categorization of Benefits Return on Investment - ROI Productivity Quality Cost Reduced Cycle Time Soft Benefits CRITICAL ANALYSIS OF SPI BUSINESS PROCESS IMPROVEMENT LITERATURE REVIEW CONCLUSION RESEARCH METHODOLOGY INTRODUCTION JENKINS RESEARCH PROCESS MODEL IDEA AND LIBRARY RESEARCH RESEARCH OBJECTIVE RESEARCH STRATEGY Research Philosophies Research Style Idiographic, Nomothetic, or Constructive? Positivist vs. Interpretivist Quantitative vs. Qualitative RESEARCH APPROACH EXPERIMENTAL DESIGN GQM... 64
7 3.8 VALIDATION OF THE ROSETTA STONE METHODOLOGY Expert Panel Data Capture Data Analysis RS-ICMMI BENEFITS MAPPING VALIDATION PROCESS Primary Vs. Secondary Degrees of Evidence Interview Sampling Method Compliance to Expectations SUMMARY THE ROSETTA STONE OBJECTIVE-DRIVEN SPI METHODOLOGY TRANSLATING BETWEEN ORGANIZATIONAL OBJECTIVES AND SPI INTRODUCTION THE ROSETTA STONE META-MODEL Background Rosetta Stone Meta-Model Overview Elements Relationships Return, Costs and ROI THE ROSETTA STONE METHODOLOGY Step 1 Choose the SPI Methodology Step 2 Choose the Benefits Model Steps 3 - Mapping between the SPI Methodology and the Benefits model Step 4 Determine Implementation Order Step 5 Identification of Metrics/Indicators for Benefits OPERATIONALIZATION OF THE ROSETTA STONE METHODOLOGY Step 1 - Choose SPI Methodology CMMI (Staged) Step 2 Choose Benefits Model IGSI-ISM Benefits Model Step 3 Map between SPI Methodology and Benefits Model Step 4 Determine Implementation Order Step 5 Identify Metrics for Benefits CONCLUSION ROSETTA STONE METHODOLOGY VALIDATION PROCESS INTRODUCTION THE OBJECTIVES OF THE RESEARCH Introductory Section Background Information on the Interviewee Review of the Methodology Questions Other Comments by Interviewees INTERVIEWEES ANALYSIS OF INTERVIEWS Question Group 1 Reasons for using SPI Question Group 2 Novelty Approach Question Group 3 The IGSI-ISM CMMI (Staged) Level 2 Mapping Question Group 4 The Rosetta Stone Methodology and Meta-Model Other comments and Future Enhancements Summary
8 6 RS-ICMMI VALIDATION PROCESS INTRODUCTION VALIDATION OF PROCESS AREA/BENEFITS MAPPING Requirements Management Project Planning Project Monitoring and Control Supplier Agreement Management Measurement and Analysis Process and Product Quality Assurance Configuration Management UPDATED RS-ICMMI MODEL CONCLUSION SUMMARY AND CONCLUSIONS INTRODUCTION RESEARCH QUESTION CRITICAL REVIEW OF RESEARCH Critical Review of Research Approach and Philosophy Critical Review of Research Contribution Other Limitations SUMMARY OF FINDINGS AND CONTRIBUTION OPPORTUNITIES FOR FUTURE RESEARCH Opportunities for Future Research Rosetta Stone Methodology Opportunities for Future Research RS-ICMMI mapping CONCLUSION APPENDIX A FULL CMMI (STAGED) TO IGSI-ISM MAPPING APPENDIX B (FINAL) POST-VALIDATION LEVEL 2 MAPPING APPENDIX C ROSETTA STONE METHODOLOGY EXPERT PANEL BIOGRAPHIES APPENDIX D RS-ICMMI EXPERT PANEL BIOGRAPHIES APPENDIX E SUMMARY OF CMMI PROCESS AREA TO IGSI-ISM BENEFITS MAP APPENDIX F EXPERT PANEL INTERVIEW PRESENTATION APPENDIX G PRESENTATION TO NDIA CONFERENCE APPENDIX H PROFES2010 CONFERENCE PAPER APPENDIX I EUROSPI 2010 CONFERENCE PAPER
9 List of Tables Table 2-1: Characteristics of Seven frameworks (Sheard, 1997)... 9 Table 2-2: Staged and Continuous relative advantages (Ahern et al, 2001) Table 2-3: CMMI Staged PA to Level mapping Table 2-4: CMMI Capability Levels Table 2-5: Model Chronology (Tantara Consulting Inc., 2001) Table 2-6: SPI Benchmarks Critical Review (Solon and Statz, 2002) Table 2-7: NSQE ROI on Software Inspection (O Neill, 2003) Table 2-8: Summary of Overall Results (Herbsleb et al, 1994b) Table 2-9: General Dynamics ROI results (King and Diaz, 2002) Table 2-10: CMM productivity results (Herbsleb, Goldenson et al, 1995) Table 2-11: Productivity Results (Brodman and Johnson, 1995) Table 2-12: Productivity results (Diaz and Sligo, 1997) Table 2-13: OC-ALC Productivity Data (Butler and Lipke, 2000) Table 2-14: General Dynamics Productivity Benefits per CMM Level (King and Diaz, 2002) Table 2-15: Quality Results (Herbsleb et al., (1994b) Table 2-16: Quality Results (Brodman and Johnson, 1995) Table 2-17: Quality Results (Diaz and Sligo, 1997) Table 2-18: Quality Results (Butler and Lipke, 2000) Table 2-19: Quality Results (King and Diaz, 2002) Table 2-20: Cost Savings (Brodman and Johnson, 1995) Table 2-21: Cost Benefits (Goldenson et al., 1995) Table 2-22: SPI results (Wohlwend and Rosenbaum, 1994) Table 2-23: Schedule Results (Goldenson et al., 1995) Table 2-24: Cycle Time results (Diaz and Sligo, 1997) Table 2-25: Cycle Time results (Butler and Lipke, 2000) Table 2-26: Summary of reported soft benefits of SPI Table 2-27: Summary of reported soft benefits of SPI (cont.) Table 3-1: Qualitative vs. Quantitative technique comparisons (Glesne & Peskin, 1991): Table 3-2: Quantitative vs. Qualitative comparisons (Silverman, 2006) Table 3-3: Classification of Mingers' (2003) and Galliers' (1992) Research Methods (Choudrie and Dwivedi, 2005) Table 3-4: Content Analysis Codes for Rosetta Stone Interviews Table 3-5: Summary of Questions per Interviewee Table 4-1: IGSI-ISM Benefits Table 4-2: : CMMI (Staged) Level 2 to IGSI-ISM Map Primary Benefits Table 4-3: Expected primary benefits of REQM Table 4-4: Expected secondary, non-derived benefits of REQM Table 4-5: Derived benefits of implementation of REQM Table 4-6: Expected primary benefits of PP Table 4-7: Expected non-derived secondary benefits of PP Table 4-8: Expected benefits of PP Table 4-9: Expected primary benefits of PMC Table 4-10: Expected benefits of PMC Table 4-11: Expected primary benefits of SAM Table 4-12: Expected non-derived secondary benefits of SAM Table 4-13: Expected benefits of SAM Table 4-14: Expected primary benefits of MA... 98
10 Table 4-15: Expected non-derived secondary benefits of MA Table 4-16: Expected benefits of MA Table 4-17: Primary benefits of PPQA Table 4-18: Expected benefits of PPQA Table 4-19: Expected primary benefits of CM Table 4-20: Expected non-derived secondary benefits of CM Table 4-21: Expected benefits of CM Table 4-22: Summary of all CMMI (Staged) Level 2 Benefits Table 4-23: Summary of all CMMI (Staged) Level 2 Benefits (cont.) Table 4-24: Lower Time to Market Table 4-25: Example Objective - Lower Time to Market Table 4-26: Implementation order of PAs Table 5-1: List of Interviewees Table 5-2: Summary of interviewee experience Table 6-1: Expected primary benefits of REQM Table 6-2: Other Process Area/Benefit combinations for REQM Table 6-3: Primary benefits of PP Table 6-4: Other Process Area/Benefit combinations of PP Table 6-5: Primary benefits of PMC Table 6-6: Other Process Area/Benefit combinations of PMC Table 6-7: Primary benefits of SAM Table 6-8: Other Process Area/Benefit combinations of SAM Table 6-9: Primary benefits of MA Table 6-10: Other Process Area/Benefit combinations of MA Table 6-11: Primary benefits of PPQA Table 6-12: Other Process Area/Benefit combinations of PPQA Table 6-13: Primary benefits of CM Table 6-14: Other Process Area/Benefit combinations of CM Table 6-15: Summary of post-validation changes to RS-ICMMI mapping Table 6-16: Post-validation REQM benefits mapping Table 6-17: Post-validation PP benefits mapping Table 6-18: Post-validation PMC benefits mapping Table 6-19: Post-validation SAM benefits mapping Table 6-20: Post-validation MA benefits mapping Table 6-21: Post-validation PPQA benefits mapping Table 6-22: Post-validation CM benefits mapping
11 List of Figures Figure 1-1: Software and System Domain standards... 2 Figure 2-1: Waterfall Lifecycle (Royce, 1970)... 7 Figure 2-2: Spiral Lifecycle (Boehm, 1998)... 8 Figure 2-3: CMMI Model Structure (Chrissis et al., 2003) Figure 2-4: CMMI Staged Representation Figure 2-5: CMMI Continuous Representation Figure 2-6: ISO/IEC Process Assessment Relationship (ISO/IEC ) Figure 2-7: ISO/IEC Assessment Process (ISO/IEC ) Figure 2-8: ISO/IEC Process Model Relationships (ISO/IEC ) Figure 2-9: Relationships between Models (Tantara Consulting, 2001) Figure 3-1: Disconnect between Research and Practice (Moody, 2000) Figure 3-2: GQM Approach (Basili, 1992) Figure 3-3: Modified GQM Approach Figure 3-4: Question Flow for validation of PA to IGSI-ISM Benefit map Figure 4-1: Axes of SPI studies Figure 4-2: Rosetta Stone Meta-Model Figure 4-3: Traditional vs. Rosetta Stone SPI Approach Figure 4-4: Rosetta Stone Methodology Figure 4-5: Modified GQM Reverse Lookup Figure 4-6: PA to Business Objective Map using a reverse GQM map Figure 4-7: Traditional GQM Approach (Basili, 1992) Figure 4-8: Implementation Instance of RS-ICMMI Figure 4-9: IGSI-ISM ROI Model (Goyal et al., 2001) Figure 4-10: Determining order of implementation Figure 5-1: Rosetta Stone Meta-Model to Instance Mapping Figure 5-2: Rosetta Stone Expert Panel Interview Mindmap Figure 7-1: Modified IGSI-ISM model Figure 7-2: Project Management Triangle
12 List of Acronyms ATE BPI BPR CMM CMMI CMU COBIT COCOMO COQ CPI DD DERA DOD Automatic Test Equipment Business Process Improvement Business Process Re-engineering Capability Maturity Model Capability Maturity Model Integrated Carnegie Mellon University Control Objectives for Information and Related Technology COnstructive COst MOdel Cost Of Quality Cost Performance Index Defect Density Defence Evaluation Research Agency (US) Department of Defense GG Generic Goal (CMMI-SW Staged 1.1) GQM ICT IEC IEEE IGSI-ISM IID IRR IS ISD ISO ISACA IT ITGI Goal-Question-Metric Information Communications Technology International Electrotechnical Commission Institute of Electrical and Electronics Engineers IBM Global Services India - Interpretive Structural Modelling Iterative and Incremental Development Internal Rate of Return Information Systems Integrated Systems Development International Standards Organization Information Systems Audit and Control Association Information Technology Information Technology Governance Institute
13 ITIL ISO Information Technology Infrastructure Library Software Process Lifecycle model JTC1/SC7/WG10 Joint Technical Committee 1, Sub-committee 7, Working Group 10 KBPI KPA KSLOC MIS NASA NGO NPV NQSE OECD OGC Knowledge-based Business Process Improvement Key Process Area (CMM) Source Lines of Code in Thousands (Kilo) Management Information Systems National Aeronautics and Space Administration Non-Government Organizations Net Present Value National Software Quality Experiment Organization for Economic Coordination and Development Office of Government Commerce PA Process Area (CMMI-SW Staged 1.1) PAM PMAT PMBOK PMI PMO PRINCE2 PRM QA ROI RS-ICMMI SEI SEL Process Assessment Model Process Maturity Project Management Book Of Knowledge Project Management Institute Project Management Office PRojects IN Controlled Environments Process Reference Model Quality Assurance Return On Investment Rosetta Stone IGSI-ISM to CMMI Instance mapping Software Engineering Institute Software Engineering Laboratory (NASA) SG Specific Goal (CMMI-SW Staged 1.1) SLA SLCM Service Level Agreement Software Life Cycle Model
14 SME Small and Medium Enterprises SP Specific Practice (CMMI-SW Staged 1.1) SPA SPI SPICE TPS UAT USDOD Software Process Assessment Software Process Improvement; Schedule Performance Index Software Process Improvement and Capability determination Test Program Set User Acceptance Testing United States Department of Defence
15 1 Introduction 1.1 Background Organizations do not exist in a vacuum. Every organization has certain objectives which it is chartered to achieve, depending on the type of organization. Some organizations are for-profit organizations which concentrate on achieving profits; some organizations are public service organizations which provide services to the public; yet others are chartered with furthering research and development activities. What they all have in common is that they want to achieve their relative organizational objectives as efficiently as possible, using the minimum of resources to maximum effect. A significant amount of capital expenditure and operating expenses are spent on hardware, software, and technical support. In fact, according to the Organization for Economic Co-Operation and Development (2006), total worldwide spending on ICT 1 was expected to reach $2.964 trillion in 2005, the last year for which the OECD has published estimates. Given the massive amount of spending involved, anything which can shave even a few percentage points off costs could potentially free up a large amount of capital that could be used in either other areas of an organization or could be re-invested in further software development. As disciplines, software engineering and information technology are relatively new and are maturing rapidly. Part of this maturity process has involved, and continues to involve, establishing best practices in the various domains that constitute the area. As we can see from Figure 1-1, various standards have emerged for the various domains and sub-domains within Software Engineering, Software Development and IT. From a management perspective, for example, we have the IT Governance Institute s (ITGI) Control Objectives for Information and Related Technology (COBIT ) standard (ISACA 2007) which is related to IT Governance; the Project Management Institute s (PMI) standard for Project Management as described in the Project Management Book of Knowledge (PMI 2004); the Office of Government Commerce s (OGC) PRINCE2 standard for 1 In 1998, the OECD countries reached agreement on an industry-based definition of the ICT sector based on Revision 3 of the International Standard Industrial Classification (ISIC Rev. 3). The principles underlying the definition are the following: for manufacturing industries, the products of a candidate industry must be intended to fulfill the function of information processing and communication including transmission and display, must use electronic processing to detect, measure and/or record physical phenomena or control a physical process; for services industries, the products of a candidate industry must be intended to enable the function of information processing and communication by electronic means (OECD (2008). OECD.Stat Database, OECD. 1
16 Project Management as described in (OGC 2005); and the OGC s IT Infrastructure Library (ITIL) standard as defined in (OGC 2007b; 2007a). Figure 1-1: Software and System Domain standards From a Software Process Improvement (SPI) perspective, there are several competing and, in some cases, complementary standards such as the Software Engineering Institute s CMMI for Development version 1.2 (SEI 2006); the International Standards Organization s (ISO) (ISO 2003), formerly known as SPICE; the Trillium Model (Coallier 1994; April and Coallier 1995), an assessment model that aims to benchmark a software supplier s product development and support capability which was developed originally in 1991 by Bell Canada; and the ISO s standard (ISO 1994) and the ISO 9001:2000 standard (ISO 2000), a process-driven approach to define, establish and maintain software quality within an organization that will allow organizations to meet their business objectives (Hailey 2001). All these initiatives aim to improve an organization s systems capabilities but they all aim to do so from an IT perspective. There are few, if any, methodologies which approach systems improvement from a business goals and objectives perspective. The Rosetta Stone Methodology, developed and evaluated during this research, consists of a methodology, a meta-model, and a concrete instance of that meta-model which allows businesses to undertake business- and organizationaldriven goals and objectives. 2
17 1.2 Research Objectives There are currently several major Software Process Improvement (SPI) methodologies being actively used in organizations worldwide. While these methodologies will continue to mature and evolve over time, one thing they all have in common is that they are IT-centric. The focus of these methodologies is the implementation of specific IT and software engineering practices in order to gain benefits. They do not focus on satisfying a business objective by implementing specific IT practices. As we shall see in Chapter 2, there is quite a deal of literature available to support the hypothesis that implementation of the various SPI methodologies will result in benefits to organizations. However, these benefits come about as a result of implementation of SPI i.e. SPI, which is ITcentric, drives the benefits. There is no ability within the established SPI methodologies to define what benefits/objectives an organization would like to achieve and use business-centric objectives to drive what particular SPI initiatives should be undertaken. The purpose of this research is twofold. Firstly, a methodology has been developed which allows practitioners to map arbitrary business benefits models to arbitrary SPI models or methodologies. Secondly, a mapping of business-centric benefits to CMMI (Staged) has been developed which allows practitioners to target specific business benefits through the implementation of various Process Areas (PAs). In order for the methodology and mapping instance to be successful: they must take into account the wide variety of organizations that exist as well as their overall goals and objectives. Examples of these various types of organizations include for-profit organizations such as Goldman Sachs and General Electric, public service organizations such as local authorities, government departments, and research organizations such as NASA and various universities they should be able to re-use existing SPI methodologies such as CMM/CMMI, Trillium, ISO 9000/9001, and ISO/IEC they should be directly usable by practitioners within the organizations concerned organizations should not have to rely unnecessarily on outside experts to implement the methods defined within the overall methodology. Both the generic methodology and the concrete mapping developed during this research were evaluated through interviews which are presented in chapters 5 and 6. 3
18 1.3 Outline of Dissertation Structure The dissertation is structured as follows: Chapter 1: Introduction. Chapter 1 provides a context for this research. It explains why there is a need for the Rosetta Stone Methodology and why it is an appropriate approach to solving issues that many organizations face on a daily basis. In addition, Chapter 1 outlines the remaining chapters. Chapter 2: Literature Review. Chapter 2 provides a high level review of CMMI and ISO/IEC as well as a high-level comparison and a genealogy of their development. It also provides a literature review of the benefits of implementing various SPI methodologies with a specific emphasis on CMM and CMMI as these two models are the basis for the specific implementation of the Rosetta Stone implementation detailed in Chapter 4. In addition, it discusses Business Process Improvement (BPI) and how it links into SPI. Chapter 3: Research Methodology. Chapter 3 details the research process and research methodology that is used in this research work. The chapter provides specific information on how the model was developed and evaluated and what is the academic basis for the research methods used. Chapter 4: The Rosetta Stone Objective-Driven SPI Methodology. The generic Rosetta Stone Methodology is introduced which allows organizations to map organization- and business-driven objectives to various SPI methodologies. Using the generic Rosetta Stone Methodology, a specific implementation is explored using a generic, forprofit objectives model obtained from IBM Global Services, India (Goyal et al. 2001) and the CMMI Staged Representation (CMMI Product Team 2002). Chapter 5: Rosetta Stone Methodology Validation Process. In order to evaluate and validate the model, interviews were conducted with various practitioners, authors, and academics. Chapter 5 contains the results of these interviews. Chapter 6: RS-ICMMI Validation Process. An implementation of the RSM was created which consists of all the mappings from the IBM Global Services (India) Interpretive Structural Modelling (IGSI-ISM) benefits model to CMMI (Staged). These individual mappings were discussed indepth with various practitioners and academics for CMMI (Staged) Level 2 and the model and instance mapping were modified accordingly. The results of the interviews and the re-mapping are discussed in Chapter 6. Chapter 7: Summary and Conclusions. Chapter 7 brings together the various strands of this research and draws conclusions, lessons learnt and scope for future research. 4
19 2 Literature Review 2.1 Introduction Over the years, software and systems development methodologies have evolved to enable the development of larger scale and ever more complex solutions to real-world problems. Significant advances in hardware design have given software engineers enough raw computing power to them to allow them to create solutions for more and more complex and larger problem domains. Unfortunately, however, improvements in software design and development have not kept pace with these advances in hardware. Brooks (1995) states that larger-scale programming over the past decade has been such a tar pit, and many great and powerful beasts have thrashed violently in it. The good news, however, is that advances have been made and, while there are still quite a few horror stories reported in the press, we now appear to be more capable of developing more large-scale, complex systems than previously. To get to where we are now, however, has taken a lot of hard work and the gradual evolution of development processes. Initially, the focus of improvement was on general engineering solutions such as Fagan s work on Software Inspections (Fagan 1986) and Structured Programming (Jackson 1975; Djikstra 1979) but later on focus shifted to various, specialized Software Process Improvement (SPI) and Project Management methodologies. In addition to the reported progress on SPI, a great deal of research has been undertaken on Business Process Improvement (BPI). IT is seen as an integral part of this and there is a growing body of work which seeks to integrate both BPI and SPI. This first part of this chapter focuses in providing a background on software development lifecycles in general as well as a review of two of the leading SPI/SPA models. In addition, this chapter also reports on the demonstrated benefits of software engineering improvement techniques in general as well as of SPI, BPI, and the integration of both SPI and BPI. 2.2 Definitions Before proceeding further it is important to provide appropriate definitions for the subjects being discussed in this chapter. The basis for the life cycle definitions in this thesis is the IEEE/EIA standard (1996), which provides a framework for all software lifecycle processes. According to the standard, individual projects 5
20 may be tailored and must be mapped onto a Software Life Cycle Model (SLCM) (IEEE/EIA 1998; Schmidt 2000). Examples of the SLCM include the Waterfall Model and the Spiral Model, both of which are software development models and which shall be discussed in the next section. The definition of the Software Life Cycle is quite broad and, according to the standard, may include items not specific to the development process such as operational support and acquisition of services so we therefore distinguish between the Software Development Life Cycle and the Software Life Cycle. Sommerville (2004) defines the software process as a structured set of activities required to develop a software system, including at least the processes of specification, design, validation, and evolution. According to Paulk et al. (1995) the software process can be defined as a set of activities, methods, practices, and transformations that people employ to develop and maintain software and the associated products. While implied in Sommerville s definition, Boehm (1998) specifically includes the notion of order to the definition of the software process in that the primary functions of a software process model are to determine the order of the stages involved in software development and evolution and to establish the transition criteria for progressing from one stage to the next. According to these definitions, therefore, the terms software process and software development process may be regarded as being synonymous. For the purposes of this thesis we treat the terms software process, software development process and software development life cycle as being synonymous while the software life cycle encompasses all phases, including the operational phase, of software. The work presented in this thesis is the Rosetta Stone Methodology and is composed of 2 parts the Rosetta Stone Methodology (RSM) which is the methodology used to create an implementation instance of the Rosetta Stone meta-model and the Rosetta Stone Implementation instance for CMMI (RS- ICMMI) which is an implementation instance of the RSM based on the IGSI-ISM benefits model and the CMMI (Staged) SPI model. 2.3 Software Development Life Cycles Probably the earliest software development process model discussed in the literature is discussed in Davis et al. (1988) and was the code-and-fix model whereby development consisted of two steps: 1. Write program code 2. Fix any issues or bugs in the code. 6
21 While this approach was fine for very small development efforts, it had several inherent weaknesses in that, as there was no design phase, the code became brittle and inflexible over time and, as a result, expensive to maintain. In addition, again as a result of the lack of a design phase, it was not well suited to large-scale system development. In the 1950s, as computers became more mainstream, the scope and complexity of potential applications for this technology increased and the weaknesses of the code-and-fix model became more apparent. The next recognized leap forward in software process development came about as a result of experiences in the SAGE (Semi-Automated Ground Environment) air-defence system. In his paper, Pennington (1956) describes the Stagewise model where software is developed in successive stages - operational plan, machine/operational specifications, program specifications, coding specifications, coding, parameter testing (specifications), assembly testing (specifications), shakedown, and system evaluation. Unfortunately in this model there are no feedback loops to previous stages to fix/change issues at later stages. The next evolution in software development process is the familiar Waterfall Model (Royce 1970) where the software development process consists of a set of discrete activities/stages, performed in a non-overlapping manner. Pure Waterfall consists of the following implementation phases (see also Figure 2-1): System Requirements Software Requirements Analysis Program Design Coding Testing Operations. Figure 2-1: Waterfall Lifecycle (Royce, 1970) 7
22 The big difference between this model and the Stagewise model is that Royce provides feedback loops to previous stages, allowing changes to be made to previously developed work. However, there are still some challenges with the Waterfall model in that there is an emphasis of having fully completed requirements and design documents before proceeding farther down the waterfall. Clearly this is a deficiency as real-life rarely works like this. In fact, according to Parnas and Clements (1986), there are several other reasons why the waterfall model is not an accurate representation of a real-life project life cycle. Those reasons include the fact that human beings are unable to fully understand all the relevant details about a complex system; requirements change for external reasons that are beyond the control of the project team; and project teams are sometimes encouraged to use sub-optimal tools or share code with other projects. In real-life, it is more likely that a project will evolve over time and thus design and development is much more iterative than it would appear in the Waterfall model. The Spiral Model (Boehm 1998) addresses this issue by allowing multiple cycles of: Determination of objectives, alternatives, and constraints Evaluation of alternatives, identification and resolution of risks Development and verification of next-level product Planning for next phases. where each cycle is an elaboration of previous cycles (see Figure 2-2). Figure 2-2: Spiral Lifecycle (Boehm, 1998) 8
23 2.4 Software Process Improvement Models Software Process Improvement (SPI) has been defined as making better tools, on time and within budget (Fantina 2005). For the purposes of this work, I define SPI as any change to the software development process which has a positive effect on the time, quality, or cost of software development. Unfortunately even within the software cognoscenti, people get confused about the difference between a model and a methodology. A model, according to the Concise Oxford English Dictionary (2008), is a simplified mathematical description of a system or process, used to assist calculations and predictions ; a methodology is a system of methods used in a particular field ; and a standard is something used as a measure, norm, or model in comparative evaluations. Several widely-known Software Process Improvement standards currently exist. Sheard (1997) identifies 7 important frameworks and identifies some major focus areas of each (see Table 2-1). Since Sheard s paper in 1997, the SEI has sunsetted CMM, replacing it with CMMI, and the ISO/IEC assessment framework (formerly known as SPICE) has emerged as a growing force in several domains such as the automotive domain (Automotive SPICE) the banking domain (Banking SPICE), and the medical domain (Medi SPICE). The Trillium model, based on personal correspondence with Francois Coallier (2003), has not been updated since 1996 and there are no further plans to update it. As a result of all this, we shall concentrate on the 2 widely used SPI/SPA models/frameworks in use today CMMI and ISO/IEC Framework CMM SE-CMM IPD-CMM ISO 9000 SDCE Software Lifecycle Standards Trillium Major Focus Software Process Software Engineering Process Process Quality Process Process, Capacity, Technology Management Process Software Process Table 2-1: Characteristics of Seven frameworks (Sheard, 1997) 9
24 2.5 CMMI - the Capability Maturity Model Integrated The Capability Maturity Model Integration - CMMI Carnegie-Melon University s (CMU) Software Engineering Institute (SEI) and the MITRE Corporation, in response to a request from the US federal government, began developing a process maturity framework that would help organizations improve their software process. The genesis of this framework was based on previous work by Humphrey (1987; 1988; 1989) and was published as The Capability Maturity Model for Software (Paulk et al. 1993). The initial release of the CMM, Version 1.0, was released for review by the software community during 1991 and Further refinements were made and Version 1.1 was published in (Paulk et al. 1993). However, the CMM model was not without its criticisms. According to Ahern et al. (2001), one of the major disadvantages of CMM was that there was no integration between the CMM for Software (CMM-SW), the CMM for Systems Engineering (CMM-SE), and the Integrated Product Development CMM (IPD- CMM) models. In addition, Royce (2002) reports that one of the key issues he encountered with CMM is that the Key Process Areas (KPAs) mostly focus on activities and processes based on the traditional Waterfall process model. He also noted that there was no emphasis on the architecture/design process, the assessment process, or the deployment process. In response to these criticisms, the Capability Maturity Model Integration (CMMI) addresses these issues (Ahern et al. 2001; Konrad and Shrum 2001; Chrissis et al. 2003). One other major issue that CMMI addresses is to be consistent and compatible with ISO/IEC (Chrissis et al. 2003). Subsequent to the 1.1 release of CMMI, version 1.2 was released in August 2006 and there are further plans in hand for version 1.3. CMMI exists in 2 representations - the continuous approach like ISO/IEC where the focus is on specific processes and the staged approach where organizations undertaking CMM at Level 1 and work up to Level 5. In addition to the Staged and Continuous representations, the underlying model has changed dramatically (SEI 2002d; 2002c) and there are now 25 CMMI Process Areas compared to 18 CMM Key Process Areas. The top-level object in both models is the Process Area (PA) (see Figure 2-3). There are 25 distinct PAs within CMMI and each area covers a distinct set of practices. Each Process Area has a Purpose Statement that describes the purpose of the PA, a set of Introductory Notes that describes the major concepts within the PA, and a list of other Related Process Areas. A PA is composed of a set of Specific Goals that are unique to that PA. On the opposite end of the spectrum, a PA has a set of Generic Goals. Unlike Specific Goals, however, Generic Goals may be applicable to several PAs and are responsible for institutionalizing processes. Specific Practices are descriptions of activities that contribute to Specific Goals, while Generic Practices are those activities that contribute to Generic Goals. While CMMI provides the definition of what components an organization must achieve to satisfy a Process Area, it 10
25 does not describe how it should be implemented. As a result, there is a clear distinction between a process model or class - in CMMI terms, a Process Area - and a Process Instance, which is a concrete implementation of a process model. For example, the CMMI Configuration Management process area talks of baselines and managing baselines, it does not provide guidance on how to implement this for example, for software development artefacts, tools such as Visual Source Safe or the Concurrent Versioning System (CVS) would typically be used. CMMI Model Architecture Figure 2-3: CMMI Model Structure (Chrissis et al., 2003) 11
26 2.5.2 CMMI Staged versus Continuous Representations According to Chrissis et al. (2003), both the Staged and Continuous representations are designed to offer essentially the same results in fact, more than 80% of both representations are the same. How then does one decide which representation to use? Several factors may affect this decision: Legacy does the organization currently employ the CMM model? Business Factors do the business goals and objectives of the organization allow the organization the time to go through the various levels of the Staged Representation or is there a compelling reason to concentrate on one (or several) areas before concentrating on the various other Process Areas? Cultural does the organization s culture lend itself to one representation over the other? In addition to the above criteria, Ahern et al. (2001) cite several reasons for choosing the Staged representation over the Continuous representation and vice versa (see Table 2-2). Staged Ability to manage the process across the organization Good communication about the process amongst the employees Improved accuracy of project estimates Improved cost and quality control Continuous A structure that is more easily compatible with ISO/IEC An approach that more easily facilitates the addition of new process areas with minimal effects on the existing model structure Use of measurable data to guide problem analysis and improvement efforts Table 2-2: Staged and Continuous relative advantages (Ahern et al, 2001) At a high level, the representations differ in several ways: In the Continuous representation, PAs are organized by process area categories, while in the Staged representation, PAs are organized by Maturity Level In the Continuous representation, improvement is measured by Capability Levels, while Maturity Levels are used in the Staged representation 12
27 Capability Levels are used to organize generic practices in the Continuous representation, while Common Features are used in the Staged representation CMMI Staged Representation The Staged Representation still uses the concept of Maturity Levels as used in the original CMM. As there are now 25 different PAs vs. the 18 there were in CMM, the mapping has changed (see Table 2-3). Figure 2-4: CMMI Staged Representation 13
28 Maturity Level Process Areas Level 1: Initial Level 2: Managed NA Configuration Management Measurement & Analysis Project Monitoring & Control Project Planning Process & Product Quality Assurance Requirements Management Supplier Agreement Management Level 3: Defined Decision Analysis & Resolution Integrated Project Management Integrated Supplier Management Integrated Teaming Organizational Environment for Integration Organizational Process Definition Organizational Process Focus Organizational Training Product Integration Requirements Development Risk Management Technical Solution Validation Verification Level 4: Quantitatively Managed Organizational Process Performance Quantitative Project Management Level 5: Optimizing Causal Analysis & Resolution Organizational Integration & Deployment Table 2-3: CMMI Staged PA to Level mapping 14
29 2.5.4 CMMI Continuous Representation While the Staged Representation utilizes the concept of Maturity Levels, the Continuous Representation utilizes the concept of Capability Levels. A Capability Level consists of a distinct set of related Specific and Generic Practices that, combined, add a significant capability to an organization s abilities for a Process Area. There are six distinct Capability Levels (see Table 2-4). Capability Level Level 0: Incomplete Level 1: Performed Level 2: Managed Level 3: Defined Level 4: Quantitatively Managed Description One of more of the specific goals and none of the generic goals are satisfied The specific goals for the PA are satisfied Level 1 is satisfied and basic infrastructure is in place to support the PA Level 2 is satisfied and the process is tailored from the organization s defined processes Level 3 is satisfied and statistical control is used to analyze the PA Level 5: Optimizing Level 4 is satisfied and processes evolve using inputs from Level 4 Table 2-4: CMMI Capability Levels Figure 2-5: CMMI Continuous Representation As mentioned, the staged approach has been kept in order to allow organizations to retain their investment in CMM. However, as CMMI continues to integrate 15
30 more and more closely with ISO/IEC 15504, it would not be unreasonable to assume that the continuous approach will continue to gain more popularity. 2.6 ISO/IEC Overview of ISO/IEC The purpose of ISO/IEC (previously known as SPICE - Software Process Improvement Capability determination) is to provide a framework for the assessment of software processes. According to (International Standards Organization 2004), Process Assessment has 2 principle contexts for its use (see Figure 2-6): 1. Process Improvement. Process assessment provides the means of characterizing the current practices within an organization in terms of the capabilities of selected processes. Analysis of the capability of those processes identifies strengths and risks inherent in them and provides drivers for prioritizing improvements to them. 2. Process Capability Determination. Process capability determination is concerned with analysing the proposed capability of selected processes against a target process capability profile. Figure 2-6: ISO/IEC Process Assessment Relationship (ISO/IEC ) Under ISO/IEC 15504, a Process Reference Model (PRM) is measured against a measurement framework to produce a Process Assessment Model (PAM). This is graphically illustrated in Figure 2-7. PRMs provide the mechanism whereby defined PAMs are related to the measurement framework and are defined in (International Standards Organization 2003). A PRM is defined externally to the ISO/IEC standard but needs to adhere to certain requirements which are laid out in the ISO/IEC standard in order to be conformant with the standard. In addition to the requirements in order to be compliant with an ISO/IEC PRM, ISO/IEC (International Standards Organization 2006) provides an exemplar Process Reference Model. Under the measurement framework in (International Standards Organization 2003), a process capability is 16
31 defined on a six point ordinal scale that enables capability to be assessed from the bottom of the scale, Incomplete, through to the top end of the scale, Optimizing (see Figure 2-8). The scale represents increasing capability of the implemented process, from not achieving the process purpose through to meeting current and projected business goals. Figure 2-7: ISO/IEC Assessment Process (ISO/IEC ) Figure 2-8: ISO/IEC Process Model Relationships (ISO/IEC ) 17
32 2.7 Analysis of ISO/IEC and CMMI Relationships and History Many of the current models have been influenced by previous models. Table 2-5 contains a brief chronology of the models which have been discussed (Tantara Consulting Services Inc. 2001) and which has been slightly modified by this researcher. In addition to the chronology of the various models, many of the models have taken the best features of existing models and have incorporated them into their own. Figure 2-9 shows the relationships between the various models (Tantara Consulting Services Inc. 2001). Figure 2-9: Relationships between Models (Tantara Consulting, 2001) 18
33 Year History 2006 SEI CMMI for Development 1.2 released 2000 ISO 9000:2000 released SEI CMMI v1.02 released 1998 ISO/IEC (SPICE) released to public as type 2 Technical Reports TickIT v4.0 released 1997 ISO released SEI halts SW-CMM versions in support of CMMI 1996 IEEE/EIA released 1995 IEEE/EIA released (initial release) ISO/IEC (SPICE) initial draft released 1994 ISO 9001 re-released Trillium v3.0 released 1993 SEI CMM-SW v1.1 released 1992 IEEE adopts the Australian AS 3563 as IEEE IEEE 1074 released ImproveIT v1.0 released ISO initial released SEI SW-CMM v1.0 released Trillium v1.0 released 1988 AS 3563 (Software Quality Management System) standard released 1987 ISO 9001 initial release NIST/MBNQA: 1 st Malcolm Baldridge National Quality Award (USA) SEI-87-TR-24 (SW-CMM questionnaire) released Table 2-5: Model Chronology (Tantara Consulting Inc., 2001) Comparison of Models ISO/IEC and CMMI are the two most recent SPI/SPA models. They have been built on the experiences of the many previous SPI/SPA models that have gone before them (see Figure 2-9 for details). The main difference between them, 19
34 however, is that ISO/IEC is a standard for process assessment, while CMMI is a Software Process Improvement model. According to Rout (1998), a key outcome of the ISO/IEC standard must be to encourage harmonization of existing schemes. Rout (2003) states that ISO/IEC identifies two classes of process model Process Reference Models (PRM) and Process Assessment Models (PAM). The purpose of a PRM is to provide descriptions of process entities to be evaluated to define what is being measured while the purpose of a PRM is to support the conduct of an assessment. More specifically, ISO/IEC (2003) specifies that a conformant PAM shall be based upon a suitable reference source of process definitions (PRM). ISO/IEC may be seen therefore as being a meta-model for process assessment whereby concrete PRMs are used in practice. Van Loon (2007) states that, in order to ensure consistency and repeatability of assessments, a conformant PAM shall contain: A definition of its purpose, scope, elements, and indicators A mechanism for consistent expression of results The mapping to the ISE/IEC Measurement Framework and the specified Process Reference Models. Given the above criteria, is CMMI a conformant PAM? Rout and Tuffley (2007) undertook an analysis conformance of CMMI (Continuous) to ISO/IEC and identified several significant issues from a PAM perspective. From a PRM perspective, Rout and Tuffley were confident that with a few exceptions, a profile of acceptable scope should be derivable but the analysis of the Capability Dimension implies significant problems in evaluating capabilities beyond Level 2. This contention is also supported by a pilot appraisal by Kitson et al. (2006). Pino et al (2009) undertook a similar analysis between CMMI-DEV (Staged) and ISO/IEC Their conclusion is that there is either strong or large coverage for 15 out of the 22 CMMI-DEV PAs, partial coverage for 5 PAs, and weak coverage for 2 PAs and that, with regard to maturity levels, the processes of a maturity level of ISO/IEC cover several process areas that belong to different maturity levels of CMMI there is no one-to-one relationship between ISO/IEC and CMMI maturity levels The Future of CMMI and ISO/IEC So what does the future hold for SPI/SPA? It would appear that the two models that are in best position to survive are the CMMI and ISO/IEC models. CMM is the most widely used model in the United States and, probably, in the world right now. The SEI is spending considerable resources promoting their new CMMI model and it seems poised to benefit from the current CMM and CMMI 1.2 user-bases. In addition, the SEI continues to make efforts to harmonize CMMI with ISO/IEC ISO/IEC is constantly being worked on and 20
35 expanded. For example, ISO/IEC has now been extended to the automotive domain (Automotive SPICE), while the medical domain (Medi SPICE), and the banking domain (Banking SPICE) are under development. Given the expressed desire of both the CMMI and ISO/IEC teams for harmonization, will harmonization be achieved? However, several obstacles will have to be overcome to make the dream a reality: CMM and CMMI are looked upon as being specifically American in nature, especially given the fact that the SEI is directly supported by the US Department of Defense CMM and CMMI have a large installed-base, making it difficult for major changes to CMMI to be made. In the short run therefore, we can expect both models to co-exist and, perhaps, in the longer term work may be done to either combine both models or, at the very least, to make CMMI fully compliant with ISO/IEC and ISO/IEC 12207:2008 (2008) by modifying either CMMI or changing ISO/IEC or ISO/IEC Agile Software Development and SPI As was pointed out in Section 2.3, the Waterfall model is not an accurate reflection of either real life or of how projects are actually developed. Despite the fact that it appears that the Waterfall model predates the Spiral model, Larman and Basili (2003) make the case that Iterative and Incremental Development (IID) has been in existence for long before the Waterfall model. According to Williams and Cockburn (2003), beginning in the mid-1990s, many found [the] initial requirements documentation step frustrating and, perhaps, impossible. As a result of this and other issues, several methodologies were developed that allowed developers to embrace change rather than reject it. In 2001, 17 developers and authors came together to discuss their experiences and came up with the Manifesto for Agile Software Development ( The manifesto values: Individuals and interactions over processes and tools Working software over comprehensive documentation Customer collaboration over contract negotiation Responding to change over following a plan. Based on the manifesto, Agile software development methods promote development iterations, teamwork, collaboration, and process adaptability throughout the lifecycle of the project. Typically, development is characterized by short time boxes where development activities are carried out within a precise period of time. If some required functionality for that release cannot be developed 21
36 within the specified period, then it is left out rather than extending the development period. In short, the focus is on multiple, short iterations of development which allows the developers to be able to quickly react to changes or refinements in requirements. While Agile methods appear to be quite successful at overcoming the issues experienced in the Waterfall model, how do they interact with SPI models and, specifically, CMMI? While at first glance it may appear that Agile and SPI/CMMI are orthogonal in their approaches, there is a growing body of evidence to the contrary and, in fact, some research seems to suggest that these methodologies are in many ways complementary. One of the common reasons suggested for using Agile is that it is a lean approach which uses fewer resources than other methods. This, in fact, is very much in line with the goal of CMMI according to Glazer et al. (2008) when viewed holistically, CMMI s ultimate goal (i.e. continuous process improvement) is to cause an organization to become less wasteful, leaner, and more in touch with actual development progress. Jakobsen and Johnson (2008) and Sutherland et al. (2007) detail their positive experiences from mixing Scrum (an Agile methodology) and CMMI: CMMI risk management proactively addresses possible impediments before they are experienced by the team CMMI quality planning specifies more accurately and efficiently the quality targets of projects and helps developers to a better interpretation of completion criteria and sprint goals CMMI ensures that a project is tracked as a whole, not just for the current sprint CMMI ensures that agile methods are institutionalized. To further the assertion that CMMI and Agile are in fact complementary, Omran s research (2008) into Agile development methods and CMMI suggests that Small and Medium Enterprises (SMEs) can adopt Agile methodologies and CMMI to provide value to the enterprise. Microsoft have also implemented a combined Agile/CMMI approach (Anderson 2005) and by doing so have developed a truly agile full life cycle process for all 5 levels in the CMMI model. DTE Energy (Baker 2005; 2006) have combined both Agile and CMMI and DTE believes that Agile methods are an accelerator to process improvement when applied appropriately and meaningfully. There is, however, one other dimension to take into account when discussing Agile and CMMI and that is size. According to Jones (2008), Agile methods tend to break projects down into smaller projects of about function points. That withstanding, he asserts that Agile methodologies can improve productivity for projects up to about 1,500 function points. However, for larger projects in the range of 10, ,000 function points, formal control points such as change management, design, and code inspections are essential. In other words, there is a point at which Agile methods need to make way for more formality. 22
37 In summary, it appears that there is evidence to support the assertion that both Agile development methodologies and SPI in the form of CMMI are complementary. According to Jones (2008), however, there is a point where Agile can no longer be fully used in conjunction with CMMI and development must become more formal. 2.9 Costs and Benefits of SPI Consistency and Limitations of Reported Benefits of SPI There is a great variety of benefits attributed to SPI in the literature. However, before exploring the reported benefits, we must recognize that there are limitations and variations in how the results described in the literature are arrived at. El Emam and Madhavi (1996a), in their study on organizational maturity and quality, categorize existing literature in one of two categories case studies or correlational studies. Case studies, where a single organization s experiences are described, suffer from selection bias in that organizations which have not shown improvement or have even regressed over time will be reluctant to publicize their results and that organizations which have not improved to a reasonable maturity will lack the data to qualify for case-study selection. Correlational studies, on the other hand, are useful for showing a general correlation between increased maturity and effectiveness. Ideally, in order to critically and objectively evaluate the benefits as described in the literature, the results should be consistently categorized, defined, and normalized. Categorization is required to ensure that we compare like benefits with like benefits; definition is required so that any assumptions or background information is clearly described up front; and normalization is required to be able to make an objective comparison of results across organizations of various sizes, industries, and maturity levels etc. Unfortunately, normalization and consistency in both reporting and real-life are in many cases not possible for many valid reasons. Zahran (1996) points out that it seems that every organization follows its own approach to measuring the benefits of SPI since there is no common standard or models for performing cost-benefit justification of SPI. This lack of standardization is also reflected by Solon and Statz (2002) who discuss the difficulties of using benchmark SPI benefits in making business cases for the implementation of SPI. In addition, they also create a high level categorization of SPI benefits and summarize the possibilities of making benefits benchmarks (see Table 2-6), including noting where they believe there is the potential of making the benefit a benchmark benefit (the Yes/No column). In order to illustrate these issues, 3 examples which highlight the implications of lack of normalization and consistent definition are discussed here. The first example is Defect Density (DD), which is one of the most commonly cited SPI 23
38 benefits. Defect Density is typically defined as being a measure of the total number of defects in code in relation to the total number of lines of code. While this appears to be a concise and clear definition of DD, some aspects of the definition are open to interpretation. For example, what particular stage in the lifecycle does the metric refer to? Does it refer to production code, post-qa code or post-uat code? In addition, there is a normalization issue as well - does a particular DD statistic published in the literature refer to Java Code or Assemblerlevel code? Clearly in order to be able to make a comparison between two different claims in the literature, more information that just the label Defect Density is required. The second example is Productivity another widely attributed benefit of SPI. What precisely does productivity mean? Is a claim based on project productivity whereby it takes less time and resources to undertake a project as a whole or is productivity meant to define just coding productivity? Even if we are told that productivity is really project productivity, how do we compare like projects with like projects? Are they based on the same number of lines of code, the same number of developers or even the same technologies? As with DD, we need to be able to normalize common factors to be able to accurately and objectively compare benefits between one literature report and another. Finally, let us take a look at Return On Investment (ROI). ROI is a commonly used calculation (though not the most accurate) to quantify the benefits of projects, including SPI and is most commonly described as being the ratio of benefits to costs. However, a more accurate version of ROI uses Net Present Value (NPV) instead of the straight-line formula described above, while many practitioners also use the Internal Rate of Return (IRR) as a proxy for ROI (Brigham and Gapenski 1994; Higgins 1998; Ross et al. 1999; Tockey 2004). As we shall see in our discussion on ROI, there is very little clarity or consistency on which definition to use. Based on the literature review conducted for the purposes of this research, the assertions of Solon and Statz (2002) and Zahran (1996) appear to have a considerable ring of truth to them. While at a high level benefits are categorized consistently in macro terms such as ROI, Quality, Defect Density, and Reduced Cycle Times, upon more detailed review results are not normalized nor are they consistent in how benefits are defined. To be fair to the researchers and practitioners who thankfully publish their work, such inconsistency is quite understandable, bearing in mind that these benefits are the actual results of SPI initiatives reported from different organizations, of different size, in different industries with different constraints and which are independently carried out. 24
39 Benefit Yes/No Comment Increased revenue No Values vary broadly by market type and product type; revenue/employee is a normalized measure but not easily compared outside a given domain Reduced cycle time Reduced cost of operations No No/Yes Interactions with processes and tools used, as well as specific type of product, make this difficult to compare Basis of costs vary so widely by type of industry and culture, that comparison is very difficult. For comparable operations, such as corporate IT spending, there are usable benefits Level quality of Yes/No If the quality level is established through a standard test of product performance, a recognized level of quality can be assigned. Otherwise, the methods used by different organizations and their different users are unlikely to be comparable Increased productivity Yes Level of productivity (using function points to measure amount of work) works well Cost Yes/No Comment Costs of the program Yes Total cost (labor, training, speciality services, tools, travel etc.) are quite comparable, and they can be normalized by number of people in the organization benefiting from the SPI program Table 2-6: SPI Benchmarks Critical Review (Solon and Statz, 2002) In all, while there is a lot of published data to help demonstrate the benefit of SPI, there appears to be some legitimate concerns about how the studies are organized, reported on, and the data they contain. In addition, there are specific concerns about the effect of SPI on organizations Categorization of Benefits Much of the literature deals with the results of SPI from individual organizations. As such, these reports are independent of each other and they report on the benefits which those organizations find beneficial and useful to measure. While there are certainly common benefits that are of interest to most organizations ROI, Productivity, and Defect Density are amongst the most common there are also benefits which, while of interest to the community as a whole, are mentioned in only a small minority of research reports. In order to not present a disjointed review of the various benefits, I have chosen to categorize the benefits under the most common categories as seen in the literature - ROI, Productivity, Quality, Cost, Reduced Cycle Time, and Soft benefits. A slight wrinkle in this approach is the fact that, in any one piece of literature, it is common to find the results for several categories. For example, Dion (1992; 1993) refers to several benefits ROI, Productivity, Staff turnover (Soft Benefits), and Communications (Soft Benefits). The approach taken in this literature review is that the context of the research is described the first time that any of the benefits is discussed and, later, 25
40 when discussing the other benefits under the various categories, just the article is referenced and not the context of the research Return on Investment - ROI The National Software Quality Experiment (NQSE) is a mechanism for obtaining and storing samples of software quality data. It contains a micro-level database of quality data from various kinds of organizations, including industry, government, and military data. In this context, O Neill (2003), provides a model for calculating the ROI on software inspections. In addition, using data in the NSQE database, he calculates the range of possible ROI values depending on the CMM level of an organization. The CMM level of an organization is a determining factor because the higher the maturity level of an organization, the more emphasis is put on built in-quality. For example, if an organization employs modular programming methods, modular design etc. (some of the minimum characteristics of a Level 3 organization), there should be less flaws in the code and it should be more easily fixed if there are defects found the quality is baked in. Another factor that affects ROI is where the defect is found. The farther down the cycle in development that a defect is found, the more costly it will be to fix. Briefly, O Neill defines 3 Software Product Engineering KPAs being practiced: Ad-hoc Programming (AHP) common in low maturity organizations Structured Software Engineering (SSE) the minimum expectation for Level 3 organizations Disciplined Software Engineering (DSE) this is the expectation for Level 4 and 5 organizations. O Neill defines ROI from Inspections as: Where: ROI = Net Savings / Detection Cost Net Savings = Cost Avoidance Cost to Repair Now Detection Cost = Preparation Effort + Conduct Effort Based on multiplier values from the NSQE database and using the above formulae, O Neill has determined the ranges of ROI from Software Inspections (see Table 2-7). 26
41 SPE Min ROI Max ROI Min Leakage Rate (KSLOC) Max Leakage Rate (KSLOC) AHP SSE DSE Table 2-7: NSQE ROI on Software Inspection (O Neill, 2003) As we can see from the results in Table 2-7, there comes a point in high maturity organizations where ROI actually may actually decrease as a result of the high maturity of the organization. This should not be surprising as high maturity organizations have quality built in to their processes as opposed to applying ex post facto processes to ensure quality. In other words, a conscious decision must be made to enhance quality of the product at the expense of ROI. Humphrey et al. (1991) described the Software Process Improvement initiative at Hughes Aircraft. Over a 4 year period from 1987 to 1990, the Hughes Aircraft company progressed to a CMM Level 3 organization based on two reviews carried out in 1987 and 1990 respectively. From a strict ROI point of view, the assessments cost Hughes Aircraft $45,000 and a further $400,000 over the twoyear program of improvements. Hughes estimated the resultant savings to be about $2 million. The effects of a CMM-based SPI program at Raytheon Inc. are described in (Dion 1992; 1993). Specifically, Dion discusses the program that was implemented at the Software Systems Laboratory (SSL), one of eight divisions within Raytheon, and which employs about 400 software engineers. When the article was published (in 1993) the program had been underway for approximately 5 years and had cost in the order of $1 million per year. The initiative itself had progressed the division from a Level 1 to a solid Level 3 and was in fact approaching a Level 4 assessment. Overall, his study found that ROI increased by a factor of 7.7 based on a sample of six projects. Herbsleb et al. (1994b; 1994a) report on the Benefits of CMM-Based Software Process Improvement and provide some initial results of the implementation of CMM. The study consisted of publicly published reports as well as data that the SEI obtained from various early adopters of CMM. The data comes from a diverse group of organizations including Department of Defense (DOD) contractors, commercial organizations, and military organizations with a wide range of maturity levels. A summary of the aggregate benefits is detailed in Table
42 Category Range of Values Median Total yearly cost of SPI Activities $49,000 - $1,202,000 $245,000 Years engaged in SPI Cost of SPI per Software Engineer $490 - $2004 $1375 Productivity gain per year 9% - 67% 35% Early detection gain per year (defects discovered pre-test) 6% - 25% 22% Yearly reduction in time to market 15% - 23% 19% Yearly reduction in post-release defect reports 10% - 94% 39% Business value of investment in SPI (ROI) Table 2-8: Summary of Overall Results (Herbsleb et al, 1994b) Boeing STS, a division of Boeing Inc. that supports space transportation programs for the Department of Defense and NASA, achieved a rating of CMM Level 5 in July Yamamura and Wigle (1997) describe some of the major benefits that are associated with Boeing s achievement. One of the first benefits that they find is that, because Boeing STS implemented CMM at the organizational level rather than at the program level, the various other benefits associated with CMM are more easily applied when either new personnel or new programs commence the startup cost of new programs is much less than it might otherwise have been. From a quantitative perspective, an analysis of cost-to-benefit ratios showed that there are definite savings associated with SPI. As an example, they describe the formal inspection process which increased design time by 25%, which was 4% of total development effort. This 4% increase resulted in a reduction in rework effort by 31%. This translated into a 7.7:1 ROI for formal inspection alone. The Ogden Air Logistics Center s Software Engineering Division is a CMM Level 5 appraised organization. Over the years, however, they have kept many useful metrics, even though this is not officially required until CMM Level 4. Oldham et al. (1999) demonstrate the benefits associated with progression through the various levels of the Capability Maturity Model. They are at pains to point out, however, that while it can be shown that tremendous improvements have been made in the TPS (Test Program Set) process capability in both the quality of software produced and the cost to produce that software, to correlate each change made over the years to specific quantitative improvements in process productivity or product quality is impossible. Instead, we can show general relationships and overall improvement across the years. In other words, they can show definite improvements, but they cannot tie those improvements back to specific initiatives. They calculated the ROI (computed based on cost per unit of deliverable product multiplied by the number of units delivered per year) as being 28
43 19:1. In addition, from a cost reduction perspective, the Automatic Test Equipment (ATE) product line now produces software updates at a savings of 70% compared to the original costs. In reporting on the progression of the Oklahoma City Air Logistics Center (OC- ALC) from CMM Level 1 to CMM Level 4, Butler and Lipke (2000) reported that, for an investment of $6 million, the OC-ALC have calculated a reduction in cost of $50.5 million an 8.4:1 ROI. In an independent study, undertaken this time by Software Productivity Research Inc., Butler (1995) determined that there was 7.5: 1 ROI, based on an investment of $1.5 million and savings of $11.3 million. General Dynamics Decision Systems is a CMM Level 5 company that is involved in communications and information technology for both the military and the government. Out of approximately 1,500 engineers, approximately 360 are employed directly in software development. The division in somewhat unique in that it has kept extensive metrics all the way from Level 2 to Level 5. King and Diaz (2002) discuss some of the more important metrics that the General Dynamics Decision Systems has gleaned over the years, as well as explaining some of the more surprising results (see Table 2-9). In order to calculate the below ROI data, General Dynamics made the following assumptions: SPI efforts were calculated at 2.5% of the base staffing of the 360 software engineers in the division 100 KSLOC size projects over two years 16 hours to fix a software defect after release Calculations do not take into account being able to apply existing resources in pursuit/execution of new business opportunities. CMM Transition Level Cost for SPI in hours (2.5% of base) Cost Savings on Re-work (hours) ROI CMM Level 4 to ,009 14% CMM Level 3 to 4 1,310 2, % CMM Level 2 to 3 2,544 6, % Table 2-9: General Dynamics ROI results (King and Diaz, 2002) As we may see from the figures above, an ROI of 1.14:1 is not a very dramatic ROI. However, King and Diaz make the point that the transition to Level 4 is very transitory and short lived, and most companies will progress from Level 3 to 29
44 Level 5 within a year so, in effect, we are dealing with a relatively small amount of time for the transition period. To further support the argument that ROI increases as a result of implementation of CMMI, the SEI (2005) reported an increased ROI of between 2:1 and 27.7:1%, with a median increase in ROI of 4.7:1, based on 16 separate data points. Van Solingen (2004) presents two in-depth cases studies where he calculates the ROI from the implementation of SPI. The first case study is based on a systems development department in an industrial company that produces and services systems for fuel stations. The reported ROI is 1:1.13. The second case study is built on an organization that develops and services a software simulation package that can execute virtual tests using finite-element modelling and reported an ROI of 1:8. In summary, there appears to be clear evidence of a correlation between increased ROI and implementation of various SPI initiatives. However, there also seems to be a trade-off between ROI and Quality, which would seem natural. In the case of SPI programs like CMM and CMMI, the higher an organization progresses up the maturity ladder, the more quality processes are put in place and therefore there is a tendency for ROI to taper off as a result Productivity Boehm (1981), in his ground-breaking work on Cost and Effort estimation, describes the Constructive Cost Model (COCOMO), a method for determining cost and effort information for various project types, which is based on the traditional and now out-of-favour Waterfall life cycle model (Royce 1970). The COCOMO model itself consists of several models: A Basic model which is good for quick, early, rough order of magnitude estimates of software costs An Intermediate model, which is useful in the more detailed stages of project definition and design A Detailed Model, which is useful after a project has been fully specified. All the qualitative data behind the model is based on a project database of 63 projects. Between the initial publication in 1981 and the publication of the COCOMO II model (Boehm et al. 2000), the database has grown significantly in size. 30
45 Many changes have occurred in the years since the original publication of COCOMO: As a civilization, we have become more dependent on software than we were in 1981 New generations of software processes and products have totally changed the software landscape As a result, Boehm et al. have updated the COCOMO model and come up with COCOMO II. To support various software marketplace sectors, COCOMO II provides a family of increasingly detailed cost estimation models. From an SPI perspective, the most important update to the model is that it recognizes the effect of Process Maturity (PMAT) on the software development process. For COCOMO II, PMAT may be calculated in two ways: Based on the results of an organized CMM evaluation By determining the percentage compliance for each KPA Clark (1997) proposes a mathematical model that segregates Process Maturity s influence on effort from other influencing factors. This work is incorporated into COCOMO II. According to Clark s research, he has demonstrated that a conservative estimate is that for a one level change or a 10% change in PMAT, there is between a 15.3% and 21% decreasing change in software development effort and, as a result, a consequent change in Productivity. In a series of articles and technical reports Herbsleb and Goldenson (1995; 1996) and Herbsleb et al. (1997) discuss a survey they undertook in order to address assorted weaknesses of various previously published studies. For their sample, they used the SEI s appraisals database and limited themselves to appraisals conducted no less than one year before the study and no more than 3 years before it. In all, they found 155 appraisals that met this criterion. This population eventually led to the sending out of 167 questionnaires, with a subsequent return rate of 83%. In addition to maturity ratings, the respondents were asked to indicate where their organization stood on several performance measures, including ability to meet schedule and budget commitments, staff morale, product quality, customer satisfaction, and staff productivity. Their findings 2 are presented in Table These results are taken directly from the graphs in the referenced paper and are therefore approximate to the actual results 31
46 CMM Level 1 Initial CMM Level 2 Repeatable CMM Level 3 - Defined Productivity 54% 68% 88% Table 2-10: CMM productivity results (Herbsleb, Goldenson et al, 1995) Brodman and Johnson (1995; 1996b; 1996a) investigate the effect of implementation of CMM Levels 1 through 5 on the ROI and productivity of organizations. A total of 33 companies were interviewed, 11 of which were surveyed via questionnaire, 13 by interview only, and the remainder by both. The companies selected were at various levels of the CMM. The first issue they had was in the definition of ROI. While there are some classical definitions of ROI (Brigham and Gapenski 1994; Higgins 1998; Ross et al. 1999), the government perspective of ROI was focused on the dollar value of ROI, while nongovernmental organizations focused on benefits and effort involved. They concluded that the government is focused on dollar savings because of budgets that continue to get smaller, while commercial organizations think of various benefits which eventually add to the bottom line. Based on their study, they point to the following increases in productivity as a result of implementing CMM (see Table 2-11). Category Measurement Data* Productivity Increase in productivity 10-20%, %, 50%, 15-20%, 130%, 12%, 6.4%, 35% *Benefits are shown as a range of results within a single organization; results from different organizations separated by commas; all organizations not represented Table 2-11: Productivity Results (Brodman and Johnson, 1995) A decision was made by Harris Information Systems Division to create a Data Processing Laboratory (DPL). The function of the DPL was to prototype software for independent research and development projects. As part of its development, the division started the adoption of CMM in 1990, achieving Level 3 in early Robeson et al. (1997) describe the DPL, its structure and the benefits it has derived from a combination of new technologies and SPI. Every system developed by the DPL uses the same process, the only difference being the level of formality and documentation which depends upon whether the system is a prototype or whether it will ultimately be a full-blown production system. From beginning to end, the combination of software reuse, an architecture framework, an incremental development process, and a cadre of trained staff has produced a 2.5 times increase in productivity. Unfortunately, while these figures are encouraging, the paper does not explore how much of the benefits are attributable to SPI versus the other changes in the environment during the time period discussed. 32
47 Diaz and Sligo (1997) describe SPI in Motorola s Government Electronics Division (GED) and the various performance improvements brought about as a result of that division s implementation of CMM. The performance data was obtained from various projects whose CMM level was determined by the project s internal self-assessment. The results are detailed in Table SEI CMM Level Number of Projects Productivity (Relative) 1 3 n/a Table 2-12: Productivity results (Diaz and Sligo, 1997) Productivity is defined by them as the amount of work produced divided by the time to produce that work. They noted that there was a decrease in productivity between Levels 2 and 3 which they attributed to the sheer amount of new KPAs in Level 3. The total of all process improvement activities was approximately a 1.5% investment in base staffing (approximately $90,180) for a return of $611,200 or 677%. The returns were mainly realized through less rework due to less quality defects. In 1999, the Oklahoma City Air Logistics Center (OC-ALC) was awarded the IEEE Award for Software Process Achievement in recognition of its efforts in the application of Software Process Improvement to its development and testing work. In their report, Butler and Lipke (2000) detail both the origins and results of this effort. The OC-ALC is responsible for developing and maintaining Test Program Sets (TSPs) that are used with Automatic Test Equipment (ATE). A TPS is the software, hardware, and documentation used to test avionics and jet engines. The organization itself is composed of about 360 software engineers that, for example, in 1999 performed services utilizing about 496,000 hours of labour having a value of $33.5 million. OC-ALC was one of the first adopters of the Capability Maturity Model, starting with their initial assessment as a Level 1 organization in In late 1992, they were re-assessed as a Level 2 and again in 1996 as a Level 4 organization. In 1998 they attained ISO 9001/TickIT certification. In order to justify their expenditures on SPI, OC-ALC has taken great efforts to keep metrics regarding the various benefits associated with SPI. Specifically, they have examined what they consider to be ROI from 3 different perspectives. From a productivity and defect perspective, OC-ALC has reported 33
48 the following metrics (note that the productivity decrease in 1999 is attributed to the B-2 TPS project, where the Air Force levied a particularly detailed quality process). The results are detailed in Table TPS Development Effort (man-hours) Table 2-13: OC-ALC Productivity Data (Butler and Lipke, 2000) In addition to formal assessments, the Air Force requested an independent study of the benefits of SPI in This study was undertaken by Software Productivity Research Inc. and is described by Butler (1995). 4 projects were chosen as being representative of the work being undertaken by OC-ALC. The study was composed of both interviews and data collection. In the study, they determined that there was a 10 times increase in productivity from the baseline project to the most recent project as it stood in 1994 (while OC-ALC was at CMM Level 2, working its way to Level 4). Further evidence to support increases in productivity as a result of SPI is provided by King and Diaz (2002) who provide a history of General Dynamics Decision Systems transition from a CMM Level 2 organization to a Level 3 one. Of the various benefits detailed in the article, probably the most interesting finding in this paper concerns productivity. King and Diaz assert that productivity is affected by factors other than just process maturity, the most important of which is technology change. In addition, as organizations increase in maturity, more reusable high quality code becomes available, thus increasing the overall quality and productivity of code within the organization. Thus, maturity alone does not necessarily correlate to increased productivity as many papers on the benefits of SPI seem to imply. It is also interesting to note here that the authors also note that the transition from Level 3 to Level 4 does not result in a statistically significant change in productivity. This is attributed to Level 4 being more of a transitionary state for organizations on their way to Level 5 organizations do not tend to stay very long at Level 4. 34
49 CMM Level Productivity 2 1 x 3 2 x x x Table 2-14: General Dynamics Productivity Benefits per CMM Level (King and Diaz, 2002) Goldenson and Gibson (2003a) detail some preliminary results from the application of CMMI process improvement. In particular, they quoted a 30% increase in Productivity as a result of implementation of CMMI. In a follow-up to the initial 2003 report, the SEI (2005) attributed productivity increases as a result of implementation of CMMI of between 9 and 255%, with a median value of 62%. Garmus and Iwanicki (2007) report on the outcome of a project in which they were contracted to identify, select, and integrate measurement into a client s software development process to determine the impact of implementation of CMMI Level 3. They reported productivity increases of 132% (based on Function Point/Effort Month), and an effort reduction by 50%. Dion (1992; 1993) also reported Productivity increases of a factor of 2.3 in a 5 year time period as a result of implementing CMM. Also reporting productivity increases as a result of implementation of CMM is Herbsleb et al. (1994b; 1994a). Their report shows a productivity increase of between 9 and 67% over a wide range of maturity levels after implementing CMM, with the median increase being 35%. With respect to CMM and CMMI there is consistent evidence of increases in productivity which coincide with the implementation of CMM/CMMI. However, there is also evidence to suggest that the rate of increase in productivity is not uniform or increasing as organizations implement higher CMM/CMMI levels. This is attributed to the work required to implement extra KPAs as organizations progress up the ladder. In addition, some research suggests that at least part of the productivity increases relates to technological innovation as a result of process improvement Quality Perhaps one of the first reported improvements as a result of an SPI initiative was that of Fagan (1976; 1986). In his articles, Fagan reported that, as a result of the implementation of software inspections, for double the amount product source code, the defect density was the same as 2/3 of defect density for preimplementation samples (IBM System/370); 0 defects were reported in return for a development resource reduction of 25% (AETNA); there were 0 defects in use for 9% reduction in development effort (IBM RESPOND); and 0.15 defects/ksloc for 95% reduction in cost. Applying Fagan s Inspection Method 35
50 to requirements specifications, Doolan (1992) reports that, for every hour invested in inspection, nearly 30 are re-couped. Rubin (1993) undertook a study of more than 200 North American and 157 international organizations to determine the extent to which those companies applied rigorous software engineering techniques and to what extent software metrics were being used within the organizations. Of the international companies, 115 were from the United Kingdom. The UK-based companies appeared to be more mature (as measured by the SEI s CMM). From the analysis he carried out it appears that introducing process rigor and maturity to the level of UK penetration with adequate toolset support has the potential to boost productivity by about 50% in the short term in contrast to current views on tools alone. Even though there was very little UK-based quality data in the study (as measured by defects per KLOS), it tended to be much better than the equivalent US data 2 defects/kloc for the UK vs. 4 defects/kloc for the US. The NASA Software Engineering Laboratory (SEL) was the first recipient of the IEEE Computer Society Software Process Improvement Achievement Award. In their report of SEL s achievements, McGarry et al (1994) described their approach, compared it to CMM and detailed the various benefits they derived from the implementation of the various SPI initiatives they undertook. The SEL was created in 1976 at the NASA/Goddard Space Flight Center (GSFC) for the purpose of understanding and improving the overall software process and products that were being created within the Flight Dynamics Division (FDD). The SEL is actually a partnership of 3 separate organizations: NASA/GSFC responsible for project management activities University of Maryland - responsible for research activities Computer Sciences Foundation responsible for development resources. The SEL experiments are carried out on production FDD systems on projects ranging from 10 KSLOC to 1.5 million SLOC with a production staff of approximately 300 developers and analysts. SEL s approach to SPI is very different from the model used by the CMM. The SEL approach is a bottom-up approach where it assumes changes are driven by local goals, characteristics, requirements, and product attributes. CMM, on the other hand, uses a top-down approach where an organization compares itself to some generally accepted highquality standard processes. From an impact perspective, SEL has found very positive benefits from its approach. It measures these benefits using defect density and cost/cycle time: Defects: from a range of 1.7 defects/ksloc 8.9 defects/ksloc with an average of 4.5 defects/ksloc, they have improved to defects/ksloc with an average of 1 defect/ksloc. 36
51 From an SPI overhead perspective, SEL activities have cost approximately $25 million in an organization that has spent $250 million on software development and maintenance. This figure is reasonably in line with other quoted SPI overhead costs. NASA s (National Aeronautics and Space Administration) SEL (Software Engineering Laboratory) has spent 10 years undertaking an SPI initiative at their Goddard Space Flight Center. Reporting on the SEL in 1994, Krasner et al. (1994) report significant improvement as a result of the SPI effort predicted costs always within 10% of actual costs; only one deadline missed in 10 years; maintenance cost of code is approximately $20/hour, versus double that at other IBM software facilities; defects of 0.01 per KSLOC; and an increased error detection rate of 95%. In a follow-on report in 1995, Krasner (1995) reported a reduction in error rates of 75% between 1985 and 1993; a reduction of software development costs by 55%, increase of reuse by 300%; the average cost to develop a line of cost dropped by 10%; in addition, costs have become more predictable and there are now near-zero defects in the code produced there. Advanced Information Services (AIS) is an independent software contracting organization that is based in Peoria, Illinois with a satellite office in the Chicago area and a subsidiary in Chennai, India. The AIS development group consists of between 20 and 35 engineers. The SPI initiative was started in 1992 and went through phases: Prior to 1992 no SPI was being used , where the Capability Maturity Model was used onwards, where both CMM and the Personal Software Process (PSP) were used together. In 1992, AIS performed a self-assessment and determined that they were a Level 1 organization. In 1996, an independent assessor identified a few improvement opportunities and in 1999, AIS was assessed as a Level 3 organization. In 1999, AIS was awarded the IEEE Computer Society Software Process Achievement Award. In their paper, Ferguson et al (1999) identified many benefits from the implementation of SPI. In particular, they identified: Decreased schedule deviation from 112% in pre-spi, 41% in the CMMonly era, and 5% schedule deviation in the CMM + PSP era Effort predictability deviation went from 87% in the pre-spi ere to 37% in the CMM-only era, and -4% in the CMM + PSP era System test duration dropped from 1.45 days per KSLOC in 1990 to approximately 0.4 days per KSLOC in
52 In comparing PSP to the two non-psp eras, defect density dropped from 1 defect/kloc for non-psp to 0.35 after the implementation of PSP Productivity also increased after the implementation of PSP from approximately 7.2 LOC/hour to 8.6 LOC/hour. Liu (2007) reports significant improvements as a result of Motorola s implementation of CMMI Level 5 in their sites in China. The metrics used in the study were Cost Of Quality (COQ), product quality, and estimation accuracy. Between 2003 and 2006, COQ was reduced from approximately 35% down to 25%, fewer defects were inserted into code and the faults per line of code was found to have been reduced by 13.01% from its pre-cmmi Level 5 level. In addition, initial effort estimation was found to have improved by almost 33%, Herbsleb at al. (1994b) reported an early detection gain in defects discovered pretest of between 6 and 25%, with a median gain of 22%. In addition, they reported a yearly reduction in post-release defects of between 10 and 94%, with a median reduction of 39%. Yamamura and Wigle (1997), in their report on their implementation of CMM Level 5, report on the defect detection rate. Initially, their processes were finding 89% of the defects thus leaving 11% still baked in. After the SPI program, virtually 100% of all defects are found, reducing escapees to nearly 0. Putnam and Myers (1997) reported that Quality Improvements (by defect ratio) fell from just over 0.1 defects per 1 KSLOC to 0 defects per KSLOC. Several SEI technical reports, (Herbsleb and Goldenson 1995; 1996; Herbsleb et al. 1997) report increasing levels of Quality as organizations move up the CMM maturity levels (see Table 2-15). CMM Level 1 Initial CMM Level 2 Repeatable CMM Level 3 - Defined Product Quality 76% 90% 100% Table 2-15: Quality Results (Herbsleb et al., (1994b) Brodman and Johnson (1995; 1996b; 1996a), based on the results of their surveys, report Quality increases as a result of implementation of CMMI (see Table 2-16). 38
53 Category Measurement Data* Quality Reduction in defects 10%, 80%, 50-70%, 50% Reduction in error rate 45% Effort Reduction in rework 5-10% from 40% down to 25% effort from 41% down to 11% of project cost Savings in test time Product error rate 10 hours per 1 analysis hour from 2.0 down to 0.11 KSLOCS from 0.77K down to 0.13 per KNCSS *Benefits are shown as a range of results within a single organization; results from different organizations separated by commas; All organizations not represented Table 2-16: Quality Results (Brodman and Johnson, 1995) Robeson et al. (1997) in their paper report a 90% reduction in Defect Rates as part of their implementation on CMM Level 3. Diaz and Sligo (1997) report a significant increase in Quality as a result of Motorola s systematic implementation of CMM (note that Quality is defined by In-Process Defects / Millions of Earned Assembly-Equivalent Lines Of Code) (see Table 2-17). SEI CMM Level Number Projects of Quality (In Process Defects/MAELOC) 1 3 n/a Table 2-17: Quality Results (Diaz and Sligo, 1997) Butler and Lipke (2000), as part of their research into the Oklahoma City Air Logistics Center s (OC-ALC) implementation of Level 4 CMM, found an increase in Quality as the center progressed from CMM Level , to Level 4 in 1996 (see Table 2-18). 39
54 Year Delivered Defects per KSLOC Table 2-18: Quality Results (Butler and Lipke, 2000) An independent study undertaken by Butler (1995) confirmed the increase in Quality by ascribing a 90% reduction from the baseline project to the second project. According to King and Diaz (2002), Quality (as measured in CRUD/KSLOC) increases as a result of the implementation of the new KPAs for each successive level in CMM the Peer Review KPA is responsible for Level 3 values, the Quantitative Process Management and Software Quality Management KPAs in Level 4, and the Defect Prevention and Process Change Management KPAs in Level 5. They also note, as does O Neill (2003), that for higher maturity levels, it becomes progressively more difficult to reduce defect density. CMM Level Percent Rework CRUD Density per KSLOC % % % % 0.19 Table 2-19: Quality Results (King and Diaz, 2002) As part of their research into the initial results of implementing CMMI, the SEI (2005), based on 20 separate data points, has attributed Quality increases of between 7 and 132%, with a median of 50% to the successful implementation of CMMI. From a defect perspective, McLoone and Rohde (2007) find a significant reduction in the Hours/KSLOC metric and another reduction in the Dollars/KSLOC cost while Garmus and Iwanicki (2007) report a reduction in defect density of 75%. Given the studies analysed in this section, as organizations implement more quality-oriented processes, the quality of code improves. As more and more quality processes are included in the CMM/CMMI levels, the farther up organizations move in the CMM/CMMI maturity ladder, the higher the level of 40
55 quality becomes. Unfortunately, as noted, this comes at a price as it becomes more difficult, and therefore more costly, to reduce the amount of defects the more mature an organization becomes. Not only is this evidenced by the data described in this section but, further evidence of this was noted earlier when discussing ROI in that, after a certain point, ROI can actually decrease as organizations become more mature Cost Costs are obviously a critical component of the benefits of SPI from a financial perspective. Evidence of the financial benefit resulting from the implementation of SPI may be expressed as a ratio of cost to benefit (or vice versa) or as a discussion of costs and benefits separately. Unfortunately, however, much of the literature available tends to centre around ratios and not explicitly on straight costs and benefits. Brodman and Johnson (1995; 1996b; 1996a) report cost savings as a result of implementing CMM (see Table 2-20). Category Measurement Data* Cost Project$ saved to $ invested 1.5/1, 2.0/1, 4/1, 6/1, 7.7/1, 10/1, 1.26/1, 5/1 Project$ saved Code problems during integration $2-3.4 million 20% of original value Decrease in cost of retesting 50% Cost savings of metrics program %, % *Benefits are shown as a range of results within a single organization; results from different organizations separated by commas; all organizations not represented Table 2-20: Cost Savings (Brodman and Johnson, 1995) In addition, Goldenson and Gibson (2003b) note some very important cost benefits arising from their early study on the adoption of CMMI. Among the more important benefits are a 60% reduction in work and fewer outstanding actions following pre-test and post-test audits and a 10% improvement in first pass yield leading to reduction in re-work. In a 2005 follow-up to this report, the SEI (2005) has published a new set of figures indicating a cost reduction of between 3 and 87% as a result of implementing CMMI, with a median cost reduction of 20%. This is based on 21 separate data points. 41
56 McLoone and Rohde (2007) identify 5 indicators of efficiency within Lockheed Martin Integrated Systems and Solutions (IS&S) and try to correlate these metrics with not only various levels of the SW-CMM but also between SW-CMM Level 5 and CMMI Level 5. Within US government organizations, payments to contracting organizations are frequently based on a Costs-Plus-Award-Fee basis. They report an increase in award payments between SW-CMM Levels 2 and 3 and a significant increase as they moved from SW-CMM Level 3 up to SW-Level 5 and another increase when they migrated from SW-CMM Level 5 over to CMMI Level 5. Significantly they report a decrease in Overhead Rates from SW- CMM Level 3 to CMMI Level 5. This is interesting in itself as there has been considerable discussion within the CMMI community as to the effect on costs of moving to CMMI Level 5. A total elimination of late deliveries of software from August 2004 to January 2005 has been reported by Sapp et al. (2007). Their study compared two samples of completed projects which were randomly selected, stratified, and balanced to include similar projects and project managers. There were significantly less variances in cost after implementation of CMMI Level 5 the 95 th percentile confidence interval for the pre-cmmi Level 5 projects ranged from -6.4% to +7.78% while the post-cmmi Level 5 interval ranged from -1.0% to +7.4%. McGarry et al. (1994), using the SEL s bottom-up SPI approach report that, using similar projects, the baseline cost ranged from staff months with an average of 490 staff months before SPI implementation, to a new range of staff months with an average of 210 staff months after SPI implementation an over 50% reduction in cost. In their technical reports, Goldenson, and Herbsleb (1995; 1996), and Herbsleb et al. (1997) report increasing abilities to meet budget as organizations move up the CMM maturity levels (see Table 2-21). CMM Level 1 Initial CMM Level 2 Repeatable CMM Level 3 - Defined Ability to meet budget 41% 57% 67% Table 2-21: Cost Benefits (Goldenson et al., 1995) In summary, therefore, there is considerable evidence to support assertions that SPI does indeed reduce cost. We must be mindful, however, that cost is only one factor that organizations typically wish to drive down and, it could be argued, that many organizations would put quality ahead of cost as a driving benefit of SPI. 42
57 2.9.7 Reduced Cycle Time In their study on Schlumberger s Software Improvement Program, Wohlwend & Rosenbaum (1994) describe the CMM-based Software Process Improvement program at Schlumberger s Laboratory for Computer Science. Schlumberger s main businesses include well-site exploration, and production services for the petroleum industry; testing and electronic transaction products; and metering products which are sold to public utilities, governments, laboratories and industrial plants worldwide. As many of their products contain software, Schlumberger founded a central Computer Science laboratory in It is under the auspices of this laboratory that Schlumberger s software improvement program was managed. For their purposes, Schlumberger concentrated on progressing to CMM Level 2. Table 2-22 shows the results of the metrics they captured. In general, it appeared that it took months for significant improvement to occur. KPA Pre-Level 2 Metrics Level 2 Metrics Requirements Management 34 validation cycles (code/test/re-code) Software Project Planning 51% on schedule in 1990 Software Project Tracking and Oversight 50% schedule adherence rate in validation cycles Productivity doubled 89% on schedule in % on schedule in % schedule adherence rate in 1991 Defect Density Software Quality Assurance 400K NCSS; average defect rate of 0.22 KNCSS % of total product defects were post-release defects discovered by the customer 99% schedule adherence rate in K NCSS, average defect rate of 0.13 KNCSS % reported by customers % reported by customers Table 2-22: SPI results (Wohlwend and Rosenbaum, 1994) Putnam and Myers (1997) found that the schedule and cycles times for the average Automatic Test Equipment development time has dropped from approximately 1120 working days in 1991 to about 200 in 1996 while Schedule Variance is now less than 5%, compared with an average variance of 70% for DOD projects. 43
58 In their study, Lawlis et al. (1995). were able to show that for CMM Levels 1, 2, and 3, there is a correlation between CMM rating and the Cost Performance Index (CPI) and Schedule Performance Index (SPI) for organizations where: CPI SPI = = BCWP ACWP BCWP BCWS and BCWP = Budgeted Cost of Work Performed ACWP = Actual Cost of Work Performed BCWS = Budgeted Cost of Work Scheduled The data for the study was gathered from Air Force software development projects that met the following criteria: Projects tracked software-specific cost and schedule data in Cost/Schedule Control Systems Criteria format Contractors were rated using the SEI s CMM Relevance of cost and schedule data to the rating could be established. Eleven DOD contractors and 31 software projects fell into these criteria. Using this data, Lawlis at al. were able to show a correlation between CMM rating and the cost and schedule performance of a generally representative sample of historical development contracts. In their technical reports, Goldenson, et al. (1995; 1996) and Herbsleb et al. (1997) report increasing abilities to meet schedule as organizations move up the CMM maturity levels (see Table 2-23). CMM Level 1 Initial CMM Level 2 Repeatable CMM Level 3 - Defined Ability to meet schedule 41% 57% 80% Table 2-23: Schedule Results (Goldenson et al., 1995) Diaz and Sligo (1997) report a significant decrease in Cycle Time as a result of Motorola s systematic implementation of CMM (note that Cycle Time is defined as the amount of calendar time for the baseline project to develop a product divided by the cycle time for the new project) (see Table 2-24). 44
59 SEI CMM Level Number Projects of Cycle Factor) Time(X Table 2-24: Cycle Time results (Diaz and Sligo, 1997) Butler and Lipke (2000), as part of their research into the Oklahoma City Air Logistics Center s (OC-ALC) implementation of Level 4 CMM, have found a decrease in Cycle-time as the centre progressed from CMM Level , to Level 4 in 1996 (see Table 2-25). TPS Development Cycle-time (months) Table 2-25: Cycle Time results (Butler and Lipke, 2000) Goldenson and Gibson (2003b) note some very important schedule benefits arising from their early study on the adoption of CMMI. Among the more important benefits are an increase in the percentage of milestones met from approximately 50% to approximately 95%, a decrease in the average number of days late from approximately 50 to fewer than 10, an increase in the though-put resulting in more releases per year, an improved and stabilized Schedule Performance Index, a reduction by half the amount of time required to turn around releases, a 15% improvement in internal on-time delivery, an improved predictability of delivery schedule, and a decrease in schedule variances decreased as process maturity increased. In a follow-up report published in 2005, the SEI (2005) has again indicated a reduced schedule time of between 2 and 90%, with a median reduction in schedule of 37%, based on 19 separate data points. 45
60 Sapp et al. (2007) report a total elimination of late deliveries of software from August 2004 to January From a schedule variance perspective, the 95 th percentile confidence interval for the pre-cmmi Level 5 projects ranged from % to +2.0% while the post-cmmi Level 5 interval ranged from -2.5% to +0.2%. Garmus and Iwanicki (2007) similarly report a reduction in project duration of 50%. There have been a wide variety of time-related benefits reported as a result of SPI implementation. These time-related benefits are reported as either a reduction in time-related project delays or adherence to published project schedules Soft Benefits The literature reports many soft benefits resulting from the implementation of SPI. These reports are summarized in Table 2-26 and are reported by source. Where specific quantitative data has been provided in the literature, this is included in the Qualitative Results column. Source Soft Benefit Qualitative Results (where published) Humphreys and Snyder (1991) Increased pride in developers work Increased quality of work life Less overtime hours Less serious issues to deal with (Dion 1992; 1993) Less turnover in software engineers due to less late nights and weekends spent in work Improved communications Yamamura and Wigle (1997) Increased customer 97% 100% customer satisfaction Increased satisfaction employee Table 2-26: Summary of reported soft benefits of SPI satisfaction in surveys Employee satisfaction survey increased from a mean of 5.7 to a mean of 8.3 where a value of 1 is highly dissatisfied and 10 is extremely satisfied 46
61 Putnam and Myers (1997) Hyde and Wilson (2004) Goldenson, Herbsleb, and Zubrow (1995; 1996; Herbsleb et al. 1997) More constrained in performing job 10 agreed, 4 saw no difference, and 4 said they were less constrained Easier to perform duties 13 thought it was much easier, 2 felt it was a little easier, 2 about the same, and 1 said it was harder Fewer surprises 13 agreed, 4 saw no difference, and 1 felt there were more More input into project plans 12 felt they had more input, 2 felt they had a little more, 2 felt they had the same, and 2 felt they had less CMM efforts had been successful Better quality software produced Improvement in quality of work life Increased organizational communication Increased organizational learning and efficiencies Increased level of coherency in organizational culture Neutral in relation to the improved ability of the organization to attract new staff, retain staff, and develop the careers of professionals Increased customer satisfaction Increased staff morale Table 2-27: Summary of reported soft benefits of SPI (cont.) Unanimous 16 felt they now produced better quality and two felt the quality had not changed 78% at Level 1, 69% at Level 2, and 100% at Level 3 22% at Level 1, 50% at Level 2, and 60% at Level Critical Analysis of SPI To say that SPI in itself is the silver bullet for the software development process would be less than disingenuous. Nothing in life is free and SPI is no exception to this rule. Various criticisms such as cost, rigidity in approach, and the size of the administrative overhead associated with SPI have all been levelled at SPI strategies or more particularly Formal SPI (the definition of which shall be given shortly). Indeed the core work of this thesis, where it is now possible to identify which specific Process Areas should be performed as a response to a business objective, is a response to the rigidity and cost criticisms levelled at SPI. According to Jones (2008): 47
62 [ ] the value of the CMM and the CMMI are directly proportional to the size of the software applications being developed. For small applications of 1,000 function points or lower, the CMM and the CMMI tend to reduce productivity but raise quality. This is due to the overhead built into the CMMI approach. [ ] In fact, for applications larger than 10,000 function points, CMM Level 5 has about the best record of success yet recorded. Fayad and Laitinen (1997) have reservations about the necessity of the assessment of an organization s CMM level of maturity as they contend that it may sometimes be wasteful for various reasons including cost and repeatability. Gray and Smith (1998) also report on what they believe to be several limitations on software process assessment. Chief amongst those concerns are the repeatability and reproducibility of software process assessments as well as how one arrives at the definition of an ideal model. Gray and Smith are also of the opinion that a substantial number of [SPI benefits] have not been demonstrated. The issue of repeatability and reproducibility of software process assessments is also reflected in the work of Bollinger and McGowan (1991). In the general sense of demonstrating positive results, Galin and Avrahami (2006) find that no one paper provided conclusive evidence of the benefit of CMM program investment. Herbsleb at al. (1997) also point out that there are only a few data points available regarding the actual cost of the implementation of SPI programs. Pressman (1996) criticizes CMM in particular. His chief concern is that it represents a destination, not a road map where management frequently does not provide adequate resources for proper implementation and, even when resources are committed, it is frequently conducted by committee, with predictably poor results. Commitment of resources and staff to SPI is also cited by Abrahamsson (2001) as a reason for failure of SPI programs. El Emam and Briand (1997) report that many organizations find that the early adoption of certain process areas is more effective than in the recommended sequence. Ashrafi (2003) investigated the impact of SPI methodologies on software quality, specifically CMM and ISO His empirical study indicates that in general process improvement enhances software quality factors but the level of impact is dependent upon the methodology used. Specifically for CMM however, the results were somewhat inconsistent. Blanco et al. (2001) in their review of 91 returned questionnaires from 273 organizations who implemented various process improvement experiments found that the organizations in question saw very little evidence of quantitative benefits and, regarding the subjective evaluation of the business benefits achieved, most respondents agreed that the only benefit was an increase in the product s quality. Shaikh et al. (2009), in their study on the strengths and weaknesses of Maturity Driven Process Improvement as implemented by CMM/CMMI, find that many of these efforts fail because of lack of management commitment, wrong motivation for the personnel working on the effort, and that is it not suitable for small organizations. 48
63 There have been legitimate criticisms levelled at some SPI models, particularly for smaller-sized projects. In the case of these SPI models, irrespective on the size of the projects, it is up to individual organizations to balance the increased costs of assessment and accreditation, the increased size and overhead associated with the SPI model, and any issues arising from rigidity in application of the model with the benefits to the organization as a whole Business Process Improvement Literature Review The section explores both Business Process Improvement (BPI) and the impact and integration of IT and IT processes and techniques with BPI. In the same way that Software Process Improvement endeavours to optimize the software process, BPI endeavours to optimize the underlying business processes within organizations. According to Povey (1998), BPI is a broad term that covers a continuum from incremental continuous improvement (CI) at one end to the radical re-engineering of the businesses and its processes, characterized as business process re-engineering (BPR), at the other. MacDonald (1997) reflects this when he categorizes BPI into three different approaches process improvement, process redesign, and process re-engineering. Valiris and Glykas (1999) also agree that there is a continuum in BPR ranging from incremental to radical. The methodologies in use today have their origin in the earlier discipline of organization and methods from the 1970s (Webster 1973). Over time, BPI matured and again gained prominence through a series of books and research papers in the 1990s. Within the gamut of BPI and BPR, there is a specific class of business processes which can be described as being of high task complexity and high knowledge complexity and are referred to as knowledge-intensive processes (Remus and Schub 2003) and which Dalmaris et al (2007) refer to as Knowledge-based Business Process Improvement (KBPI). Clearly the intersection of both BPI and SPI falls within this category of business processes. Central to much of the work on BPI is the role of IT in BPI. As early as 1990, Davenport and Short s work (1990), for example, contended that IT can also have a stronger role in business process redesign than that of a useful tool. They think of the relationship between IT and Business as being recursive and that thinking about information technology should be in terms of how it supports new or re-designed business processes, rather than business functions of other organizational entities. The existence of this extremely close relationship is also supported by Valiris and Glykas (1999). Hammer (1990) and Hammer and Champy (1990) also echo these sentiments when they states that we should use the power of modern information technology to radically redesign our business processes in order to achieve dramatic improvements in performance. According to Beer et al. (1990), attaining business objectives is the ultimate target for any change program. Dyba (2005), in a quantitative survey of 120 software 49
64 organizations, demonstrated that SPI success is positively associated with business orientation. Unfortunately from an SPI perspective, however, Debou and Kuntzmann-Combelles (2000) contend that the major bottleneck to the success of SPI initiatives is the lack of business orientation in how the program is run. They attribute this bottleneck to several factors including inadequate allocation of resources, the belief that SPI is just a level certification exercise, and the lack of software management skills. However, they believe the number one cause of SPI program failure is the general lack of business orientation of the program and the actors, reflected by the missing link with business strategy and goals. They back up these assertions with experiences and lessons learnt from two industry sources in the telecommunications and defence industry. In a similar theme, Reiblein and Symons (1997) point out that a shortcoming of the ISO-9001 and CMM approaches to SPI is the lack of explicit connection to the business goals of the organization in question. Specifically with regard to CMMI, Liu et al. (2006) state that there exists a disconnect between business goals and maturity levels. As a result of the apparent disconnect between BPI and SPI, some researchers have tried to bridge the gap. Damij et al. (2008) propose an object oriented methodology called TAD (Tabular Application Development) in the field of business process modelling and improvement. The first three phases deal with business process identification, modelling, and improvement. In the paper, they apply their methodology to a business process representing a surgery, though there is nothing to stop the process being studied being SPI. Hinley and Reiblein (1995) present a case study on assessing improvements to software processes in relation to meeting organizational need and management objectives. The case study is based on the application of GQM (Basili and Weiss 1984) as a means to determine how closely a process is to achieving business goals and objectives. The case study used reduction in the cost of software maintenance as a business goal and then used GQM to measure compliance with that objective. Reiblein and Symons (1997) assert that one of the shortcomings of the ISO-9001 and CMM approaches to process improvement is the lack of explicit connection to the business goals of the organization in question. The representation that these models have of the business is the ideal world, not the world that an organization actually resides in. They contend that the business sees this as a deficiency as the initiation of a meaningful process improvement plan can only take place if the current state of affairs and not the idealized world is used. As a result, they propose comparing the assessed capability profile of an organization against the target capability profile of an organization and they describe a method which uses business goals and objectives to arrive at the target capability profile. Thus they can use an ISO/IEC assessment to couple business goals and objectives to SPI. A different approach to the integration of business objectives and SPI is taken by Liu et al. (2006). In their paper on the integration of business goals and CMM, as well as a follow-on paper on CMMI (Sun and Liu 2010), they describe a methodology using Quality Function Deployment (QFD) (Akao 1990) and Analytical Hierarchical Process (AHP) (Saaty 1980) to help organizations achieve the integration of business processes with CMM and CMMI. The results of the studies were validated by a domain expert from Toshiba. Hayashi and Kataoka (2008) used QFD to integrate a defined business process, subcontract 50
65 management, with ISO/IEC15504 for an unspecified automaker s system development related company and were able to confirm concrete effectiveness to decrease rework Conclusion Software Process Improvement has been around in various guises from the outset of software development; only in recent times has the area become a discipline in its own right. As the first projects which were undertaken were reasonably small and focused on manageable application domains, improvement was organic in nature and did not require a separate initiative or discipline to manage this improvement. However, as project size and complexity increased, it became more important to manage improvement and increase discipline within projects. Out of this, SPI was born. As SPI was now a clearly identifiable domain, one of the first questions asked was regarding the benefit of implementing SPI. As a separate discipline or process around software development, it was now possible to identify the costs associated with SPI and, as a result, to be able to potentially quantify (where possible) the Return On Investment (ROI) of SPI. As we have seen in this chapter, there is a large body of evidence surrounding the benefits associated with the implementation of SPI. However, there are several challenges associated with the interpretation and use of this evidence. In the first case, there is a lack of uniformity in the definition and interpretation of the metrics/indicators used as evidence of the benefits of SPI. Different researchers and practitioners use the same metric to mean different things. Secondly, for various reasons, not all companies, even when using standard industry definitions for metrics, use the same metrics in their studies. The effect of this is that, while there may be quite a lot of research, it is sometimes difficult to find like-metrics upon which to base comparisons. Thirdly, companies may be reluctant to divulge information for commercial reasons, particularly if the results of their SPI paints them in a worse light than the rest of their peers in the industry. In addition to SPI, both BPI and BPR have been around for quite some time and it has long been recognized that IT has a very close relationship with these fields, beyond the mere use of IT and related systems as a tool to achieve BPI/BPR. It has also been recognized from an SPI perspective that full integration with an organization s business goals and objectives is an essential ingredient for successful implementation of SPI. Several methodologies have been proposed to integrate business objectives and SPI, such as using GQM or QFD as the basis for 51
66 the methodology. The proposed methodologies, however, appear to be closely coupled to various SPI methodologies such as CMM, CMMI, and ISO/IEC Some methodologies appear to be quite promising but, unfortunately, don t appear to have yet been extensively validated. In addition, no general, all-purpose methodology or model which can be readily used by practitioners has been identified during this review. This thesis presents research to further address this gap through the development and validation of the Rosetta Stone Methodology and the Rosetta Stone Implementation for CMMI. 52
67 3 Research Methodology 3.1 Introduction The purpose of this chapter is to provide a solid theoretical foundation for the research methods and techniques used in this thesis as well as providing the reasons behind the particular research methods chosen and used in this work. In order to provide a structure around this, I used a research model described by Jenkins (1985) and which, according to him, is based upon an amalgam of work by authors such as Stone (1978), Kaplan (1964), Clover and Balsley (1984) and Buckley (1976). The paradigm concepts are derived from (Kuhn 1996). While even Jenkins himself admits that the research process sequential arrangement is an over-simplification, it is, as several other researchers point out, essential to have a clear, well-laid out research process (Parnas and Clements 1986; Creswell 2007; Cooper and Schindler 2008). Interspersed with the theoretical discussion on the nature of research and methodologies, the discourse will place particular emphasis on the methods and methodologies which are of particular relevance to this thesis as well as why and how they were employed. 3.2 Jenkins Research Process Model In his article, Jenkins (1985) presents a very high-level, step-by-step overview of the process of conducting research in the field of Management Information Systems (MIS). Two fundamental assertions are made (i) that there is a fundamental research process that is applicable to all research and (ii) that there are a large number of research methodologies applicable to MIS research. He argues against a one best way approach to conducting MIS research. The assertion of no one best way approach to conducting MIS research has been echoed by several other researchers in the field (Antill 1985; Fitzgerald 1997; Avison 1998). Jenkins details eight steps in the process. In summary, the steps are: 1. Idea getting the initial idea for the research process 2. Library Research perform a literature review of the area of the proposed research 3. Research Topic define a clear, unambiguous statement of the research objective 53
68 4. Research Strategy select the appropriate research method(s) to be used in the research process 5. Experimental Design using the appropriate research strategy(ies), design the actual experiment to affirm/reject the research topic 6. Data Capture conduct the research as defined in the experimental design phase 7. Data Analysis review the results of Data Capture 8. Publish Results. 3.3 Idea and Library Research The first step in the model is to come up with an idea worthy of research. This is typically unstructured and may be influenced by any number of factors including having a real-world need to solve a particular problem or, alternatively, having to focus on an area in order to pursue a higher-level degree. I have been working in the IT organizations of Financial Services organizations for the last 20 years. During that period, I have spent my time in the development, project management, and Project Management Offices (PMO) areas of several large Wall Street firms including Salomon Brothers, Goldman Sachs, and Lehman Brothers. During my time there, all these organizations had been aware of various SPI methodologies but, for various reasons, the IT organizations within these firms chose never to implement any of them. The methodologies were looked upon as being not very business-focused and people were not sure of the ROI resulting from their implementation. In addition, they were looked upon as lacking the ability to be implemented in an a-la-carte fashion from which one could drive a business-focused objective to a particular SPI process area. Another reason for the lack of uptake on SPI is a more general one the apparent difficulty in building links between research and professional practice and, in fact, this last reason may be the primary driver for the lack of uptake. Moody (2000) provides a compelling discussion on this topic and, as can be seen in Figure 3-1, I saw the need to connect SPI research and a financial services IT organization. The idea phase of the research, therefore, was that: the researcher was interested in applying SPI to his work in the financial services industry. Thus the initial idea was on how to determine if SPI provides value and, if so, how it could be useful in his day-to-day work where the IT domain is much more business-oriented than IT-oriented. 54
69 Figure 3-1: Disconnect between Research and Practice (Moody, 2000) The next step is to perform what Jenkins terms a Library Research (Jenkins 1985). This is now more commonly called a Literature Review and was presented in Chapter 2. The Literature Review for this thesis focused on the more common SPI methodologies currently in use, the benefits of SPI, and the financial methods used to quantify various benefits as a result of the implementation of SPI, and on the interaction between BPI and SPI. The Literature Review was initiated by performing a keyword search of various online research portals, particularly the IEEE and ACM portals. The keywords used for the search were: Software Process Improvement/SPI Software Process Improvement/SPI Benefits ROI Software Process Improvement/SPI CMM/CMMI Benefits ROI CMM/CMMI. The list of sources in which the review was principally carried out was: IEEE Digital Library ACM Digital Library Wiley InterScience (Computer Science). This search yielded a large amount of results which were then reviewed for usefulness and relevance. Each result contained further references which were 55
70 then obtained and reviewed and which then yielded further references and so on. This practice has been continuous during the research period There was quite an amount of evidence in the literature on the benefits of SPI but, as seen in Chapter 2, the various measurements/metrics were not consistently defined, the articles focused on metrics which were important only to a particular organization, and were IT-focused and not homogenous. 3.4 Research Objective Following the Literature Review, the research objective became clearer: To develop and evaluate a methodology that allows organizations to achieve specific organization-pertinent benefits using existing SPI methodologies and techniques. The drivers for this new method are organization-focused but at the same time the work relies heavily on aspects of both software engineering and information technology. Sommerville (2007) defines software engineering as an engineering discipline that is concerned with all aspects of software production from the early stages of system specification to maintaining the system after it has gone into use while Information Technology (IT), according to the OGC (2007), is defined as the use of technology for the storage, communication, or processing of information. The technology typically includes computers, telecommunications, applications, and other software. The information may include business data, voice, images, video etc. Information Technology is often used to support business processes through IT services. Clearly, software engineering is concerned with software while IT is concerned with all aspects of technology which impact a business. This work uses aspects of software engineering such as SPI in conjunction with IT concepts such as ROI and as such sits between both disciplines. For example, what SPI process areas should be implemented to achieve increased productivity or reduce time to market? Objectives like these are critical to an organization and have not typically been the focus of SPI research. 56
71 3.5 Research Strategy Research Philosophies Research philosophies are the subject of intense debate within the field of IS and are frequently presented as dichotomies though, as we have already discussed, they do not need to be mutually exclusive. Several of the more frequently mentioned (Fitzgerald and Howcroft 1998; Cornford and Smithson 2005) are: idiographic vs. nomothetic vs. constructive positivist vs. interpretivist quantitative vs. qualitative. As Fitzgerald (1997) and Fitzgerald and Howcroft (1998) point out it should be noted that these dichotomies are not all at the same level of abstraction as some of them are more overarching than others and some are almost synonymous. Many of the areas within IT - such as Information Systems (IS), Integrated Systems Development (ISD), and Management Information Systems (MIS) - are applied sciences. According to Moody (2000), there are two primary objectives of an applied discipline to increase knowledge (theoretical) and to improve practice (practical). They focus on practical applications of science rather than being purely theoretical in nature. Like other applied disciplines such as medicine, IS relies on other disciplines such as computer science and organizational behaviour for their theoretical basis. According to Galliers and Land (1987): Traditionally, the topic [of research] has often been viewed as residing, for the most part at least, within the province of technology. Increasingly, however, both IS academics and practitioners have begun to realize it is more appropriate to extend the focus of study to include behavioural and organizational considerations The reason that this is important is that we must realize that there are potentially many different research strategies and approaches that can be used to perform research within IT. As mentioned earlier, this position is supported by several researchers in the field (Antill 1985; Fitzgerald 1997; Avison 1998; Fitzgerald and Howcroft 1998). 57
72 3.5.2 Research Style Idiographic, Nomothetic, or Constructive? Based on an analysis of the fundamental assumptions of seven major schools of thought in IS development, Iivari (1991) has suggested that there are 3 distinct styles of IS research constructive, nomothetic, and Iiiographic. Constructive research deals with models and frameworks which do not describe any existing reality but rather help to create a new one, and which do not have any physical realization ; Nomothetic research is concerned with exploring empirical data in order to test hypothesises of general character about phenomena studied ; and Idiographic research is concerned with exploring particular cases or events providing the richest picture of what transpires. Given the research objective in this thesis of developing and evaluating a methodology that allows organizations to achieve specific organization-pertinent benefits using existing SPI methodologies and techniques, this research uses a constructive research style Positivist vs. Interpretivist Positivism According to MacKenzie (1977), in his 1972 work on Positivist Science, Kolakowski (1972) characterizes positivism in terms of 4 rules: phenomonalism, nominalism, the fact-value distinction, and the unity of scientific method. Phenomonalism deals with the elimination of all abstractions from science; Nominalism states that words, abstractions, and generalizations do not give any new insight into the world and should thus be excluded; fact-value distinction states that facts should be separated from values; and unity of scientific method states that the scientific method is valid for all forms of inquiry. Hirshcheim (1985) alters this slightly by stating that positivism is based on 5 pillars: 1. Unity of the scientific method 2. Search for Humean 3 causal relationships 3. Belief in empiricism 4. Science (and its process) is value-free 5. The foundation of science is based on logic and mathematics. Unity of scientific method has the same meaning as used by Kolakowski. The Ssarch for Humean causal relationships is based on the desire to find causal relationships of items under study. Belief in empiricism is based on the belief that everything has to be measurable and discrete. Science is value-free is based on the 3 Named after David Hume ( ), a prominent philosopher and economist 58
73 desire for science to be impartial facts are facts and do not have politics or emotions associated with them. Of particular relevance to this research work is Orlikowski and Baroudi s (1991) observation that IS research can be classified as positivist if there is evidence of formal propositions, quantifiable measures of variables, hypothesis testing, and the drawing of inferences about a phenomenon from a representative sample of a stated population. Interpretivism At its highest level, intepretivism is the view that all knowledge is a matter of interpretation. From an intepretivist s perspective, not every scientific inquiry can be divorced from a context, viewed within a pure vacuum, or be discretely measured. Fitzgerald (1997) states that intepretivism is concerned with understanding and interpreting human behaviour from the actor s own frame of reference. There is no universal truth or reality to be found. In a more detailed description of interpretivism, Lee (1991) states: The interpretive approach [to organizational research] maintains that the methods of natural science are inadequate to the study of social reality. This school of thought takes the position that people, and the physical and social artefacts that they create, are fundamentally different from the physical reality examined by natural science. Unlike atoms, molecules, and electrons, people create and attach their own meanings to the world around them and to the behaviour they manifest. Of particular relevance to this research is the statement by Klein and Myers (1999) that IS research can be classified as interpretive if it is assumed that our knowledge of reality is gained only through social constructions such as a language, consciousness, shared meanings, documents, tools, and other artefacts. Due to the fact that the work undertaken for this thesis is unique in nature and there is a lack of established quantitative research in the area, much of the interaction is by necessity at a social level primarily using shared meetings. In summary there appears to be no one best way approach to research and, as can be seen from the fundamental characteristics of both approaches, certain areas 59
74 naturally lend themselves to either the positivist or interpretivist research approaches. As the Research Objective involves defining a new methodology to support a business-oriented SPI implementation paradigm, and there was no apparent evidence available in the literature that could be used as a basis for a study, an interpretivist approach was deemed the most appropriate Quantitative vs. Qualitative Quantitative techniques are firmly based around mathematics and statistics while qualitative techniques tend to be much less mathematically-focused. Quantitative techniques have their roots in the positivist school of research. As a result, many of the discussions on positivism vs. interpretivism also fall over into qualitative vs. quantitative debate. However, it must not be assumed that these two techniques are mutually exclusive to each camp as Silverman (1998) recognizes In IS, as in other social sciences, the critique of quantitative [and qualitative research] can lead to an oversimplified opposition between positivism and negativism. This point of view is further supported by Kaplan and Duchon (1988) who advise that qualitative and quantitative approaches can be integrated, providing a richer picture of the area under study. In their work, Glesne and Peshkin (1991) outline the predisposition of qualitative and quantitative modes of enquiry (see Table 3-1). Silverman (2006) neatly summarizes the naturally inherent characteristics of both approaches (see Table 3-2). The researcher must understand when it appropriate to use either method. Quantitative approaches are most useful, for example, when the area under research can be reduced to numerical and statistical values, when there is a strong desire to generalize the results, or when relationships can be mathematically modelled. A qualitative approach, for example, is more appropriate when the results are narrative/linguistic in format, when the context of the study is important, or when an understanding of a phenomena is to be explored. As this subject area has not been extensively explored and the population of subjects who have the expertise to have a knowledgeable discussion on a model such as the one developed is quite small, a qualitative approach was chosen. 60
75 Quantitative Mode Qualitative mode Assumptions Social facts have an objective reality Reality is socially constructed Primacy of method Variables can be identified and relationships measured Etic (outside's point of view) Primacy of subject matter Variables are complex, interwoven, and difficult to measure Emic (insider's point of view) Purpose Generalizability Contextualization Prediction Interpretation Causal explanations Understanding actors' perspectives Approach Begins with hypotheses and theories Ends with hypotheses and grounded theory Manipulation and control Uses formal instruments Experimentation Deductive Component analysis Seeks consensus, the norm Reduces data to numerical indices Abstract language in write-up Emergence and portrayal Researcher as instrument Naturalistic Inductive Searches for patterns Seeks pluralism, complexity Makes minor use of numerical indices Descriptive write-up Researcher Role Detachment and impartiality Personal involvement and partiality Objective portrayal Empathic understanding Table 3-1: Qualitative vs. Quantitative technique comparisons (Glesne & Peskin, 1991): 61
76 Quantitative Hard Fixed Objective Value-free Survey Hypothesis testing Abstract Qualitative Soft Flexible Subjective Political Case Study Speculative Grounded Table 3-2: Quantitative vs. Qualitative comparisons (Silverman, 2006) 3.6 Research Approach Research methods 4 are those techniques which are used by researchers to perform the actual study which is the subject of the research. Vogel & Wetherbe (1984) have identified a taxonomy, which, according to Cornford and Smithson (2005) has been used many times as the basis of writings about information systems research. Jenkins (1985) further added to this list to arrive at the following set of research methods: Mathematical modelling Experiment Simulation Lab Experiment Free Simulation Field Experiment Adaptive Experiment Field Study Group Feedback Analysis Opinion Research Participative Research (also known as Action Research) Case Study Archival Search Philosophical Research. Having already arrived at the Research Paradigms and Approach (constructionist, interpretivist, and qualitative) to be used in the study, the number of possible research approaches from Jenkins list is considerably narrowed down. Choudrie and Dwivedi (2005), have modified an initial classification of the research approaches of Galliers (1992) and Mingers (2003) to classify them as either positivist or interpretivist (see Table 3-3). 4 Also known as research methods or research approaches. For the purpose of this thesis and to be consistent with Jenkins, we shall use the term research approach. 62
77 Research Philosophy Positivist Interpretivist Mingers (2003) Classifications of Research Methods Observation (passive), measurements, and (statistical analysis) Experiments Survey, questionnaire, or instrument Case Study Simulation Interviews Qualitative analysis Ethnography Grounded theory content Participant observation Galliers' (1992) Classification of Research Methods Laboratory Experiment Field Experiment Survey Case Study Theorem Proof Forecasting Simulation Subjective/Argumentative Reviews Action research Descriptive/interpretive Futures research Role/game playing Methods Action Research involving Critical theory interventions Consultancy Table 3-3: Classification of Mingers' (2003) and Galliers' (1992) Research Methods (Choudrie and Dwivedi, 2005) Cornford and Smithson (2005) note that, since information systems include people, there is the variability and psychological opaqueness of the human mind and human intention to contend with. For interpretive researchers, social science, not natural science, is the immediate reference discipline. The following interpretivist approaches were ruled out (the naming convention below is based on (Mingers 2003) ): Qualitative Content Analysis this concerns the analysis of texts and artefacts for the occurrence of specific keywords, categories, or terms. As the proposed model is a new model, no data currently exists to review and therefore this approach cannot be used. Ethnography this is a technique with its origins in anthropology. Essentially a researcher immerses himself/herself in a culture. In terms of IS research, this means that the researcher would become a passive member of a team whose job would be to implement the research in question. Given the potential cost of undertaking a real-world project on which to test the model, it was not possible to find candidates willing to test out the research Grounded Theory uses a range of empirical sources to generate theories and plausibly explain relationships. This research was not concerned with such results and therefore grounded theory was ruled out. 63
78 Participant Observation this is the case where the researcher is an active participant in the process. This was ruled out because the field work would have been impractical for the researcher Role/Game Playing (from Galliers taxonomy) the model being proposed is a generic model which can be adapted to various benefit hierarchies and SPI models. As a result, there is no one-specific set of rules which can be applied for a role/game playing approach. For this particular work, the research consisted of 2 parts: Creating the Rosetta Stone Methodology and the RS-ICMMI instance mapping Validating both the methodology and the RS-ICMMI mapping. The validation process was carried out using expert opinion. Using the interpretivist approach, the RS-ICMMI mapping was built using the CMMI 1.1 standards (SEI 2002a; 2002b) in conjunction with a modified version of Basili s GQM framework (see section 3.7.1) along with feedback from 3 SPI practitioners using a general interview approach. The methodology was then extrapolated from the instance model. 3.7 Experimental Design GQM In order to create the model, a variation of Basili s Goal-Question-Metric (GQM) approach was used (Basili and Weiss 1984; Basili 1992; Basili et al. 1994). The basis of GQM is that, for an organization to measure itself in a meaningful way, it must use a top-down approach where it first defines its goals, then define the questions which characterize the way the achievement of a goal is going to be performed and, finally, define a set of data which is associated with the questions being answered. This takes a 3-levelled approach: 1. Goal: A goal is defined by an organization. 2. Question: A question, or set of questions, are defined and are used to characterize the way the assessment/achievement of a specific goal is going to be performed based on some characterizing model (Basili et al. 1994). 3. Metric: A set of data associated with the questions to be able to answer the question in a quantifiable way. This is shown graphically in Figure
79 Figure 3-2: GQM Approach (Basili, 1992) The model used in this work has been modified slightly from Basili s model in that the Question becomes what Process Area or Areas solve the business objective defined in the Goal level. As a result, the 3 levels now become: 1. Goal: What Business Objective does the Business wish to solve? 2. Question: What Process Areas are directly or indirectly relevant to the Goals? 3. Metric: What metrics can be defined and captured to quantify improvement or regression from the objective? This is represented graphically in Figure 3-3. Figure 3-3: Modified GQM Approach Following this approach, the Rosetta Stone Methodology and the RS-ICMMI mapping instance as described in Chapter 4 was developed. 3.8 Validation of the Rosetta Stone Methodology 65
80 To review the methodology and the mapping instance, two separate validation exercises were carried out. The first validation exercise, a general review of the usefulness and applicability of the proposed methodology, was performed using an interpretivist approach. The method deemed most suitable for the validation phase of the methodology was the Interview approach. In particular, an expert panel approach was used which focused on gathering the views of SPI experts. The second validation phase, the review of the RS-ICMMI mapping instance, was also interpretivist in nature as it revolved around asking expert opinion on the proposed cause-and-effect relationships between Process Areas and Benefits was gathered and analysed Expert Panel An expert panel may be defined as being a group of experts in a particular area who can subjectively assess the impact of a proposed action or idea. It is a widely practiced technique for making predictions (Shepperd and Cartwright 2001) and has been successfully applied in previous IS research work. As Hakim (1987) notes, small samples can be used to develop and test explanations, particularly in the early stages of work. Examples of successful previous studies which have used small samples to gain expert feedback include Dyba (2000), El Emam and Madhavi (1996b) and Beecham (2003). The value of such expert knowledge has also been acknowledged in Rosqvist et al. (2003) where expert judgement was used for the evaluation of software quality. In addition, several studies, including those of Kitchenham et al. (2002), Beecham et al. (2005), and Leuesen and Vinter (2001) have used expert panels to reliably predict information which was subsequently demonstrated in practice. For this study, the researcher invited 25 experts to participate, 19 interviews were set up while 17 experts finally gave their opinion. For further review, the questionnaire that was given to the experts is detailed in Chapter 5 and a highlevel biography of all the participants is provided in Appendix C Data Capture To capture the data, a series on one-on-one interviews were held with the experts. Where possible, those were held in person; otherwise they were held over the phone. All interviews were captured using a digital recorder with the express consent of the interviewees Data Analysis In order to formally analyse the comments from the various interviews, a content analysis technique was used. The particular content analysis technique used in 66
81 this work is described in Miles and Huberman (1994), Patton (2001), and Slowey and Richardson (2006) and consists of reviewing all interviews, identifying categories, and coding them. After the text from all the interviews is coded, all the coded texts are reviewed together, giving a holistic view of all similar comments across the entire set of interviews. This results in the identification of a set of codes (see Table 3-4). To summarize, the validation phase of the Rosetta Stone Methodology was performed using an expert panel interview approach where all the responses were captured and analysed using content analysis. Area Code Description Benefits BEN_ALL Beneficial to all companies? Benefits BEN_LAR Beneficial to large companies? Benefits BEN_MED Beneficial to medium companies? Benefits BEN_SMA Beneficial to small companies? Benefits BEN_SME Beneficial to SMEs? General GEN_FIN_COM Final Comments Interviewee INT_EXP_O Interviewee's other experience Interviewee INT_EXP_S Interviewee's SPI experience Research Methodology RM_MAP Any other ways to arrive at the mapping or any comments on approach Rosetta Stone RS_COM Comments about the generic model Rosetta Stone RS_OTHERS Is the interviewee aware of any other methodologies like Rosetta Stone? Rosetta Stone RS_VALID Do you consider this to be a valid generic approach? Rosetta Instance Rosetta Instance Rosetta Instance Stone Stone Stone RSI_COM RSI_GEN_BEN RSI_REVIEW Comments Benefits of this approach Comments about what is good (or bad) about the model Rosetta Stone RSI_HIER Comments about the hierarchy of the IBM model Instance Rosetta Stone RSI_IBM Comments about the IBM benefits model Instance Rosetta Stone RSI_MAP Comments about the mapping Instance Rosetta Stone RSI_PRIOR Comments about the prioritization process Instance Rosetta Stone RSI_FW Recommendations for future work on Rosetta Stone Instance Rosetta Stone RSI_USE Would you use the model Instance SPI SPI_BEN Any non-standard benefits of SPI SPI SPI_BEN_BUS Are there any other business-driven approaches out there? SPI SPI_COM Comments SPI SPI_DRIVERS Why would an organization undertake SPI Table 3-4: Content Analysis Codes for Rosetta Stone Interviews 67
82 3.9 RS-ICMMI Benefits Mapping Validation Process Once the Rosetta Stone Methodology was created and the validation process completed, a mapping between a benefits model and an SPI methodology was completed to create a mapping instance. That mapping consists of primary, a secondary, or no relationship between a particular Process Area and a particular IGSI-ISM Benefit. Each of these individual mappings, or the lack of a mapping, must be reviewed by experts to validate the mapping. At a high level, the basic premise of the validation interviews therefore is that, for each Process Area/IGSI- ISM Benefit combination, an interviewee is asked if they agree that the IGSI-ISM benefit resulted from the implementation of the Process Area (PA) in question. In addition to a binary answer (yes/no), interviewees were further asked for any specific evidence or opinion they had on a particular mapping. In all, 294 separate questions on benefit/process area impact were asked of 10 interviewees. Figure 3-4: Question Flow for validation of PA to IGSI-ISM Benefit map 68
83 3.9.1 Primary Vs. Secondary The Rosetta Stone Methodology recognizes the importance of primary versus secondary benefits (see section 4.4.3) and uses this categorization to drive recommendations on the priority of implementation of Process Areas (see section 4.4.4). Primary versus secondary therefore is an important element in the benefit mapping and was specifically asked as part of the validation process. In addition, there is also the possibility that a particular Process Area/Benefit combination may not have any cause and effect relationship. Therefore the cause and effect relationships may have 3 separate possibilities a primary relationship, a secondary relationship, or no relationship Degrees of Evidence As part of the validation process, interviewees were asked to provide evidence or reasons such as experience in practice to support a cause and effect relationship between a Process Area and a Benefit. As a result, the questions were organized in order of the importance of the evidence provided by interviewees. This question flow is illustrated in Figure 3-4. To begin with, the interviewee is asked to confirm if there is a relationship at all (Step 1). If there is a relationship, it must then be categorized as being either a primary or a secondary relationship (Step 2). The interviewee is then asked (Step 3) if he has any specific evidence to support his opinion that there is a relationship between a Process Area and a Benefit. If so, it is documented. In the absence of a specific example that the interviewee can describe, the interviewee is asked if he has seen a relationship in his general experience (Step 4). If so, it is documented. If not (Step 5), then the interviewee is asked if he believes that logically there should be a relationship between a Process Area and a Benefit Interview Sampling Method Based on the initial mapping (see Appendix E), a total of 97 separate requests for supporting evidence would be required for evidence to determine if the mapping is correctly identified for primary expected benefits. If we require at least two interviewees to answer each mapping question, 2 * 97 questions would be required a total of 196 separate interview questions. To ask the same question for Secondary Benefits would require 269 such questions, or 538 questions if we wish to have the same question answered at least twice. To verify the benefits which are neither primary nor secondary benefits would require 159 questions, or 318 questions if the same question if required twice. The total number of questions which need to asked of interviews is therefore questions = 1,050 questions. As this is a very large number of questions, for practical purposes a method was devised to reduce the scope. 69
84 I therefore focused on the level 2 mapping for initial validation of benefits and interviewed 10 experts (see summary of experience in Appendix D). Based on the RS-ICMMI mapping, there are 31 benefits ascribed to the Level 2 Process Areas and there are 116 non-primary benefits. In order to ensure all Process Area/Benefit mappings are covered twice, a total of 62 primary mapping questions must be answered and a total of 232 non-primary questions must be answered. With 10 interviewees, 6 interviewees must answer 6 primary benefit questions and 2 interviewees must answer 7 primary benefit questions. To answer the non-primary questions, 8 interviewees must answer 23 non-primary questions and 2 interviewees must answer 24 questions. Table 3-5 summarizes the exact number of questions per interviewee and the percentage of questions asked. Questions were assigned to interviewees in random order and in such a way that no one interviewee was asked to answer the same relationship twice. Interviewee Number of Primary Questions Number of Secondary Questions % of Question s 9.48 Interviewee Interviewee Interviewee Interviewee Interviewee Interviewee Interviewee Interviewee Interviewee Interviewee Total Table 3-5: Summary of Questions per Interviewee Randomness is achieved by assigning actual interviewees to the placeholders that were previously defined as Interviewees 1 10 using a random number table. 70
85 3.9.4 Compliance to Expectations To determine how the initial mapping compares to the experts opinions, I created a metric called Compliance to Expectations. This metric compares the results of the interviews to the expectations of the instance model and can have the following values: % compliance both interviewees for each Process Area/Benefit combination agree with the model 2. 50% compliance only one of the interviewees for each Process Area/Benefit combination agrees with the model 3. 0% - none of the interviewees agrees with the model. This metric was used when updating the RS-ICMMI model to reflect interviewees comments. For mappings which were either 100% compliant or 50% with expectations, no change was made to the RS-ICMMI mapping. For those mappings which were 0% compliant with expectations, the mapping was altered to reflect the opinions of the interviewees Summary In this chapter, I have provided a theoretical background on research methodologies, those which are particularly relevant to IS, and those which are used in particular in this work. Using Jenkins research model, I have shown how research has progressed from the initial idea stage through to the decision to use the expert panel method to elicit feedback on the model proposed. In following chapters I shall detail the actual questionnaire used, how the results of the study were collated, what those results were and provide a summary biography of each of the experts whose opinion was gleaned in this course of this work. In summary, the research approach and techniques used are constructionist, interpretivist, and qualitative. For the validation phase of the Rosetta Stone Methodology, the expert panel technique is used and for the validation phase of the specific RS-ICMMI instance mappings, expert interviews were carried out to establish evidence of benefits. 71
86 4 The Rosetta Stone Objective-Driven SPI Methodology translating between Organizational Objectives and SPI 4.1 Introduction Until recently, IT organizations have tended to drive the SPI agenda in order to achieve IT benefits as a primary objective, and organizational benefits as a secondary objective. However, this is typically not the way the commercial world works in the commercial world it is the business which drives IT, not the other way around. To achieve a business-oriented focus, the Rosetta Stone objectivedriven SPI Methodology (RSM) has been developed and will be presented in this chapter. To aid in more easily understanding the methodology, this chapter is logically presented in 3 parts: 1. Description of the meta-model model. The meta-model provides an abstract representation of the relationships between business objectives, process areas, and the indicators/metrics which may be used to demonstrate progress or regression of the implementation of SPI within an organization (section 4.2). 2. Description of the methodology used to arrive at a concrete implementation of the meta-model (section 4.3). 3. Example of the operationalization of the methodology to create an instance of a mapping. The implementation presented here is a mapping from the IGSI-ISM benefits model, a generic benefits model developed by IBM India (Goyal et al. 2001), to the CMMI (Staged) SPI model and will hereafter be referred to as the Rosetta Stone IGSI-ISM to CMMI implementation, or RS-ICMMI for short (section 4.4). 4.2 The Rosetta Stone Meta-Model Background Many valuable studies of the benefits resulting from implementation of CMM/CMMI and Software Process Improvement (SPI) in general have been undertaken over the last several years. These studies discuss SPI using at least one of 3 separate axes: 72
87 Organizational Focus were the studies carried out solely within one organization or were they carried out as general studies across an industry or several industries? Examples of cross-organizational studies include (Herbsleb et al. 1994b; Brodman and Johnson 1995; Herbsleb and Goldenson 1995; Brodman and Johnson 1996b; Herbsleb and Goldenson 1996; Clark 1997; 1999; Ferguson et al. 1999; Clark 2000) while organization-specific examples include (Humphrey et al. 1991; Dion 1992; 1993; Basili and Green 1994; McGarry et al. 1994; Wohlwend and Rosenbaum 1994; Buchman 1996; Diaz and Sligo 1997; Butler and Lipke 2000; Harter and Slaughter 2003) Improvement Methodology was the SPI program undertaken using CMM/CMMI, ISO/IEC or some localized Software Process Improvement program? Several different methodologies and programs have been or are currently the subject of several studies. General methodologies include CMM/CMMI (SEI 2002b; 2002a), ISO 9000/9001 (International Standards Organization 1994; 2000), and ISO/IEC TR (ISO 2003; 2004a; 2004b; 2004c; 2006), while examples for specific process improvement activities include the use of Software Inspections (Fagan 1986; O'Neill 2003), Software Re-use (Lim 1994) and the impact of tools (Bruckhaus et al. 1996) Metric Focus was the study undertaken to focus on explicit metrics that the concerned parties were specifically interested in improving/monitoring or were the metrics in question used to highlight the results of SPI? For example, Grady (Grady and Caswell 1987; Grady 1992; 1997) focuses on setting up company-wide metrics programs, while Capers Jones focuses on particular metrics that measure programmer productivity (Jones 1986; 1991). This is illustrated graphically in Figure 4-1. Figure 4-1: Axes of SPI studies 73
88 Many of the papers on ROI/SPI benefits focus on at least two of the 3 axes mentioned in the previous paragraph. The Rosetta Stone Meta-model is a consolidated model which allows practitioners to view organizational focus, metrics, and SPI programs concurrently using one, unified framework a Rosetta Stone of SPI, if you will, that allows translation between SPIs, Benefits, and Metrics Rosetta Stone Meta-Model Overview Figure 4-2: Rosetta Stone Meta-Model The Rosetta Stone meta-model is composed of 5 basic elements, as well as the relationships between them, and is graphically illustrated in Figure Elements The most important element is the set of Business Objectives or Benefits which an organization wishes to achieve. If possible, these should be hierarchical so that the achievement of one should lead to the achievement of others. For example, if the on-time delivery of projects is achieved (one possible business objective) then this should result in better customer satisfaction (another possible business objective). Each benefit should have some form of Return associated with it some way of determining, frequently quantifiable but sometimes qualitative, the value of the benefit to an organization. Returns are meaningful to the Business and, as such, are typically not IT-type metrics such as defects/ksloc or defects/function point unless, of course, the Business is primarily an IT-focused 74
89 business. For example, if productivity were the objective, it might be possible to say that, for an x% increase in productivity, there should be an increase in profits of y%. For each Objective, there is at least one Indicator - a set of metric(s) that are an indication that a particular benefit has occurred. In other words, a set of indicators that can prove (or disprove) that progress is being made towards a specific benefit a way to measure a benefit. Process Areas (PAs), using the standard SEI nomenclature, are the actual SPI processes being implemented by IT. Each PA has a Cost associated with it the sum of all financial costs that are incurred in order to implement a PA. In order to implement the methodology, the practitioner must first choose which Objectives are most relevant to the Business and then choose which SPI model is most appropriate for their organization. These two entities then drive the choice of Costs, Returns, and Indicators. This will be discussed in detail in section Relationships Perhaps the most complicated part of this model is in defining the relationships between the Objectives/Benefits model and the PAs. At this point, it is sufficient to say that, for the generic model, it is understood that there are relationships and these relationships identify how to drive from Business Objectives to PAs. To illustrate the relationships through an example, if we were to consider a Process Area such as Requirements Management, many professionals would intuitively suggest if requirements are managed in accordance with the CMMI definition of that Process Area, there should be less cycles wasted due to an incorrect understanding of current requirements (a Benefit) and that, as a result, during testing there should be less rejected defects raised (an Indicator) as requirements will be in accordance with code. The Cost of this may be more money spent on requirements management tools while the Return would be a project delivered on time. How this is done in a non-abstract way is dealt with in detail in section Return, Costs and ROI In the majority of organizations, where profit is a primary goal, benefits should ultimately lead to a monetary impact on the organization. In other words, there should be some form of Return On Investment (ROI). One of the main advantages of this methodology is that it is now possible to tie SPI to specific benefits due to the fact that the benefits may be defined at a very granular level. It must be recognized, however, that in some cases it is difficult to measure the monetary value of a benefit for example, how can a dollar value be put on increased team morale? We recognize, however, that there are other types of organization who do not have profit as their primary objective and, as a result, may not have the same 75
90 emphasis on the monetary impact of benefits. If we take universities as an example, while expenses are certainly high on their agenda, their organizational mission tends to be based on the education of their students and the advancement of learning. More appropriate measures in a university environment may be the number of students being taught or the ranking of the university in relation to other universities. There are several ROI calculation methodologies widely used throughout industry today. Whichever one is chosen will depend upon individual project and organizational circumstances such as how rigorous the calculation has to be, how familiar project managers are with financial models, and the availability of appropriate discount rates. As Phillips (1997) notes, the term ROI is often misused. Frequently it is a generic term for specific calculations. Given this, how is it possible to evaluate the monetary benefits that come about as a result of an organization s investment in SPI? There are several popular methods for evaluating projects (Brigham and Gapenski 1994; Higgins 1998; Ross et al. 1999): 1. Net Present Value (NPV) 2. Internal Rate of Return (IRR) 3. Return on Investment (ROI) 4. Profitability Index (PI). All of the above ROI methods compare the monetary returns resulting from the implementation of SPI to the associated cost of funding it. In the case of the Rosetta Stone Methodology, the return on the Software Process Improvement is compared to the implementation cost of the Process Areas in question. Great care must be taken, therefore, to not only capture the monetary equivalents that accrue from the benefits of SPI but also the cost of implementing them. Figure 4-3: Traditional vs. Rosetta Stone SPI Approach 76
91 The main benefits of using this model are that users are able to: Achieve specific business objectives by targeting particular Process Areas to implement in order to achieve those objectives See what benefits may be derived from implementation of which particular Process Areas Given a set of existing metrics and values, determine what Process Areas may be more readily and quickly implemented than others. 4.3 The Rosetta Stone Methodology Having described the meta-model, we now turn our attention to the Rosetta Stone Methodology the translation process whereby an abstract meta-model is transformed into a concrete implementation which may be readily used by practitioners. At a high level, each abstract entity as described in Figure 4-2 must be replaced with a concrete entity. Figure 4-4 illustrates both the individual steps of the methodology as well as the levels at which various actions are taken. One important factor in the whole mapping process is the ability of the practitioner to influence the mapping from abstract to concrete. Depending on the individual organization and the practitioner s position within the organizational hierarchy, we must recognize that a practitioner will sometimes have more or less influence to decide on the mapping. In many organizations, particularly large organizations, a practitioner s ability to influence will increase as he or she progresses farther down the steps as defined in Figure 4-4. This is because frequently the choice of both the SPI methodology (step 1) and benefits model (step 2) is performed at a strategic level within an organization; the mapping between benefits and process areas (step 3), the determination of the implementation order (step 4) and the determination of which metrics to use (step 5) are performed by SPI practitioners; and the monitoring of costs and benefits (step 6) is performed by the front-line staff involved in the running of projects and support organizations. 77
92 Figure 4-4: Rosetta Stone Methodology Step 1 Choose the SPI Methodology As we have seen in Chapter 2, there are several SPI models and methodologies currently in use within ICT and several factors influence an organization s decision on which SPI methodology to use. The first category of factors revolve around the reason an organization chooses to implement Software Process Improvement in the first place. While many organizations choose to implement SPI purely to improve their software process, others may have one or other of the following reasons for implementation: 78
93 Required. In many situations, organizations may be forced to implement a particular SPI methodology just in order to compete in their chosen market. For example, in order to compete for many US Department of Defense contracts, suppliers may be required to have a certain CMM or CMMI maturity level. The same also hold true for other areas such as pharmaceuticals or medical devices. Business Enabler. Unlike in the previous situation where attainment of a certain level of maturity is a minimum requirement to gain entry to a market, attainment of a certain level of maturity can put an organization at an advantage in relation to its competitors. In recent years, for example, with the advent of the off-shoring development model, many Indian consulting firms such as Wipro Technologies and Tata Consulting Services, spent their energies on attaining certifications in order to gain a market advantage over their competitors and now use this as a market differentiator. In addition, based on the RS-ICMMI validation interviews, there have been at least 2 cases in Ireland where local IT organizations gained certifications as a means to justify their desire to take on more responsibilities within their parent organizations. Having determined that implementation of SPI is necessary, the focus then moves on to which SPI methodology to use. For this decision, the target industry is a major factor in deciding which SPI to implement. Certain SPI methodologies are geared towards certain industries. For example MediSPICE (McCaffery and Dorling 2009) is geared toward the medical industry while Trillium (Coallier 1994; 1995) is geared towards the communications industry Step 2 Choose the Benefits Model Different organizations have different organizational goals and missions. Many of the organizations we are most familiar with are for-profit organizations such as IBM, Microsoft, and Oracle. The aim of these organizations is to increase shareholder wealth and they typically do this by increasing profit which is done by maximizing revenue and minimizing costs. On the other hand, many organizations are not-for-profit organizations whose aim is to further their nonprofit goals and objectives. Again, we are familiar with many of these organizations universities, government bodies, and charities are examples of the not-for-profit organizations that we are exposed to on a daily basis. What both the for-profit and not-for-profit organizations have in common, however, is that both types of organization try to use their use their resources most efficiently to achieve their organizational objectives. To support these objectives, IBM Global Services in India have developed a general purpose unified business objectives model. The ultimate objective of this benefits model is to increase revenues and, as such, is therefore more suited as a benefits model for for-profit organizations rather than not-for-profit organizations. 79
94 However, with a small number of changes, this model could be altered to accommodate various different final/ultimate objectives such as Safety or Quality (for organizations such as NASA) or Efficiency for charitable organizations such as the Red Cross or Doctors Without Frontiers Steps 3 - Mapping between the SPI Methodology and the Benefits model One of the core questions within this research work is how do we determine the benefits associated with the implementation of a Process Area? This is done by creating a mapping between Goals (Business Objectives) and Questions (Process Areas) using the modified GQM model described earlier but doing so using a reverse mapping between Process Areas (Questions) and Business Objectives (Goals). This process is graphically illustrated in Figure 4-5 and Figure 4-6 using the modified GQM model described in section 3.7 as a template. Figure 4-5: Modified GQM Reverse Lookup Figure 4-6: PA to Business Objective Map using a reverse GQM map 80
95 4.3.4 Step 4 Determine Implementation Order One of the primary objectives of the Rosetta Stone Methodology is to allow organizations to achieve specific, targeted business objectives or benefits by implementing specific Process Areas. This step in the process is the step which allows us to determine which Process Areas should be implemented, and in what order, to achieve those specific business benefits. In addition to the 2 previous steps, a prerequisite for this step is an understanding of what business objectives an organization wishes to achieve. This understanding may come from many sources for example, a Six Sigma review of existing business processes, feedback from clients, or even input from internal sources such as the IT or Finance departments. Given that an organization knows what business objectives it wishes to achieve, it must then use the map which was built up in Step 3 to determine which Process Areas contribute to the desired business objective. An implementation order is then built up to determine in which order Process Areas should be implemented. From the Rosetta Stone Methodology perspective, we differentiate between primary and secondary benefits in other words, the impact a Process Area has on a benefit. All things being equal, therefore, Process Areas which contribute to a business objective in a primary capacity should be implemented first as they have a greater impact on a business objective than a secondary capacity. Finally, depending on the SPI methodology chosen, there may be some inherent ordering within the methodology which must be taken into account. For example, the CMMI (Staged) methodology has the concept of maturity levels where each level is dependent upon previous levels. As a result, Process Areas at lower levels should be implemented before Process Areas at higher levels Step 5 Identification of Metrics/Indicators for Benefits As a result of implementing step 4, upon entering this step an organization knows which business objectives it wishes to achieve. Each potential benefit must be capable of being monitored in order to determine if the benefit is being received by the organization or not. GQM (Basili and Weiss 1984; Basili and Rombach 1988; Basili 1992; Basili et al. 1994) is a well-established methodology for defining measurable goals and has been used to establish successful measurement programs in industry. According to Basili, the GQM process is composed of 5 distinct steps: 1. Develop a set of Goals for productivity and quality 2. Generate Questions that define the Goals in a quantifiable way 3. Specify the metrics required to answer the Questions 4. Develop mechanisms for data collection 5. Collect, validate, and analyse the data. The first 3 steps are graphically illustrated in Figure 4-7. Specifically with regard to the Rosetta Stone Methodology, each Goal is the analysis of a particular Benefit from the Benefits model. The Question is what are the objective 81
96 measures which can be used to determine if a benefit is being achieved, with Metrics defining what is to be measured. Figure 4-7: Traditional GQM Approach (Basili, 1992) Step 6 - Tracking of Costs and Returns The final step involves tracking both the Costs and the Returns and is operational in nature as this step will typically be performed by the front-line staff involved in developing software such as the Project Management Office, the development staff, and the Quality Assurance staff. Note that, as this step has not been implemented as part of this work, this step will not be discussed in the section on operationalization. 4.4 Operationalization of the Rosetta Stone Methodology The Rosetta Stone IGSI-ISM to CMMI Instance mapping (RS-ICMMI) brings together a well-defined and extensible hierarchical set of benefits that is applicable to most commercial organizations, a mapping of the benefits of CMMI Process Areas to these benefits, and an industry-standard set of metrics that are indicators of the benefits defined in the model. In addition, users of the instance are free to add any pre-existing, custom, or about-to-be-measured metrics that they may have, thus allowing them to re-use any existing work that they may already have undertaken or are about to undertake. Having discussed the methodology at a high level, this section now deals with how to operationalize the methodology. The first two tasks are to decide on which SPI methodology to use and which benefits model to use. 82
97 4.4.1 Step 1 - Choose SPI Methodology CMMI (Staged) As discussed in Chapter 2, there are several widely used SPI methodologies currently in use in the field of ICT. The choice of which one to use is up to the individual organizations. However, in order to demonstrate how to operationalize RSM, I have chosen the SEI s CMMI (Staged) methodology as the demonstration SPI. It was chosen primarily as it is one of the most popular SPI methodologies in use today and is therefore widely understood and used by many practitioners. However, as discussed earlier, there are several other SPI methodologies currently in use, some of which may be more suited to a particular industry or geographic region. For example, Automotive SPICE is a software process assessment standard based on ISO/IEC for use within the automobile industry and CMMI, while used around the world, is particularly used by organizations who develop software for the American Department of Defense. Figure 4-8: Implementation Instance of RS-ICMMI Step 2 Choose Benefits Model IGSI-ISM Benefits Model As professionals, we are concerned with trying to determine the costs and benefits across many projects within many organizations, industries, and countries and want to be able to categorize individual benefits as a way to model, aggregate, and develop a shared view of them across the various SPI processes that we are studying. To that end, I will use a model developed by Goyal et al. (2001), referred to as the IGSI-ISM model (IGSI-ISM model). The model is a generic forprofit benefits model, with the ultimate goal being an increase in revenues/profits, and which will appeal to a broad spectrum of for-profit organizations. As part of research undertaken on the benefits of SPI for IBM Global Services, India (IGSI), two workshops were held using consensus-based responses as inputs for an Interpretive Structural Modelling (ISM) methodology that was then used to 83
98 develop a model of the needs and consequences of SPI. The IGSI-ISM model (see Figure 4-9) shows the relationships between the various benefits that can be derived from SPI. Using this model, there are 21 separate identifiable benefit areas. The IGSI-ISM model has several benefits. Firstly, it is a for-profit model, and therefore appeals to a large amount of organizations whose primary purpose is to generate profits for their owners/shareholders. It is also a hierarchical model which allows benefits to be derived from other benefits. From a practitioner s perspective, it is important to realize that, in achieving specific benefits, you may also achieve other, secondary benefits and it may be useful to bear those relationships in mind when deciding which benefits to pursue. The particular benefits/objectives identified in the model are also high-level enough to identify achievable objectives while at the same time low-level enough to satisfy most organizations. However, no one model will satisfy everyone s needs and, even while this model is a good, overall benefits/objectives model, there are still those organizations who are not-for-profit organizations or who wish to focus on objectives which are not included in this model. Figure 4-9: IGSI-ISM ROI Model (Goyal et al., 2001) 84
99 Unfortunately, I was unable to establish the definitions of all the benefits from relevant publications. Therefore, for consistency and uniformity in this work, I have interpreted the meanings in a specific way. These meanings are defined in Table 4-1. It should be noted that the model is a hierarchy of benefits higher level benefits are derived from elements that are lower in the benefit tree. For example, if the quality of code can be improved ( Better Product Quality, 4-1), this leads to increased productivity ( Increased Productivity, 3-2). Similarly, increasing the understanding of customer needs ( Understanding Customer Needs, 4-4) leads to being able to more accurately setting customer expectations ( Setting right customer expectations, 3-3) and thus increased predictability ( Predictability, 3-4) and to more competitive proposals ( Competitive Proposals, 3-5). To bring the traceability to its ultimate conclusion, it should be apparent that 3-2, 3-3, and 3-4 lead to better image ( Image, 2-1) and greater customer satisfaction ( Increased Customer Satisfaction, 2-2) which both in turn lead to more profits and revenue ( Increased Profits/Revenue, 1-1). Risk Management ( Better Risk Management, 4-2) is another example which highlights the usefulness of a hierarchical model. If strategies are undertaken which provide better ways to manage risk, factors which increase instability are reduced and thus there is a corresponding increase in predictability in projects ( Predictability, 3-4). In addition, by taking away or reducing risk we decrease the amount of effort spent doing unnecessary tasks and thus increase productivity ( Increased Productivity, 3-2). To follow this farther up the tree, we see that both Increased Productivity and Predictability lead to a better image ( Image, 2-1) and greater customer satisfaction ( Higher Customer Satisfaction, 2-2) which in turn leads to our ultimate objective increased profits ( Increased Revenue/Profits, 1-1). For the purposes of this thesis, benefits that come about as a consequence of other benefits are called derived benefits and are discussed in detail in section The relationships between the various benefits which are graphically modelled in Figure 4-9 are listed below in Table 4-1. In the model, relationships from a benefit that resides on a lower in the diagram to one that is higher up are leads to relationships. For example, Higher Customer Satisfaction (level 2, label 2-2) leads to Increased Revenues/Profits. 85
100 Identifier Benefit Description 1-1 Increased Revenues/Profits The increase of revenue and/or profits to the benefit of the organization 2-1 (Increased) Image The creation of a better image of the organization both externally and internally within the organization 2-2 Higher Customer Satisfaction An increase in customer satisfaction of an organization s product or service 3-1 (Better) Market Reach An increase the market reach of the organization 3-2 Increased Productivity An increase product productivity 3-3 Setting right Customer Expectations Ensuring that customer expectations are in line with product delivery 3-4 (Increased) Predictability Products are consistently delivered within expected thresholds 3-5 (More) Competitive Proposals Product proposals are competitive. Note that competitiveness is not necessarily solely about financials. Competitiveness can also involve ensuring that proposals meet regulatory or other customer-/client-specific requirements. 4-1 Better Quality Product Products are delivered to good quality standards. 4-2 Better Management Risk Risk is managed and monitored in a proactive manner. 4-3 (More) Efficient Resource Management 4-4 (Better) Understanding Customer Needs 5-1 Retain & Develop Skills & Domain Knowledge Organization resources are managed in an efficient manner. Resources include, but are not limited to, financial, human, process, and technical resources and assets. Customer/client needs are understood and acted upon Retain and develop skills and process as well as domain knowledge. 5-2 Lower Time to Market Reduce product time to market. 6-1 (Increase) Skill Development Facilitation by Management 6-2 (More) Efficient Information Management Organization actively ensures employees skills are in sync with the technical and domain areas which are the subject of the products being developed/serviced by the organization. Information is efficiently managed throughout the organization, including product teams allowing the organization to dynamically and quickly change based on the information provided. 6-3 (Increased) Teaming / Organization structures are organized to work to 86
101 Identifier Benefit Description Synergize 6-4 (Introduction) New Technology 7-1 Improved Institutionalization of tools / process / methods maximize efficiencies within teams. New technology is used in an appropriate manner to aid the organizations objectives. Tools/process/methods are institutionalized to provide organizational benefit. 7-2 (Better) Business Focus Allows the organization to focus on its business, not on the tools, technologies, and techniques used to develop its products. 7-3 (Increased) Market Intelligence Allows the organization to acquire market intelligence on the markets in which it operates. Table 4-1: IGSI-ISM Benefits Step 3 Map between SPI Methodology and Benefits Model This next step is at the core of the methodology. It requires someone to define all the mappings between the chosen SPI methodology and the chosen benefits model and all subsequent steps depend on the accuracy of the mapping. To arrive at the mapping, I iteratively reviewed each PA and its associated GGs, SGs, and SPs, with (SEI 2002b) as the reference document, to determine which ones have particular relevance to the IGSI-ISM benefit model (see Figure 4-9) using the modified GQM model discussed in section 3.7. In effect, the reverse lookup asks What objectives does this question answer? In terms of the RS-ICMMI model, the reverse lookup asks What objectives does this PA answer? Not all benefits are equal and the model differentiates between primary and secondary benefits. A primary benefit of a Process Area is one that is brought about as a direct result of implementation of a process area where the cause and effect relationship between the Process Area implementation and the benefit is very strong. Secondary benefits are those benefits which are not primary benefits or are derived benefits. A Derived benefit is a benefit which is a hierarchical ancestor of either a primary or secondary benefit. As a demonstration of how the mapping was created the following sections show, for each CMMI Level 2 Process Area, which GGs, SGs, and SPs are relevant for which expected benefits and why. The results of this mapping are detailed in Table 4-2 and a full mapping is detailed in Appendix A. To put this in the context of the modified GQM approach, each sub-section below is an iteration through all the PAs in CMMI Level 2 (with each PA being the Question ) and the Expected Benefits within each sub-section being the Goal/Business Objectives that the Question answers. 87
102 Process Area Abbr. Expected Primary Benefits Configuration Management CM Better Quality Product Configuration Management CM Better Risk Management Configuration Management CM Teaming/Synergize Measurement and Analysis MA Better Quality Product Measurement and Analysis MA Better Risk Management Measurement and Analysis MA Lower Time to Market Measurement and Analysis MA Predictability Project Monitoring and Control PMC Better Quality Product Project Monitoring and Control PMC Better Risk Management Project Monitoring and Control PMC Efficient Resource Management Project Monitoring and Control PMC Setting Right Customer Expectations Project Monitoring and Control PMC Predictability Project Planning PP Better Quality Product Project Planning PP Better Risk Management Project Planning PP Efficient Resource Management Project Planning PP Understanding Customer Needs Project Planning PP Setting Right Customer Expectations Project Planning PP Predictability Project Planning PP Competitive Proposals Process and Product Quality Assurance PPQA Better Quality Product Process and Product Quality Assurance PPQA Better Risk Management Process and Product Quality Assurance PPQA Lower Time to Market Process and Product Quality Assurance PPQA Improved Institutionalization of Tools/Process/Methods Process and Product Quality Assurance PPQA Predictability Requirements Management REQM Better Risk Management Requirements Management REQM Understanding Customer Needs Requirements Management REQM Lower Time to Market Supplier Agreement Management SAM Better Quality Product Supplier Agreement Management SAM Better Risk Management 88
103 Process Area Abbr. Expected Primary Benefits Supplier Agreement Management SAM Predictability Supplier Agreement Management SAM Lower Time to Market Table 4-2: : CMMI (Staged) Level 2 to IGSI-ISM Map Primary Benefits Requirements Management (REQM) The purpose of Requirements Management (REQM) is to manage the requirements of the project s products and product components and to identify inconsistencies between those requirements and the project s plans and work products (SEI 2002b; Chrissis et al. 2003). The REQM Process Area (PA) contains 1 Specific Goal (SG) which in turn consists of 5 Specific Practices (SP). The goal of SG1 is that requirements are managed and inconsistencies with project plans and work products are indentified. Specifically, the project maintains a current approved set of requirements over the life of the project by doing the following (SEI 2002b): Managing all changes to the requirements Maintaining the relationships among the requirements, the project plans, and the work products Identifying the inconsistencies among the requirements, the project plans and the work products Taking corrective action In particular, REQM requires the implementation of the obtaining of an understanding of requirements (SP 1.1-1), the obtaining of a commitment to requirements (SP 1.2-2), the management of requirements (SP 1.3-1), and the identification of inconsistencies between project work and requirements. These directly lead to expected benefits. Expected primary benefits for REQM are shown in Table 4-3 and expected secondary, non-derived benefits are shown in Table 4-4. Obtaining the derived benefits is a well-defined process performed by walking the IGSI-ISM benefits tree. This section discusses REQM while the remaining Level 2 areas will be discussed next. As it is a well-defined process and does not require any specific insight, the remaining discussion on each Level 2 Process Area will concentrate on the reasons behind the primary and non-derived secondary mappings and will only note the derived benefits as part of the summary section. The format for each remaining Process Area will be as follows: 1. The expected primary benefits resulting from the implementation of a Process Area and the reasons why they are the expected primary benefits 89
104 2. The expected secondary, non-derived benefits resulting from the implementation of a Process Area and the reasons why they are the expected secondary, non-derived benefits 3. A summary table consisting of the expected primary and secondary benefits resulting from the implementation of a Process Area. Benefit Reason Better Risk Management (4-2) By managing requirements and identifying inconsistencies, we are better able to identify alternative strategies and avoid building software that isn t part of a customer s requirements. In addition, inconsistencies are identified up front. Understanding Customer Needs (4-4) Proper management of requirements forces us to consistently review those requirements and thus focus on understanding customer needs. By identifying inconsistencies between requirements, plans, and work products we are constantly ensuring that the customer s needs are always foremost. Lower Time to Market (5-2) By identifying inconsistencies up front, we will spend less time working on items that are not required by customers or that are inconsistent with customers needs and expectations. As a result, less time will be spent on rework, thus saving resources and reducing time to market. Table 4-3: Expected primary benefits of REQM Expected Secondary Benefit Market Intelligence (7-3) Reason Constant requirements review and management will ensure organizations are familiar with the requirements needed for systems in the chosen domain area. This in turn may lead to increased market intelligence in that domain. By constantly ensuring that requirements are in line with various project work products, organizations are constantly reviewing the applicability of their resources to the work products and resources required. This will then help them in developing and retaining domain knowledge. By constantly ensuring that requirements are in line with project plans and work products, organizations are forced to review the resource profiles Table 4-4: Expected secondary, non-derived benefits of REQM Retain & Develop Skills and Domain Knowledge (5-1) Efficient Resource Management (4-3) One of the advantages of using the IGSI-ISM benefits model is that there are relationships between benefits where achieving one particular benefit contributes to the achievement of some other benefit(s). These benefits may then in turn lead to other benefits and so forth. In graph theory terms, the benefits model may be regarded as a tree and the derived benefits are mapped by traversing the tree from 90
105 lowest node to highest. Using this approach, the benefits resulting from implementation of REQM (Table 4-3 and Table 4-4) will contribute to the derived benefits defined in Table 4-5. Benefit Better Risk Management (4-2) Efficient Resource Management (4-3) Understanding Customer Needs (4-4) Retain & Develop Skills and Domain Knowledge (5-1) Leads To Better Risk Management (4-2) leads to Increased Productivity (3-2) and Predictability (3-4). Increased Productivity (3-2) leads to a better Image (2-1) and Higher Customer Satisfaction (2-2). Predictability (3-4) leads to Higher Customer Satisfaction (2-2). Better Image (2-1) leads to Increased Revenues/Profits (1-1). Higher Customer Satisfaction leads to Increased Revenues/Profits (1-1). Efficient Resource Management (4-3) leads to Better Risk Management (4-2). Better Risk Management (4-2) leads Increased Productivity (3-2) and Predictability (3-4). Increased Productivity (3-2) leads to a better Image (2-1) and Higher Customer Satisfaction (2-2). Predictability (3-4) leads to Higher Customer Satisfaction (2-2). Better Image (2-1) leads to Increased Revenues/Profits (1-1). Higher Customer Satisfaction leads to Increased Revenues/Profits (1-1). Understanding Customer Needs (4-4) leads to Setting Right Customer Expectations (3-3), increased Predictability (3-4), and more Competitive Proposals (3-5). Setting Right Customer Expectations (3-3) leads to a better Image (2-1) and Higher Customer Satisfaction (2-2). Predictability (3-4) leads to Higher Customer Satisfaction (2-2). Competitive Proposals (3-5) leads to increased Image (2-1). Better Image (2-1) leads to Increased Revenues/Profits (1-1). Higher Customer Satisfaction leads to Increased Revenues/Profits (1-1). Retain & Develop Skills and Domain Knowledge (5-1) leads to Better Risk Management (4-2) and Better Quality Product (4-1). Better Quality Product (4-1) leads to increased Market Reach (3-1) and Increased Productivity (4-2). Increased Market Reach (3-1) leads to increased Image (2-1) and increase Image (2-1) leads to Increased Revenues/Profits (1-1). Better Risk Management (4-2) leads to Increased Productivity (3-2) and Predictability (3-4). Increased Productivity (3-2) leads to a better Image (2-1) and Higher Customer Satisfaction (2-2). Predictability (3-4) leads to Higher Customer Satisfaction (2-2). Better Image (2-1) leads to Increased Revenues/Profits (1-1). Higher Customer Satisfaction leads to Increased Revenues/Profits (1-1). Lower Time to Market (5-2) Lower Time to Market (5-2) leads to Competitive Proposals (3-5). Competitive 91
106 Benefit Leads To Proposals (3-5) leads to better Image (2-1). Better Image (2-1) leads to Increased Revenues/Profits (1-1). Market Intelligence (7-3) Increased Market intelligence (7-3) leads to New Technology (6-4) and an increased Understanding (of) Customer Needs (4-4). New Technology (6-4) leads to Retain & Develop Skills and Domain Knowledge (5-1). Retain & Develop Skills and Domain Knowledge (5-1) leads to Better Risk Management (4-2) and Better Quality Product (4-1). Better Quality Product (4-1) leads to increased Market Reach (3-1) and Increased Productivity (4-2). Increased Market Reach (3-1) leads to increased Image (2-1) and increase Image (2-1) leads to Increased Revenues/Profits (1-1). Better Risk Management (4-2) leads to Increased Productivity (3-2) and Predictability (3-4). Increased Productivity (3-2) leads to a better Image (2-1) and Higher Customer Satisfaction (2-2). Predictability (3-4) leads to Higher Customer Satisfaction (2-2). Better Image (2-1) leads to Increased Revenues/Profits (1-1). Higher Customer Satisfaction leads to Increased Revenues/Profits (1-1). Table 4-5: Derived benefits of implementation of REQM Project Planning (PP) The purpose of Project Planning (PP) is to establish and maintain plans that define project activities and involves developing the project plan, interacting with stakeholders appropriately, getting commitment to the plan, and maintaining the plan (SEI 2002b). Of particular relevance to the IGSI-ISM model are SPs to identify project risks (SP 2.2-1), plan for needed knowledge and skills (SP 2.5-1), reconciliation of work and resource levels (SP 3.2-1), establishment of budget and schedule (SP 2.1-1), planning of stakeholder involvement (SP 2.6-1), and the obtaining of plan commitment (SP 2.7-1). In addition, the implementation of Generic Goal 2 (GG) to institutionalize a Managed Process aids in the predictability and quality of the product through a managed Project Planning process. Expected primary benefits for PP are shown in Table 4-6 and expected secondary benefits are shown in Table 4-7. Benefit Better Quality Product (4-1) Better Risk Management (4-2) Reason Project planning allows us to take a holistic view of a project and thoroughly plan all the various aspects that make up a quality end product. While it is not impossible to do this if a project is managed in piecemeal fashion, it certainly makes it much more likely with proper project planning. By planning the entire project up front, we can identify potential risks and plan accordingly. 92
107 Benefit Efficient Management (4-3) Understanding Needs (4-4) Resource Customer Reason By taking a holistic view of the project, we can identify all resource needs up front and make appropriate resourcing provisions. A project plan will allow us to ensure that we are allocating sufficient resources (at a high level) to meet and interact with customers. Setting Right Customer Expectations (3-3) Predictability (3-4) Competitive Proposals (3-5) A project plan will allow us to estimate the relevant costs and duration of a project. This will help us set customer expectations. Thoroughly planning and reviewing a project will allow us to predict how much effort and what resources are required for the project. In addition, by maintaining the project plan (especially with the help of quantitative management techniques), we will be able to become more accurate in our predictions over time. Increased predictability will allow us to more accurately cost potential projects thus allowing us to come up with more competitive proposals. Table 4-6: Expected primary benefits of PP Benefit Competitive Proposals (3-5) Reason Increased predictability will allow us to more accurately cost potential projects thus allowing us to come up with more competitive proposals. Market Reach (3-1) Increased Productivity (3-2) Stakeholder involvement is an essential part of PP. By involving itself on an on-going basis with stakeholders and performing in an efficient manner, organizations may be able to influence stakeholders in a positive way and thus increase market reach. The primary purpose of PP is to establish and maintain plans that define project activities. Unless a project is planned properly, there is no way for an organization to proactively manager resources on a project. If an organization does manage resources efficiently, this should translate into increased productivity. Competitive Proposals (3-5) Project Planning can aid in efficiently managing resources. If organizations can consistently manage their resources efficiently, thus increasing predictability, this will lead to competitive proposals as the risk of unpredictability in project costs can be significantly reduced. Table 4-7: Expected non-derived secondary benefits of PP 93
108 Project Planning (PP) Expected Primary Benefits Better Quality Product (4-1) Better Risk Management (4-2) Predictability (3-4) Setting Right Customer Expectations (3-3) Competitive Proposals (3-5) Efficient Resource Management (4-3) Understanding Customer Needs (4-4) Table 4-8: Expected benefits of PP Expected Secondary Benefits Market Reach (3-1) Increased Productivity (3-2) Competitive Proposals (3-5) Image (2-1) Higher Customer Satisfaction (2-2) Increased Revenues/Profits (1-1) Project Monitoring and Control (PMC) The purpose of Project Monitoring and Control (PMC) is to provide an understanding of the project s progress so that the appropriate corrective actions can be taken when the project s performance deviates from the plan (SEI 2002b). In effect, PMC is the process whereby an organization monitors its project activities as described in PP and makes appropriate changes. This directly contributes to a better quality product, better risk management, more efficient resource management, increased predictability over time, and setting customer expectations during a project. In particular, PMC consists of two SGs which in turn consist of several SPs, some of which directly contribute to the expected benefits described in the next section. Those SPs are the monitoring of project planning parameters (SP 1.1-1), the monitoring of commitments (SP 1.2-1), the monitoring of project risks (SP 1.3-1), the monitoring of stakeholder involvement, including customer involvement (SP 1.5-1) and the conducting of progress and milestone reviews (SP 1.6-1/7-1). Expected primary benefits for PMC are shown in Table 4-9 and there are no expected non-derived secondary benefits of PMC. Benefit Better Quality Product (4-1) Better Risk Management (4-2) Efficient Resource Management (4-3) Setting Right Customer Expectations (3-3) Reason The primary purpose of PMC is to provide an understanding of a project s progress to corrective actions can be undertaken. Such corrective action will allow action to be taken if the quality gates in a project plan are failing to be met. By constantly reviewing the progress of a project, a team is better able to manage and remediate any risks which arise. As a result of the constant review of progress, an organization can more allocate resources to those areas which need them and less to those areas which are making good progress. In order to set the right customer expectations, project teams should proactively inform them of any changes or potential for change. It is always better to warn a customer of potential delays up front rather than waiting until the end to let them know of an actual delay. Actively monitoring the status of a project allows organizations to do just this. 94
109 Benefit Predictability (3-4) Reason By actively monitoring projects, organizations are able to more accurately predict future projects and build those predictions into project plans. Table 4-9: Expected primary benefits of PMC By quantifying and monitoring project progress, we avoid getting into a crunch situation where people are under pressure to push untested or inadequately tested code to production. This also allows the project manager to re-allocate appropriate resources up front before the project goes into a tailspin. Consistent monitoring of projects across an organization will provide feedback to project managers as they are creating their project plans, thus increasing predictability and setting right customer expectations. In addition, as management and control functions are in place, project managers are in a position to know which parts of a project are particularly at risk and make appropriate choices and backup plans. Expected Primary Benefits Better Quality Product (4-1) Better Risk Management (4-2) Efficient Resource Management (4-3) Setting Right Customer Expectations (3-3) Predictability (3-4) Project Monitoring and Control (PMC) Expected Secondary Benefits Table 4-10: Expected benefits of PMC Market Reach (3-1) Increased Productivity (3-2) Image (2-1) Higher Customer Satisfaction (2-2) Increased Revenues/Profits (1-1) Supplier Agreement Management (SAM) The purpose of Supplier and Agreement Management (SAM) is to manage the acquisition of products from suppliers for which there exists a formal agreement (Chrissis et al. 2003). Reliance on an external supplier exposes an organization to quite a deal of risk and if that relationship is not handled correctly it can have disastrous consequences for an organization and a product. On the other hand, a top-notch external organization or product can greatly enhance an organization or product. The SAM PA consists of two SPs the establishment of supplier agreements and the satisfying of supplier agreements. In particular SP (select suppliers) and SP (establish supplier agreements) allow an organization of specify Service Level Agreements (SLAs) that define quality and turnaround time on products as well as remediation and/or penalties if SLAs are breached. The expected primary benefits for SAM are detailed in Table 4-11 and the expected secondary, non-derived benefits of SAM are detailed in Table
110 Benefit Reason Lower Time to Market (5-2) One of the main benefits of SAM is the establishment of SLAs which define the quality and minimum turnaround time on products. While an SLA may not necessarily lower time to marker, the corollary may be true by not having an SLA in place, time to market may in fact be increased. Better Quality Product (4-1) SAM requires SLAs on Quality to be defined in a supplier agreement. Again, while an SLA may not necessarily lead to a better quality product, the corollary may be true the absence of an SLA may lead to a worse quality product. Better Risk Management (4-2) SLAs and associated penalties around missing SLAs supplier agreements are a very important risk control when dealing with external (or internal) suppliers. Thus having an SLA in place will lead to better risk management. Predictability (3-4) SLAs based on quality, cost, and time will increase the predictability of any product depending on a supplier as, if a supplier fails to meet an SLA, the supplier will be subject to the penalties outlined in the supplier agreement. Table 4-11: Expected primary benefits of SAM During the process of entering into formal agreements with various suppliers, the organization will put in place safeguards to ensure the products supplied will be of a certain quality, have to be delivered within a certain timeframe and may also detail the quality and makeup of the individual components within the product being supplied. As a result of this process and agreement, the product supplied will be of a defined quality and will be delivered within a specified timeframe. This will affect individual projects by increasing overall quality and predictability, as well as helping to manage risk. In addition, suppliers will have expertise in producing the product in question. This expertise should translate to a lower time to market for the individual product and, as a result, to the project as a whole. Benefit Reason Setting Right Customer Expectations By having SAM in place, formal agreements (3-3) and SLAs are established between a supplier and an organization. The agreements and SLAs are negotiated with the knowledge of what customer expectations currently are and thus aid in setting and maintaining the right customer expectations for the organization. Table 4-12: Expected non-derived secondary benefits of SAM 96
111 Expected Primary Benefits Lower Time To Market (5-2) Better Quality Product (4-1) Better Risk Management (4-2) Predictability (3-4) Supplier Agreement Management (SAM) Expected Secondary Benefits Table 4-13: Expected benefits of SAM Market Reach (3-1) Increased Productivity (3-2) Setting Right Customer Expectations (3-3) Predictability (3-4) Image (2-1) Higher Customer Satisfaction (2-2) Increased Revenues/Profits (1-1) Measurement and Analysis (MA) Definition The purpose of Measurement and Analysis (MA) is to develop and sustain a measurement capability that is used to support management information needs (Chrissis et al. 2003). MA consists of 2 SGs the alignment of Measurement and Analysis activities (SG1) and the obligation to provide measurement results (SG2). Measurement and analysis of appropriate metrics is essential in order to provide feedback to an organization on the current and potential future state of a project. SG1 provides several important SPs to enable the benefits described below. In particular, it provides for the specification of metrics (SP 1.2-1), the specification of data collection and storage procedures (SP 1.3-1), and the specification of analysis procedures (SP 1.4-1). SG2 in general provides for the feedback loop to enable an organization to act on the results of the results obtained in SG1. The expected primary benefits for MA are detailed in Table 4-14 and the expected secondary, non-derived benefits of MA are detailed in Table Benefit Lower Time to Market (5-2) Better Quality Product (4-1) Better Risk Management (4-2) Reason MA involves the creation and reporting of various metrics to support management information needs. Such metrics will allow a project team to review important information with regard to the progress of a project. This will allow a project team to adapt their strategies to most efficiently bring a project to market. Product metrics such as quality are a major factor in establishing the quality of a product. With such metrics, it is possible to alter processes and procedures to increase the quality of products. Without the ability to measure various facts, it would be virtually impossible to determine if a project is at risk. Once a project team is aware of a risk, only then can they remediate the risk. This MA provides a project team the ability to 97
112 Benefit Reason better manage risk. Predictability (3-4) Predictability is gained when, over time, accurate measurements are taken of various aspects of projects. Only when accurate measures are available, is it possible to predict costs, times, and quality. Table 4-14: Expected primary benefits of MA By developing and maintaining a measurement capability within a project and organization, we will enable the organization to quantify various aspects of the whole development lifecycle. This will allow the organization to see where certain elements break down and do not live up to their full potential. As a result, the organization should be able to make appropriate changes to projects and processes to produce better quality products, better manage risk, lower time to market, and increase predictability. Benefit Reason Setting Right Customer Expectations (3-3) One of the most important factors in setting the right customer expectations is in ensuring predictability a product should be ready when an organization says it should be ready. As mentioned in the section on primary benefits, one of the main elements in aiding predictability is the collection of metrics across various projects which will allow an organization to create an organizational metric database. This database will aid in increasing predictability and, as a result, help in setting the right customer expectations. Table 4-15: Expected non-derived secondary benefits of MA Measurement and Analysis (MA) Expected Primary Benefits Expected Secondary Benefits Lower Time To Market (5-2) Market Reach (3-1) Better Quality Product (4-1) Increased Productivity (3-2) Better Risk Management (4- Setting Right Customer Expectations (3-2) 3) Predictability (3-4) Competitive Proposals (3-5) Image (2-1) Higher Customer Satisfaction (2-2) Increased Revenues/Profits (1-1) Table 4-16: Expected benefits of MA 98
113 Process and Product Quality Assurance (PPQA) Definition The purpose of Process and Product Quality Assurance (PPQA) is to provide staff and management with objective insight into processes and associated work products (SEI 2002b; Chrissis et al. 2003). This PA supports the delivery of high quality products and services by providing the project staff and managers at all levels with appropriate visibility into, and feedback on, processes and associated work products throughout the life of the product. Increased quality has a direct relationship to product quality, risk reduction, lower time to market and, over time, increased predictability. Further, as per SP (objectively evaluate work products and services), processes and methods are constantly under review and will result in improved institutionalization of successful processes and methods. The expected primary benefits for PPQA are detailed in Table There are no expected secondary, non-derived benefits resulting from implementation of PPQA. Benefit Improved Institutionalization of Tools/Process/Methods (7-1) Lower Time to Market (5-2) Better Quality Product (4-1) Reason One of the primary benefits of PPQA is to provide feedback on processes and associated work products throughout the life of a product. This feedback will allow organizations to alter how processes and work products are institutionalized which should aid in their adoption and institutionalizations. Provision of feedback, in both the positive and negative, should provide opportunities to improve processes and thus lower time to market. Objective insight into processes and associated work products will allow improvements to be made in those processes and work products, thus increasing their quality and the quality of the product being produced. Better Risk Management (4-2) Improved processes should reduce an organization s risk by ensuring more robust and efficient processes and work products. Predictability (3-4) More improved and efficient processes in conjunction with better quality work products should increase the predictability of products being produced. Table 4-17: Primary benefits of PPQA The focus of this PA is on objectively evaluating performed processes, identifying non-compliance, and providing feedback on processes, including non-compliance issues. Doing so will lead to better quality products, and improved institutionalization of processes. In addition, by identifying non-compliant processes, overall risk will be lowered and predictability enhanced. A full review of processes should lead to optimization in processes and, as a result, lower time to market. 99
114 Expected Primary Benefits Improved Institutionalization of tools/process/methods (7-1) Lower Time To Market (5-2) Better Quality Product (4-1) Better Risk Management (4-2) Predictability (3-4) Process and Product Quality Assurance (PPQA) Expected Secondary Benefits Skill development facilitation by management (6-1) Effective Information Management (6-2) Teaming/Synergize (6-3) Retain & Develop Skills & Domain Knowledge (5-1) Efficient Resource Management (4-3) Understanding Customer Needs (4-4) Market Reach (3-1) Increased Productivity (3-2) Setting Right Customer Expectations (3-3) Predictability (3-4) Image (2-1) Higher Customer Satisfaction (2-2) Increased Revenues/Profits (1-1) Table 4-18: Expected benefits of PPQA Configuration Management (CM) Definition The purpose of Configuration Management (CM) is to establish and maintain the integrity of work products using configuration identification, configuration control, configuration status accounting, and configuration audits (SEI 2002b; Chrissis et al. 2003). CM consists of 3 SGs SG1 (the establishment of baselines), SG2 (the tracking and control of changes), and SG3 (the establishment of integrity). In software projects it is absolutely essential that all artefacts are correctly baselined and tracked. Without this baselining and tracking, there is no guarantee that code, requirements or any other project artefact will be consistent with each other, thus increasing risk and reducing quality. In fact, the opposite is true, effective configuration management is essential for increasing quality and reducing risk. In addition, as Burzcuk and Appleton (2002) note, configuration management, and in particular version control, plays a role in supporting to work of teams and that software configuration management serves as a mechanism for communication, change management and reproducibility. The expected primary benefits for CM are detailed in Table 4-19 and the expected secondary, non-derived benefits of CM are detailed in Table 4-20Table Benefit Reason 100
115 Teaming/Synergize (6-3) Configuration Management is an essential process that allows project teams to efficiently share artefacts which in many cases should be modified by only one team member at a time. As such, it is a vital tool in teaming allowing a team to work efficiently together. Better Quality Product (4-1) Configuration management is essential in ensuring that certain resources such as source code cannot be updated by multiple team members at once. As configuration management ensures that only the correct version of a work product may be worked on at any one time integrity this will lead to a better quality product. Better Risk Management (4-2) As a result of the integrity enforced by configuration Management, there is much less risk of work products being worked on out of sequence, thus minimizing a project team s exposure to risk as a result of integrity issues. Table 4-19: Expected primary benefits of CM Configuration management allows projects to properly track the various parts that make up their products. By instituting CM, multiple teams will be able to edit/modify code without stepping over each others toes. In addition, CM allows project teams to map changes back to specific issues or requirements, thus increasing product quality and managing risk. 101
116 Benefit Reason Understanding Customer Needs (4-4) Only by ensuring that all artefacts are correctly versioned can you ensure that you can understand and meet customer needs. Table 4-20: Expected non-derived secondary benefits of CM Expected Primary Benefits Teaming/Synergize (6-3) Better Quality Product (4-1) Better Risk Management (4-2) Configuration Management (CM) Expected Secondary Benefits Retain & Develop Skills & Domain Knowledge (5-1) Lower Time To Market (5-2) Efficient Resource Management (4-3) Understanding Customer Needs (4-4) Market Reach (3-1) Increased Productivity (3-2) Setting Right Customer Expectations (3-3) Predictability (3-4) Image (2-1) Higher Customer Satisfaction (2-2) Increased Revenues/Profits (1-1) Table 4-21: Expected benefits of CM 102
117 Expected Primary Benefits Better Risk Management (4-2) Understanding Customer Needs (4-4) Lower Time to Marker (5-2) Expected Primary Benefits Better Quality Product (4-1) Better Risk Management (4-2) Predictability (3-4) Setting Right Customer Expectations (3-3) Competitive Proposals (3-5) Efficient Resource Management (4-3) Understanding Customer Needs (4-4) Expected Primary Benefits Better Quality Product (4-1) Better Risk Management (4-2) Efficient Resource Management (4-3) Setting Right Customer Expectations (3-3) Predictability (3-4) Requirements Management (REQM) Expected Secondary Benefits Project Planning (PP) Market Intelligence (7-3) Retain & Develop Skills & Domain Knowledge (5-1) Efficient Resource Management (4-3) Predictability (3-4) Competitive Proposals (3-5) Image (2-1) Higher Customer Satisfaction (2-2) Increased Revenues/Profits (1-1) Expected Secondary Benefits Project Monitoring and Control (PMC) Market Reach (3-1) Increased Productivity (3-2) Predictability (3-4) Competitive Proposals (3-5) Image (2-1) Higher Customer Satisfaction (2-2) Increased Revenues/Profits (1-1) Expected Secondary Benefits Market Reach (3-1) Increased Productivity (3-2) Image (2-1) Higher Customer Satisfaction (2-2) Increased Revenues/Profits (1-1) Expected Primary Benefits Lower Time To Market (5-2) Better Quality Product (4-1) Better Risk Management (4-2) Predictability (3-4) Supplier Agreement Management (SAM) Expected Secondary Benefits Market Reach (3-1) Increased Productivity (3-2) Setting Right Customer Expectations (3-3) Predictability (3-4) Image (2-1) Higher Customer Satisfaction (2-2) Increased Revenues/Profits (1-1) Table 4-22: Summary of all CMMI (Staged) Level 2 Benefits Table 4-22 and Table 4-23 summarize all the expected primary and secondary benefits resulting from the implementation of RS-ICMMI. 103
118 Expected Primary Benefits Measurement and Analysis (MA) Expected Secondary Benefits Lower Time To Market (5-2) Better Quality Product (4-1) Better Risk Management (4-2) Predictability (3-4) Expected Primary Benefits Improved Institutionalization of tools/process/methods (7-1) Lower Time To Market (5-2) Better Quality Product (4-1) Better Risk Management (4-2) Predictability (3-4) Market Reach (3-1) Increased Productivity (3-2) Setting Right Customer Expectations (3-3) Predictability (3-4) Image (2-1) Higher Customer Satisfaction (2-2) Increased Revenues/Profits (1-1) Process and Product Quality Assurance (PPQA) Expected Secondary Benefits Skill development facilitation by management (6-1) Effective Information Management (6-2) Teaming/Synergize (6-3) Retain & Develop Skills & Domain Knowledge (5-1) Efficient Resource Management (4-3) Understanding Customer Needs (4-4) Market Reach (3-1) Increased Productivity (3-2) Setting Right Customer Expectations (3-3) Predictability (3-4) Image (2-1) Higher Customer Satisfaction (2-2) Increased Revenues/Profits (1-1) Expected Primary Benefits Teaming/Synergize (6-3) Better Quality Product (4-1) Better Risk Management (4-2) Configuration Management (CM) Expected Secondary Benefits Retain & Develop Skills & Domain Knowledge (5-1) Lower Time To Market (5-2) Efficient Resource Management (4-3) Understanding Customer Needs (4-4) Market Reach (3-1) Increased Productivity (3-2) Setting Right Customer Expectations (3-3) Predictability (3-4) Image (2-1) Higher Customer Satisfaction (2-2) Increased Revenues/Profits (1-1) Table 4-23: Summary of all CMMI (Staged) Level 2 Benefits (cont.) 104
119 4.4.4 Step 4 Determine Implementation Order In many cases, organizations are not so much concerned with faithfully implementing all CMMI Levels or all PAs as they are with achieving specific results. In fact, many organizations are agnostic as to the actual SPI methodology used to deliver results as long as they are achieved within a mature and repeatable framework. Examples of specific results that organizations may want to achieve are increases in productivity and/or lower their time to market. This section will concentrate on providing an example of how to achieve specific objectives. The sample objective used here is Lower Time to Market. The process to achieve this is as follows: 1. Determine which of the IGSI-ISM objectives that we wish to achieve 2. Using the IGSI-ISM model, determine which other objectives, if any, contribute to achieving our primary objective 3. Using the PA-Business Objectives map, establish which PAs contribute to both the primary and secondary objectives that we have determined in the previous two steps 4. Rank the PAs in order of relevance and implementation. This is represented graphically in Figure Figure 4-10: Determining order of implementation 105
120 Determine the IGSI-ISM Primary Objective The choice of which IGSI-ISM objective to aim for is usually determined for us by outside forces such as senior management or, in some cases, external clients. The example used here is Lower Time to Market (5-2). Determine IGSI-ISM objectives contribute to the Primary Objective Using the IGSI-ISM model (Figure 4-9), it can be seen that Lower Time to Market (5-2) depends on the following lower-level objectives: IGSI-ISM Id Objective Name 6-1 Skill development Facilitation by Management 6-2 Effective Information Management 6-3 Teaming/Synergize 7-1 Improved Institutionalization of Tools/Process/Methods 7-2 Business Focus Table 4-24: Lower Time to Market Determine which PAs contribute to IGSI-ISM Objectives To summarize our progress so far, we started out with a specific objective ( Lower Time to Market, 5-2), and then, using the IGSI-ISM model, we determined which lower-level objectives contribute to the higher level objective. Using Figure 4-9 and Table 4-22, PAs are identified as shown in Table
121 PA Identifier Staged Level Process Area Expected Primary IGSI ROI Expected Secondary IGSI ROI Benefits Benefits Managed Requirements Management 4-2, 4-4, , 5-1, 4-3, 3-4, 3-5, 2-1, 2-2, Supplier Agreement 5-2, 4-1, 4-2, , 3-2, 3-3, 3-4, 2-1, 2-2, 1-1 Management 2-5 Measurement and 5-2, 4-1, 4-2, , 3-2, 3-3, 3-4, 2-1, 2-2, 1-1 Analysis 2-6 Process and Product Quality Assurance 7-1, 5-2, 4-1, 4-2, , 6-2, 6-3, 5-1, 5-2, 4-3, 4-4, 3-1, 3-2, 3-3, 3-4, 3-5, 2-1, 2-2, Configuration Management 6-3, 4-2, , 5-2, 4-3, 4-4, 3-1, 3-2, 3-3, 3-4, 3-5, 2-1, 2-2, Defined Requirements Development 5-2, 4-1, 4-2, 4-4, 4-3, 3-1, 3-2, 3-3, 3-4, 3-5, 2-1, 2-2, Organizational Process Focus 7-1, 7-2, , 6-2, 6-3, 6-4, 5-1, 5-2, 4-1, 4-2, 4-3, 4-4, 3-1, 3-2, 3-3, 3-4, 3-5, 2-1, 2-2, Organizational Process Definition 7-1, , 6-3, 5-1, 5-2, 4-1, 4-2, 4-3, 4-4, 3-1, 3-2, 3-3, 3-4, 3-5, 2-1, 2-2, Organizational Training 6-1, , 5-2, 4-1, 4-2, 4-3, 4-4, 3-1, 3-2, 3-3, 3-4, 3-5, 2-1, 2-2, 1-1 Integrated Project Management 6-3, 4-1, 4-2, 4-3, , 5-2, 3-1, 3-2, 3-3, 3-4, 3-5, 2-1, 2-2, Integrated Project Management for IPPD 6-3, 4-1, 4-2, 4-3, , 5-2, 3-1, 3-2, 3-3, 3-4, 3-5, 2-1, 2-2, Integrated Teaming 6-3, 6-2, 4-1, 4-3, 4-2, , 5-2, 3-1, 3-2, 3-3, 3-4, 3-5, 2-1, 2-2, Integrated Supplier 7-2, 7-3, 6-3, 6-4, 5-2, 4-1, 4-5-1, 5-2, 4-3, 3-1, 3-2, 3-3, 3-5, 2- Management 2, 3-4 1, 2-2, Organizational Environment for Integration 7-1, 7-2, 6-2, 6-3, , 6-2, 6-4, 5-1, 5-2, 4-1, 4-2, 4-3, 4-4, 3-1, 3-2, 3-3, 3-4, 3-5, 2-1, 2-2, Quantitatively Managed Organizational Process Performance 4-2 Quantitative Project Management Optimizing Organizational Innovation and Deployment 5-2 Causal Analysis and Resolution 7-1, 7-2, 7-3, , 6-3, 5-1, 5-2, 4-1, 4-2, 4-3, 4-4, 3-1, 3-2, 3-3, 3-4, 3-5, 2-1, 2-2, , 4-1, 4-2, , 4-4, 2-1, 3-3, 3-4, 3-5, 2-1, 2-2, , 7-2, , 6-2, 6-3, 6-4, 5-1, 5-2, 4-1, 4-2, 4-3, 4-4, 3-1, 3-2, 3-3, 3-4, 3-5, 2-1, 2-2, , 6-2, 5-2, 4-1, 4-2, , 6-3, 5-1, 4-4, 3-1, 3-2, 3-3, 3-4, 3-5, 2-1, 3, 1-1 Table 4-25: Example Objective - Lower Time to Market Rank Process Areas for Implementation As can be seen from Table 4-25, there are several PAs which have an effect on Lower Time to Market. Most organizations have finite resources and so will not be able to implement them all concurrently so we are forced to prioritize them for 107
122 implementation. There are many different ways to rank them but there are two very important factors to keep in mind when deciding on an order: 1. More consideration should be given to those PAs that primarily satisfy a particular objective. By this we mean that those PAs that satisfy an objective as a primary objective should be given higher ranking than those that do not. For example, in Table 4-25 we see that both Process and Product Quality Assurance (PPQA) and Configuration Management (CM) both help to us attain Lower Time to Market. PPQA has Lower Time to Market as a primary objective while CM does not. As a result, PPQA should be implemented before CM. The reasoning behind this is that PPQA fully satisfies the Lower Time to Market objective while CM satisfies the Teaming/Synergize (6-3) objective which is only a contributing objective to Lower Time to Market 2. More consideration should be given to those PAs that, in the Staged Model, are lower in the Stage phases. For example, both Requirements Management (RM) and Requirements Development (RD) directly satisfy Lower Time to Market but, as RM is a Level 2 PA, it should be undertaken before RD. Using these principles, here would be a recommended order for implementation: PA Identifier Process Area Expected Primary IGSI ROI Benefits 2-1 Requirements Management 4-2, 4-4, Supplier Agreement Management 4-2, 4-1, 3-4, Measurement and Analysis 4-2, 4-1, 5-2, Process and Product Quality Assurance 4-1, 4-2, 5-2, 7-1, Requirements Development 5-2, 4-4, 4-2, Integrated Supplier Management 7-3, 6-3, 6-4, 4-1, 4-2, 7-2, 3-4, Organizational Environment for Integration 6-2, 6-3, 7-2, 5-2, Quantitative Project Management 4-1, 4-2, 4-3, Causal Analysis and Resolution 6-2, 5-2, 4-1, 4-2, 4-3, Configuration Management 6-3, 4-2, Organizational Process Focus 7-1, 7-2, Organizational Process Definition 6-2,
123 PA Identifier Process Area Expected Primary IGSI ROI Benefits 3-8 Organizational Training 6-1, Integrated Project Management for IPPD 6-3, 4-1, 4-2, 4-3, Integrated Teaming 6-3, 4-1, 4-3, 4-2, 4-4, Organizational Process Performance 7-1, 7-2, 7-3, Organizational Innovation and Deployment 7-1, 7-2, 7-3 Table 4-26: Implementation order of PAs Note that this is a recommended order there are other equally valid orders that could be undertaken depending on the requirements of the organization. Therefore, if it has been established by either a formal or an informal capability assessment that an organization is weaker in a particular PA than others, then it may make sense to prioritize that PA within the principles outlined above. Therefore, if an organization has been assessed as being relatively more mature in Requirements Management but less mature in Configuration Management, it may make sense to prioritize Configuration Management over Requirements Management Step 5 Identify Metrics for Benefits As explained in section 4.3, identification of which metrics may be used to determine if an organization is succeeding in achieving its business objectives is carried out using GQM. In this section, we shall take some specific examples of business objectives and determine appropriate metrics which can be used to determine if an organization is succeeding in achieving its business objectives. It should be noted (as shown in Figure 4-8) that there is a many-to-many relationship between a metric and a benefit i.e. a given metric may be associated with one or more benefits and a given benefit may be associated with one or more metrics. As a result, a metric may appear as an indicator for more than one benefit. For the first example, we will take Lower Time to Market (5-2). A possible metric could be, for projects of a given complexity, the time to complete from concept to release. We could also investigate if, for the various parts of the project life cycle, durations have increased, decreased or remained static. 109
124 To measure the Better Quality Product (4-1), possible metrics include defect density at various phases in the lifecycle, costs due to lack of quality (Mandeville 1990; Houston and Keats 1996), loss of reputation to the firm, any lost bids, software reliability, software rate of change (Garmus and Herron 2001), or increase/decrease in software complexity (McCabe 1976; Halstead 1977). Possible metrics to see progress on Better Risk Management (4-2) could be availability of risk and mitigation plans, the number of risk and mitigation points available, Requirements Risk Metrics (Nogueira et al. 2000) such as Birth Rate (BR percentage of new requirements added in each cycle of the evolution process), Death Rate (DR percentage of requirements dropped by client at each stage in the evolution process), Change Rate (CR percentage of existing requirements changed at each stage of the process), and Risk Leverage (Christensen and Thayer 2001). Measurement of Understanding Customer Needs (4-4) can be done qualitatively, using such metrics as requirements stability and customer satisfaction (Kan 2003): % completely satisfied % satisfied (satisfied and completely satisfied) % dissatisfied customers (dissatisfied and completely dissatisfied) % non-satisfied customers (neutral, dissatisfied, completely dissatisfied). It should be noted that all the metrics mentioned above are illustrative of potential metrics that may be used to check on progress within an improvement program and are not exhaustive. One of the advantages of using the RS-ICMMI model is the fact that practitioners are free to use whatever metrics they deem to be most appropriate to measure progress within particular areas. 4.5 Conclusion The power of the RSM model lies in the fact that it is a flexible and straightforward methodology that can be readily and easily modified by practitioners to fit their own particular needs. Like ISO/IEC and CMMI, I describe a methodology and what it is capable of doing. In addition, I provide an implementation of the methodology. The power of RS-ICMMI instance is that it uses an industry-standard SPI model and is of immediate use by practitioners with little, if any, modification. By describing in abstract terms what a metric/indicator is, what a generic benefit/objective is, what an SPI is, and the relationships between them, the door is open for practitioners to use the model on whatever SPI initiative of choice they wish to implement. 110
125 Finally, the model is extensible in that practitioners can add their own metrics and benefits/objectives either as replacements or in addition to the ones currently described in the RS-ICMMI implementation instance. In short, RSM model is truly a Rosetta Stone Methodology allowing personnel in the field to freely translate between SPIs, Benefits/Objectives, and Metrics. However, it needed to be validated. This is carried out in two steps the validation of the Rosetta Stone Methodology (Chapter 5) and the validation of RS-ICMMI (Chapter 6). 111
126 5 Rosetta Stone Methodology Validation Process 5.1 Introduction An expert panel was used to validate both the Rosetta Stone Methodology. This chapter reviews the questions asked of interviewees, reviews and analyses the results of the interviews and to compares the results against what was expected. As described in Chapter 3, the expert panel method was chosen as the appropriate research and analysis tool for this work. 5.2 The Objectives of the Research Figure 5-1: Rosetta Stone Meta-Model to Instance Mapping The work presented in this thesis consists of both the generic Rosetta Stone Methodology and an implementation instance of the Rosetta Stone Methodology - the RS-ICMMI mapping of the IGSI-ISM benefits model to CMMI (Staged) mapping. Logically this mapping is presented in Figure 5-1. While the entire subject area is of interest to the researcher, as a result of this approach to the model, there is a natural break in how to approach the interview one area is to look at the validity and correctness of the Rosetta Stone Methodology and the associated meta-model model and the other area is to look at the validity and correctness of the mapping instance the mapping of the IGSI-ISM model to CMMI (Staged). In addition to these two areas, I was interested in some general questions is this approach new and worthy of research and, if the approach is in 112
127 fact novel, what are the reasons that practitioners undertake SPI in general and my model in particular? Using MindMapping techniques (Buzan 2006), I developed a MindMap of all the research questions. In addition to the questions, all the other items which would be required in an interview were added as an aide-memoir into the MindMap. The resulting MindMap is shown in Figure 5-2. We shall now discuss each of the individual sections in the MindMap Introductory Section The purpose of the Introductory section is to give the interviewee a sense of who I am and why they are being asked to participate in the research. In addition, it gave me the opportunity to describe the layout of the interview process and how long the interview process would take. At this point in the interview, I also asked permission to record each interview Background Information on the Interviewee The credentials of the interviewee were established during this part of the interview. Where applicable, the academic credentials, as well as the work experience of the interviewee were gathered. As most of the interviewees worked either for for-profit companies or for companies which work on United States Department of Defence (USDOD) contracts, there was an element of confidentiality involved. As a result, all interviewees were asked if they wished to contribute anonymously to the expert interviews. With the exception of one interviewee, all interviewees allowed their details to be published and even that one person who did not wish to publish his details only asked that his company not be named Review of the Methodology The third section in the interview involved a walk-through of the methodology and meta-model. This was undertaken in the format of a presentation which is included in Appendix F and was part of the materials submitted to all interviewees in advance of the interview. While all interviewees were provided with an overview of both the meta-model and the interview (in the form of the MindMap in Figure 5-2) well in advance of the meeting, that approach did not replace the need for a personal, worked-through review of the model. I therefore walked each interviewee through the full methodology and a cut-down version of the CMMI (Staged) mapping. In the walk-through, I concentrated on the mapping from the IGSI-ISM model to CMMI (Staged) Level 2. The reason for this approach was 3 fold it allowed me to reduce the time for the interview, particularly as most people do not have a tremendous amount of time to spend on it; at the same time it still allowed me to fully describe both the generic benefits 113
128 model as well as the IGSI-ISM model; and finally, as anyone that has been involved in CMM or CMMI (Staged) at any level will have had to have progressed at least through to Level 2, it provides a common level of knowledge upon which to base the interview and subsequent questions. Figure 5-2: Rosetta Stone Expert Panel Interview Mindmap 114
129 5.2.4 Questions As discussed in the chapter on Research Methods, one of the reasons that an expert panel approach was used is that, while directed and scientific in nature, it allows an interviewer to explore answers from interviewees and thus allows them to be less rigid than if they used other forms of response gathering techniques such as questionnaires. As a result, as many of the questions as possible were open-ended in that they allowed interviewees to freely add in their own comments, ideas, and thoughts. This was considered especially important as this is a brand new model which has not been proposed by anyone previously. The first group of questions posed were about the reasons why organizations would use an SPI model. From discussions with colleagues and through articles in the literature, it appears that organizations might use SPI for a variety of reasons (which we will discuss later in this chapter) but are there any other hidden reasons for undertaking an SPI program? This is relevant to this research as the Rosetta Stone Methodology allows people to focus on business-relevant benefits as the driver for SPI implementation while, traditionally, organizations may have undertaken SPI as a way to obtain USDOD contracts and as market differentiators for consulting companies to differentiate themselves from competitors. The second group of questions talked to the novelty of the proposed approach was anyone aware of any other similar, benefits-driven models out there? If so, what were they and was there a direct comparison with the Rosetta Stone Methodology? The reason behind these questions was to demonstrate the uniqueness of the work undertaken in this research and, if it turned out that there was anything similar out there, was it relevant to the methodology? If relevant, was it complementary or did it cast doubt on the approach taken? The third and fourth groups of questions were about the methodology and metamodel. While the methodology and meta-model are very flexible and appear to make sense at a high level, many of the interviewees found it useful to discuss the methodology in the context of the worked example Other Comments by Interviewees As I wanted to elicit as much information as possible, before closing out each interview, I asked each of them an open-ended question about the model given the model that they had just reviewed and answered questions about, were there any comments they wished to add? 115
130 5.3 Interviewees For this research, 17 people were interviewed: Last Name First Name Organization Bhattacharia Swaraj International Consulting Company Chatmon Al Northrupp Grumman Electronic Systems Division Inc. Corkery Gillian Fidelity Investments Dagnino Aldo ABB Ltd. Dittmar Peter Northrupp Grumman Electronic Systems Division Inc. Doyle Michael Motorola Ireland Falvey Abina Ericsson Ireland Fantina Bob Research In Motion Inc. Fried Steve Boeing Aerospace Gatt Israel Data Systems Designers Lucey Pat AspiraCon Millner Harvey Satyam Mitra Amit Independent Consultant O'Kane Tom Motorola Ireland and University College Cork Rayford Joan Innovision Technologies Reeve April Citco Technology Management Reitzig Rolf Cognence Inc. Table 5-1: List of Interviewees 116
131 Table 5-2 summarizes their experience. Statistic SPI Experience Total Work Experience Average Median Total Maximum Minimum 4 10 Table 5-2: Summary of interviewee experience Appendix C contains full details of the interviewees and their experiences. In addition, in order to protect anonymity and to respect the assurances given to the participants in the interview process, random pseudonyms have been given to the interviewees so that, when attributing opinions or quoting interviewees, the pseudonyms are used in the attribution process and not the actual person. These pseudonyms are labelled I1 to I17, where I represents Interviewee and the comments and opinions of an interviewee are attributed using a random pseudonym. For example, if I14 (interviewee 14) stated that a mapping was in line with expectations, then the quote could appear as either I14 stated that the mapping was in line with expectations or that the mapping was in line with expectations (I14). 5.4 Analysis of Interviews Question Group 1 Reasons for using SPI In the literature, several reasons have been identified as to why organizations would engage in a program of SPI. The main reasons put forward in the literature have been that a formal SPI recognition award such as CMMI Level x or ISO compliance can act as market differentiators for consulting firms who wish to attract clients; in many cases, in particular where organizations wish to compete for government contracts in areas such defence, being in possession of a certain SPI award, such as being CMMI Level 3 compliant, is a necessary prerequisite before even entering into a tender process; and, lastly, many companies undertake SPI programs because they intuitively believe that undertaking such a program will give them benefits in general. 117
132 While all the interviewees agreed that the reasons put forward above were very valid and the most likely reasons for undertaking SPI, there were some other reasons put forward by them in the interview process. One local interviewee (I9) stated that SPI can also be an internal differentiator. In particular, in one company that that the person worked in, the fact that the Irish division he worked in was at a particular level of CMM was used by company management as a reason to keep that division open while another division which hadn t been rated in CMM was wound down. I3 echoed this sentiment in that he believed that SPI can aid in the survival of an organization, especially if you are an offshore organization and by undertaking SPI you can show that you can simultaneously execute and show value. By doing this you are one step ahead of other companies. All the interviewees agreed that they believe that the 3 reasons described above are widely held by organizations. In particular, I5, I6, and I7 also stated that, even in the absence of formal proof of productivity gains within their organizations, they believe that SPI provides productivity gains. I16, who works for a very large software consulting firm, stated that, while initially he believed that the firm started using SPI for marketing reasons, the firm now follows it because it has given them a huge discipline and they find it really works. The interviewees unanimously agreed that they believed the existing SPI methodologies were process and IT-focused, not benefits-driven. While every one of the participants had quite a deal of experience in SPI, there were some SPI general comments which indicated that some of the interviewees have experienced negative feedback on SPI. In particular, I14 stated that one of the problems with CMM/CMMI is that it is onerous to execute, I12 was of the opinion that one of the problems with CMMI is that it s a very technical model, and I3 stated that there is apparently an opinion in the industry that CMMI level 3 is enough [to achieve] and that levels 4 and 5 have too much overhead associated with them. Other apparently negative comments on SPI came from I5 and I6 who stated that large companies also have an issue of pointing out what the benefits of SPI are. This feeling was also echoed by I9 when he said that it is not clear what the main benefits of SPI are. I5 and I6 were also somewhat critical of SPI as they felt that project managers sometimes see SPI as overhead rather than a tool that can add value to their projects. We should note here that the while many of the negative comments are obviously aimed at CMM/CMMI, we should also recognize that the vast majority of all interviewees experiences centre around CMM/CMMI. Criticism of CMM/CMMI is not new and, as we have seen in section 2.10, tends not to relate to individual SPI processes but rather the overhead associated with CMM/CMMI as a whole. 118
133 5.4.2 Question Group 2 Novelty of Approach With regard to the novelty of the work, the interviewees unanimously agreed that they knew of no other benefits-driven methodology and that all the methodologies that they were aware of are process- and not benefits-driven. While all the interviewees saw the value of a benefits-driven approach, several interviewees made some particular comments as to why it was a good approach. I9 pointed out that, while people in general feel that SPI is good, a lot of practitioners are not particularly aware of the specific value of undertaking SPI and this approach goes a long way to addressing the value of undertaking SPI. I12 stated that there was a perception that CMMI came with a high overhead associated with it and a benefits approach made it easy to see the business benefits from SPI. In a similar vein, I5 stated that there was a common conception, particularly within the project management community, that SPI is an overhead that gets in the way of doing real work but the Rosetta Stone approach can be used to demonstrate to people in the trenches why to use SPI. In addition, I6 thought that it was a very useful translation tool to connect business benefits to a proven pedigree [SPI methodology]. I4 thought that a benefits-driven approach is especially useful as some companies want to improve at their own pace using established standards in a systematic fashion and that the Rosetta Stone approach is a structured systematic way to prioritize SPI. Another advantage of this approach is that an organization is not required to make a massive investment straight away a distinct advantage (I10) and it makes the approach very tangible to people on the ground. This last comment is also reflected by comments from I5 and I6 the tool can be used to demonstrate to people in the trenches why to use SPI. I12 is of the opinion that it s definitely a good approach not quantitative but I doubt if it s realistically possible to have a quantitative approach as most companies don t have that information - no-one has that information. The other question posed in this group of questions was on the applicability of this methodology to large, medium, and small companies. My initial thoughts were that this methodology would be of more use to small companies who have definite business needs and who don t have either a need to be at a certain level of SPI compliance or who don t have the money to do so. In this area I was surprised in that, while everyone agreed it would be useful to all types of company, several people were of the opinion that it would be of particular use to large companies. In particular, one person who has worked as a consultant in many different companies (I12) stated that CMMI is a very technical model and that senior business management are not at all interested in SPI. Therefore any methodology which allows business management to see the concrete benefits of spending money on SPI would be particularly useful in large companies where IT is a distinct organization separated out from the business. I17 was also of the opinion that the Rosetta Stone Methodology was of particular relevance to large companies as they spend a lot of money on CMMI. In his opinion, using the RS- ICMMI mapping instance, you can target specific business objectives without having to implement an entire CMMI level, thus saving the organization money. He also expressed the opinion that the methodology could have a very good impact of the bottom line of small companies from a benefits perspective. One 119
134 interesting point noted by I15 was that the interviewee believed that the benefit to smaller companies would depend on the culture of the company many smaller companies do not have a process-driven driven culture so an approach like this could possibly be difficult from a cultural rather than an implementation perspective. Again, from an SME perspective, I3 stated that SPIs such as CMMI are perceived to have a high overhead associated with them and that an approach like the Rosetta Stone shows benefits and would therefore have a higher chance of uptake Question Group 3 The IGSI-ISM CMMI (Staged) Level 2 Mapping While research into a theoretical methodology such as the generic Rosetta Stone Methodology is appropriate from a generic perspective, it was the research on the specific mapping from the IGSI-ISM model to CMMI (Staged) that generated most discussion from the interviewees. As can be seen in Figure 5-2, the questions in Group 4 were focused on 3 specific areas the IGSI-ISM benefits model, the mapping from the model to CMMI (Staged) Level 2, and the prioritization of the mapping implementation. While researching the methodology, interviewees were told that the benefits model presented in the mapping instantiation (the IGSI-ISM model) was only one of a number of possible benefits models. However, as all the interviewees were either employed at one stage at commercial organizations or currently work for commercial organizations, much interest was generated on the IGSI-ISM benefits model. The interviewees universally agreed that the IGSI-ISM model is a very good broad, commercial benefits model. Just over half (9 out of 17) would have accepted the model presented while the remainder thought there might be some minor changes which could be made but they were satisfied that the model met at least 80% of their expectations, given their prior industrial experience. The remainder of the interviewees agreed that any changes they could suggest were organization-specific and would not affect the overall validity of the IGSI-ISM model. In line with the fact that it is a generic model and different benefits models could be used in a mapping instantiation, I5 and I6 suggested that there could be different models for Quality, Cost, and Schedule within an organization. This approach is in line with the PMI s impact triangle (PMI 2004) any change to one of those objectives will impact the other two. With regard to the proposed changes to the IGSI-ISM model, I2 commented that he personally believed that there should be a stronger link between Better Quality Product and Higher Quality Management as well as between Efficient Resource Management and Increased Productivity. In addition Efficient Resource Management impacts more than just Better Risk Management and that there should be direct links between Predictability and Increased Productivity. Both I3 and I17 also suggest that there should be a direct link between Efficient Resource 120
135 Management and Increased Productivity. This is also echoed by I1 who comments that Predictability should be directly affected by Efficient Resource Management as you can t predict what you can do because you don t know what people you have doing it. I17 also states that he believes that there should be a link between Better Product Quality and Setting Customer Expectations. Figure 7-1 shows a modified version of the IGSI-ISM model with the suggested changes incorporated into the model. It should be noted, however, that such changes to the model change only the secondary benefits derived from implementation of certain PAs and do not change in any way the primary benefits of implementation of particular PAs. The next question concerned the mapping from the benefits model to CMMI (Staged) Level 2. Implicit in this is the concept of primary and secondary benefits. Again, interviewees unanimously agreed that the mapping from the IGSI-ISM model was in general an understandable and valid mapping. The only questions that were raised were around the benefits model, not around the mapping from the benefits model to CMMI. I12 stated that it is definitely a good approach but is not a quantitative approach. I3 stated that it was a logical way to arrive at the mapping. I7 in particular liked the concept of primary and derived benefits as it allows you to focus on particular benefits while it also lets you see what benefits you get for free. From a prioritization perspective, everyone agreed that the prioritization approach was very understandable and that it was appropriate to use the CMMI Staged Levels as a natural prioritization mechanism. I4, while agreeing that the initial prioritization rules are valid and well-founded, suggested that in the longer term, as a refinement to the model, a weighting scheme might be put into place that would allow certain process areas to be weighted above others. I13 agreed with the prioritization scheme up to a point and suggested that it might be possible to mix Levels 2 and 3 together while continuing to have a separation between Levels 4 and Question Group 4 The Rosetta Stone Methodology and Meta- Model Everyone agreed that the generic model is valid and makes sense. I17 commented that it is a genuine attempt to associate business drivers with process improvement. I16 stated that the approach is very tangible. I10 liked it very much a definite strength. I1 noted that it was easy to see what you need to do to get results. I14 noted that what I like about the model is that going into it, if you know exactly what you want out of it, it s easy to see what you have to put in place to get it as well as Yes I do [like it] especially in the scenario of. If you do these things then I12 stated that it was Very clear I m familiar with a few generic models and in this one you don t need a PhD to use it and that I like it a lot; I like a step by step approach and that someone can pick it up and 121
136 achieve specific goals, and it can help them [SPI experts] move out of the abstract and into their [the company s] business. Business leaders who control things don t care about specific or generic practices - the care about what it means to their business. I3 stated that I have done it [for customers] based on experience. I don t have a model-based approach. This is actually very interesting. I8 stated that it seems a practical, tangible approach that you can identify with. In order to determine how useful the methodology is, and in order to see if the interviewees thought the methodology was useful, I asked the interviewees if they would consider using the RS-ICCMMI mapping instance in their work. The interviewees unanimously agreed that they would consider using the instance if an appropriate application for it came up. In fact, 6 of the interviewees asked for specific permission to use the instance and/or share it with co-workers for their comments on it Other comments and Future Enhancements From analysis of the interviews, respondents concluded that the methodology and the RS-IMMI mapping instance look reasonable and appear to be well-founded but asked were there any plans to test it out in practice. I13 and I12 would both like some empirical evidence to back the model up but, equally, they recognize that finding such evidence may be difficult, if not impossible. As a result, they suggested that an empirical review might be worthwhile as a next step in the evolution of the RS-ICMMI mapping instance. I15 noted that: I like the Chart on page 10 (IGSI-ISM Model) and page 20 (order PA recommendations, including primary vs. secondary ordering).it just needs to be marketed a bit better. Right now, it looks very engineeringy. Senior management needs to have presented differently from engineeringy. The implication is that while the model is sound, it may benefit from a more business-friendly representation. From a usefulness perspective, I15 noted that the interviewee is frequently asked what particular PA gives you the biggest bang for the buck and that this methodology and mapping instance provides answers. I14 was of the opinion that organizations need a way to determine the most critical things to do and that will depend on the business situation. This methodology and mapping instance are something that could let people and organizations move in that direction and is therefore useful. I5 and I6 believe that many IT people and PMs in particular shy 122
137 away from assigning financial value to IT initiatives. Therefore they would like to see some concrete examples of ROI and have those worked out as templates for IT project managers Summary In summary, 17 people with an average of 19 years industry experience and 11 years SPI experience participated in the expert panel. The interview responses were analyzed and results demonstrate that there doesn t appear to be any similar model or methodology available which allows organizations to drive from a business benefits perspective back to SPI. In addition, they all agreed that the methodology is valid, logical, and, from their experiences, makes sense. On the specific mapping instantiation of the IGSI-ISM model to CMMI (Staged) Level 2, results showed that the mapping and prioritization of the benefits to CMMI Level 2 were understandable, logical, and scientific in their approach. The only area where everyone was not agreed was on the completeness of the IGSI- ISM model, which in any case is an external model outside of the scope of this research. Everyone was agreed, however, that the IGSI-ISM model was a good basis on which to start and which, with some minor changes, could be modified to suit individual organizations. In fact, 9 out of 17 of the interviewees would use the current version of the IGSI-ISM model as it stands. While everyone agreed that they would use this model if they had a need, 6 interviewees, without prompting, asked for more details on the entire CMMI (Staged) mapping and not just the Level 2 mapping which was used in the interview. They also asked for permission to use this approach in their work. The research for this work was achieved using a variety of means my own personal experience, input from colleagues, literature review of general engineering best practices such as code inspections, and literature review of particular SPI methodologies such as CMM/CMMI, ISO-9001, and ISO/IEC Of particular concern to me was the possibility, however remote, that I had left out any other way of researching the benefits of SPI. As a result, and as a means of demonstrating how the research was arrived at, I detailed to the interviewee how I had arrived at the methodology and the mapping instance. As a way of validating this approach, one of the questions I asked was if there was any other way to arrive at this research? I acknowledged that I had tried unsuccessfully to work with companies to perform a study and also, due to the fact that this is a novel approach, it was not possible to find empirical evidence to directly support the model. With the exception of an empirical study (as suggested by I7, I12, and I13), no-one came up with any suggestions other than those methods I discuss in this study. However, these particular interviewees also 123
138 recognize that getting empirical data on this is virtually impossible with I12 stating that no-one has that information. Interviewees offered no further suggestions as to how to get the raw information for the research. As a result, all the interviewees agreed that it was unlikely that the research could be carried out in a different manner. 124
139 6 RS-ICMMI Validation Process 6.1 Introduction Having reviewed the Rosetta Stone Methodology at a high level and subjected both the meta model and the methodology to a validation process, the next phase in the research process was to review and validate the RS-ICMMI model. The objective of this phase of the research process, therefore, was to rigorously evaluate the relationships between the IGSI-ISM Benefits Model and the CMMI Process Areas as defined in the RS-ICMMI mapping between CMMI and the IGSI-ISM Benefits model. This was carried out by interviewing experts on the explicit relationships in the model. In this chapter, I present all the relationships discussed and the reasoning used by the experts during the interviews. In section 6.3 I present an updated model based on the interview results. 6.2 Validation of Process Area/Benefits Mapping For validation, each PA/Benefit combination has been reviewed by 2 separate interviewees (as described in section 3.9). For primary benefits, the expected benefits have been accepted by the interviewees and only one new potential primary benefit has been promoted from the remaining PA/Benefit combinations. The secondary PA/Benefit combinations also went through a validation process, though the results indicate the secondary PA/Benefits combinations are not as compliant with expectations as the primary PA/Benefits mappings. The original mapping has been altered to take the results of the validation process into account and the updated mapping is presented in Section Requirements Management When presented with the REQM relationship, the first interviewee had direct experience of including customers into REQM which had a direct effect on Understanding Customer Needs and also noted that, in his experience, if a customer knows what he wants, then it cuts down on re-work (and thus creating a Lower Time to Market). However, as he has experienced, not many customers know exactly what they want. Based on his experience, he proposed that REQM might possibly have a primary impact on Setting Right Customer Expectations while REQM will definitely lead to a Better Quality Product as a primary benefit. In addition, the second interviewee thought that Higher Customer Satisfaction would be a primary benefit of REQM as he believes in the ability to talk to your clients. Both interviewees thought that an increase in Predictability may possibly 125
140 be a primary benefit of REQM and not merely a secondary benefit. As can be seen in Table 6-1, there is 100% compliance between interviewees experiences and the expected primary benefits for Requirements Management (REQM). Process Area Requirements Management Requirements Management Requirements Management IGSI-ISM Benefit RS- ICMMI Model Interviewee 1 Results Interviewee 2 Results Compliance to RS- ICMMI Better Risk Management (4-2) Y Y Y 100% Understanding Customer Needs (4-4) Y Y Y 100% Lower Time to Market (5-2) Y Y Y 100% Table 6-1: Expected primary benefits of REQM For secondary benefits, on a summary level, of 19 remaining PA/Benefit combinations: 9 combinations are 100% compliant with expectations 6 combinations are 50% compliant 4 combinations are 0% compliant. Both interviewees agreed that REQM definitely has a secondary impact on Increased Productivity. Again, both agreed that REQM has a secondary impact on creating a Better Quality Product with one of them going so far as to say that he would even consider it a primary benefit while both again agreed that REQM has a secondary impact on Skill Development Facilitation By Management. While both interviewees have given their answers based on their experience in practice, one interviewee who used to work for a large, multi-national company provided specific evidence to support the impact on REQM on Retain and Develop Skills and Domain Knowledge. At that company, apparently the company performed a full review of all requirements across products and used this to specialize knowledge of specific parts of the requirements across specific geographic areas, thus allowing them to locate specific skills in particular geographies. He found this to provide a great advantage to them in developing products. 126
141 Process Area IGSI-ISM Benefit RS- ICMMI Model Interviewee 1 Results Interviewee 2 Results Compliance to RS- ICMMI Requirements Management Increased Revenues/Profits Y Y Y 100% Requirements Management Image Y Y Y 100% Requirements Management Higher Customer Satisfaction Y Y Y 100% Requirements Management Market Reach N N N 100% Requirements Management Increased Productivity N Y Y 0% Setting right Customer Expectations N Y N 50% Requirements Management Requirements Management Predictability Y Y Y 100% Requirements Management Requirements Management Requirements Management Requirements Management Requirements Management Requirements Management Competitive Proposals Y N Y 50% Better Quality Product N Y Y 0% Efficient Resource Management Y Y Y 100% Retain & Develop Skills & Domain Knowledge Y Y Y 100% Skill Development Facilitation by Management N Y Y 0% Efficient Information Management N Y N 50% Requirements Management Teaming / Synergize N Y N 50% Requirements Management New Technology N N Y 50% Requirements Management Improved Institutionalization of tools / process / methods N N N 100% Requirements Management Business Focus N N N 100% Requirements Management Market Intelligence Y N N 0% Table 6-2: Other Process Area/Benefit combinations for REQM 127
142 6.2.2 Project Planning Process Area Project Planning Project Planning Project Planning Project Planning Project Planning Project Planning Project Planning IGSI-ISM Benefit RS- ICMMI Model Interviewee 1 Results Interviewee 2 Results Compliance to RS- ICMMI Better Quality Product (4-1) Y Y Y 100% Better Risk Management (4-2) Y Y N 50% Predictability (3-4) Y Y Y 100% Setting Right Customer Expectations (3-3) Y N Y 50% Competitive Proposals (3-5) Y Y Y 100% Efficient Resource Management (4-3) Y Y Y 100% Understanding Customer Needs (4-4) Y N Y 50% Table 6-3: Primary benefits of PP With regard to the impact of PP on Better Risk Management, one interviewee was in agreement with the expected impact while the other was on the borderline and suggested that it might be a strong secondary impact rather than a primary one. According to the interviewee he would have been happy accepting either but, as he was not 100% confident that Better Risk Management is a primary impact of PP, his response was interpreted as not being conformant with expectations. With regard to the impact of PP on Setting Right Customer Expectations, the first interviewee stated that, while he has seen this impact in practice, he felt that it was more a secondary than a primary impact. The impact of PP on Understanding Customer Needs, according to the first interviewee, is not necessarily a primary impact, though he says that he could see why some people might see it as a primary impact. His logic behind his response was that planning will not help unless requirements are correct in the first place. As a result, he feels that PP is of secondary importance to REQM. One interviewee suggested that the impact of PP on Skill Development Facilitation By Management could possibly be a primary impact and not just a secondary impact. His logic for this is that skill analysis and facilitation is often a neglected aspect of PP as many skills are qualitative in nature and not 128
143 quantitative. As a result, many project managers tend to stay away from this aspect of PP in practice but, in theory, they should not do so. Process Area Project Planning IGSI-ISM Benefit RS- ICMMI Model Interviewee 1 Results Interviewee 2 Results Compliance to RS- ICMMI Increased Revenues/Profits Y Y Y 100% Project Planning Image Y Y Y 100% Project Planning Higher Customer Satisfaction Y Y Y 100% Project Planning Market Reach Y Y Y 100% Project Planning Project Planning Project Planning Project Planning Project Planning Project Planning Increased Productivity Y Y Y 100% Retain & Develop Skills & Domain Knowledge N Y N 50% Lower Time to Market N Y N 50% Skill Development Facilitation by Management N N Y 50% Efficient Information Management N N Y 50% Teaming / Synergize N Y N 50% Project Planning New Technology N N N 100% Project Planning Improved Institutionalization of tools / process / methods N N N 100% Project Planning Business Focus N N N 100% Project Planning Market Intelligence N N N 100% Table 6-4: Other Process Area/Benefit combinations of PP In summary, of the 15 remaining PA/Benefit combinations for PP, 9 combinations for 100% compliant, while 6 are 50% compliant. As mentioned in the previous section, one interviewee noted that the impact of PP on Skill Development Facilitation should perhaps be a primary impact. Of the remaining non-compliant answers, one interviewee has seen in practice where PP can have an impact on Retain and Developing Skill but not on domain knowledge. As a result, he argued that there is at least a partial impact of PP on Retain and Develop Skill and 129
144 Domain Knowledge. The same interviewee also argued that PP has an impact on Lower Time to Market as it helps in terms of good estimation and scheduling, therefore allowing projects to deliver on time and not deliver on time otherwise. Another interviewee, who has a background in both small and large organizations, argues that PP has an impact on Efficient Information Management in small organizations as, in small organizations, everyone knows everything and thus PP can allow Efficient Information Management. He does, however, acknowledge this is not the case for large organizations and states that as organizations grow larger the impact of PP becomes less important Project Monitoring and Control Process Area Project Monitoring and Control Project Monitoring and Control Project Monitoring and Control Project Monitoring and Control IGSI-ISM Benefit RS- ICMMI Model Interviewee 1 Results Interviewee 2 Results Compliance to RS- ICMMI Better Quality Product (4-1) Y Y Y 100% Better Risk Management (4-2) Y Y Y 100% Efficient Resource Management (4-3) Y Y Y 100% Setting Right Customer Expectations (3-3) Y Y Y 100% Table 6-5: Primary benefits of PMC Both interviewees are 100% compliant with expectations for PMC. The first interviewee noted that, in his experience, there is definitely a primary impact of PMC on a Better Quality Product because if you don t perform any necessary remediation early, this will impact quality. In addition, he also notes that half of good risk management is within PMC. From the second interviewee s perspective, the impact of PMC on Setting Right Customer Expectations depends on individual organizations as, in many cases, the customer can t often directly see any impact of PMC on their product. In summary, of the 17 Process Area/Benefit combinations for PMC: 12 combinations are 100% compliant 4 combinations are 50% compliant 1 combination is 0% compliant. With regard to the impact of PMC on Retain and Develop Skills and Domain Knowledge, the first interviewee acknowledges that, in theory, the implementation of PMC should lead to Retain and Develop Skills and Domain Knowledge. However, in practice, he says that he has not seen such an impact. The second interviewee acknowledges PMC impacts both Lower Time to Market 130
145 and Efficient Information Management in a weak manner. As discussed earlier, in the event that an interviewee is not 100% sure of an answer, the answer is deemed not to be true. In this case, therefore, as the interviewee was not 100% confident that there is a strong cause and effect relationship between PMC and the 2 benefits in question, it is assumed that there is no relationship and the impact is modelled accordingly. Process Area Project Monitoring and Control IGSI-ISM Benefit RS- ICMMI Model 131 Interviewee 1 Results Interviewee 2 Results Compliance to RS- ICMMI Increased Revenues/Profits Y Y Y 100% Project Monitoring and Control Image Y Y Y 100% Project Monitoring and Control Higher Customer Satisfaction Y Y Y 100% Project Monitoring and Control Market Reach Y Y Y 100% Project Monitoring and Control Project Monitoring and Control Project Monitoring and Control Project Monitoring and Control Project Monitoring and Control Project Monitoring and Control Project Monitoring and Control Project Monitoring and Control Increased Productivity Y Y Y 100% Competitive Proposals N Y Y 0% Understanding Customer Needs N N N 100% Retain & Develop Skills & Domain Knowledge N Y N 50% Lower Time to Market N Y N 50% Skill Development Facilitation by Management N N N 100% Efficient Information Management N Y N 50% Teaming / Synergize N N N 100% Project Monitoring and Control New Technology N N N 100% Project Monitoring and Control Improved Institutionalization of tools / process / methods N N N 100% Project Monitoring and Control Business Focus N N N 100% Project Monitoring and Control Market Intelligence N N N 100% Table 6-6: Other Process Area/Benefit combinations of PMC
146 The RS-ICMMI instance expects PMC to not have any impact on Competitive Proposals. However, both interviewees differ from the instance expectation. The first interviewee notes that he has actually seen a cause and effect relationship in practice Supplier Agreement Management Process Area Supplier Agreement Management Supplier Agreement Management Supplier Agreement Management Supplier Agreement Management RS- ICMMI Model Compliance to RS- ICMMI IGSI-ISM Benefit Interviewee 1 Results Interviewee 2 Results Lower Time To Market (5-2) Y Y Y 100% Better Quality Product (4-1) Y Y Y 100% Better Risk Management (4-2) Y Y Y 100% Predictability (3-4) Y Y Y 100% Table 6-7: Primary benefits of SAM All the interviewees answers are in 100% compliance with the expected impacts of Supplier Agreement Management (SAM). In particular the first interviewee, who worked in a large organization where there were supplier agreements across individual units within the organization, noted that if SAM is put in place there are very few variances from the agreement and this will thus have a very positive effect on many different things. The second interviewee also notes that SAM can help drive things to market and, when it is used, it definitely has a positive impact on many things. In summary, of the 18 Process Area/Benefit combinations for PMC: 13 combinations are 100% compliant 3 combinations are 50% compliant 2 combinations are 0% compliant. There were 3 Process Area/Benefit combinations which were 50% compliant with interviewees experiences. The second interviewee found that there is in fact a cause and effect relationship between SAM and Competitive Proposals. His experience was that, if you do not have SAM in place, it may be an indication that your processes in general are quite loose. This can then have an impact on your ability to produce Competitive Proposals. The same interviewee noted that if the supplier(s) who is/are subject to the SAM provide new technology in particular, then SAM can definitely have an impact on New Technology. However, at the same time, he notes that if the Supplier/SAM does not have anything to do with new technology, then there may not be any impact. The first interviewee merely noted that, in his experience, SAM did not have any effect on Teaming/Synergize. 132
147 Process Area Supplier Agreement Management IGSI-ISM Benefit RS- ICMMI Model Interviewee 1 Results Interviewee 2 Results Compliance to RS- ICMMI Increased Revenues/Profits Y Y Y 100% Supplier Agreement Management Image Y Y Y 100% Supplier Agreement Management Higher Customer Satisfaction Y Y Y 100% Supplier Agreement Management Market Reach Y Y Y 100% Supplier Agreement Management Supplier Agreement Management Supplier Agreement Management Supplier Agreement Management Supplier Agreement Management Supplier Agreement Management Supplier Agreement Management Supplier Agreement Management Supplier Agreement Management Increased Productivity Y Y Y 100% Setting right Customer Expectations Y Y Y 100% Competitive Proposals N N Y 50% Efficient Resource Management N Y Y 0% Understanding Customer Needs N N N 100% Retain & Develop Skills & Domain Knowledge N N N 100% Skill Development Facilitation by Management N N N 100% Efficient Information Management N Y Y 0% Teaming / Synergize N Y N 50% Supplier Agreement Management New Technology N N Y 50% Supplier Agreement Management Improved Institutionalization of tools / process / methods N N N 100% Supplier Agreement Management Business Focus N N N 100% Supplier Agreement Management Market Intelligence N N N 100% Table 6-8: Other Process Area/Benefit combinations of SAM There were 2 Process Area/Benefit combinations which were not in compliance with interviewees experiences. Both interviewees were of the opinion that SAM has an effect on Efficient Resource Management. This was based on the fact that an organization would not enter into a SAM unless there was some resource benefit to it it allowed them to free up their internal resources. In addition, they 133
148 were of the opinion that SAM allowed Efficient Information Management based on the fact that there would have been some agreed-upon Service Level Agreements (SLAs) in the contract, which are in and of themselves information Measurement and Analysis Process Area Measurement and Analysis Measurement and Analysis Measurement and Analysis Measurement and Analysis RS- ICMMI Model Compliance to RS- ICMMI IGSI-ISM Benefit Interviewee 1 Results Interviewee 2 Results Lower Time To Market (5-2) Y Y Y 100% Better Quality Product (4-1) Y Y Y 100% Better Risk Management (4-2) Y Y Y 100% Predictability (3-4) Y Y Y 100% Table 6-9: Primary benefits of MA All the responses for Measurement and Analysis (MA) are 100% compliant with interviewees experiences. With regard to the impact of MA on Better Quality Product, both interviewees had evidence to support their answers. The first interviewee stated that, in his experience, projects that are not measured tend to bow to pressures about release dates while the second interviewee has specific experience that shows when people are aware they re being tracked, they change their mindsets and consequently improve the quality of the product being produced. According to the second interviewee, MA impacts Predictability directly. According to him, he has seen that if you don t have historical data then project planning is more of an art than a science. In summary, of the 18 Process Area/Benefit combinations for MA: 10 combinations are 100% compliant 6 combinations are 50% compliant 2 combinations are 0% compliant. There were 6 Process Area/Benefit combinations which were 50% compliant with interviewees experiences. In stating that there is a positive cause and effect relationship between MA and Competitive Proposals, the second interviewee states that it makes sense because if you measure accurately, you put just the right amount of resources in place and therefore cut down on waste. This then leads to 134
149 competitive proposals. Again according to the second interviewee, there is a positive correlation between MA and Skill Development Facilitation by Management. The reason that the interviewee gives for this is that if accurate measurements are taken of the development process and specific components are buggy, the developers writing the buggy code may be identified and targeted training can then be given to the developers in question. The same interviewee also states that there is a positive correlation between MA and Teaming/Synergize as he saw this effect in a consulting firm he worked for when low-level measurements were being taken on a daily basis. The second interviewee thought that there was a logical positive relationship between MA and New Technology. There were 2 combinations which were 0% compliant with expectations. For the relationship between MA and Market Reach, the second interviewee did not feel competent to answer this question and, in order to be consistent with how weak or inconclusive answers are dealt with, it was deemed that the answer would be deemed to be a no. For the relationship between MA and Improved Institutionalization of Tools/Process/Methods, both interviewees disagreed with expectations. The second interviewee s analysis was that if things are being measured and analysed, issues (if there are any) will be seen. This may in turn lead to institutionalization of new technology or methods in order to solve the issues. 135
150 Process Area Measurement and Analysis IGSI-ISM Benefit RS- ICMMI Model Interviewee 1 Results Interviewee 2 Results Compliance to RS- ICMMI Increased Revenues/Profits Y Y Y 100% Measurement and Analysis Image Y Y Y 100% Measurement and Analysis Higher Customer Satisfaction Y Y Y 100% Measurement and Analysis Market Reach Y N 0% Measurement and Analysis Measurement and Analysis Measurement and Analysis Measurement and Analysis Measurement and Analysis Measurement and Analysis Measurement and Analysis Measurement and Analysis Measurement and Analysis Increased Productivity Y N Y 50% Setting right Customer Expectations Y Y Y 100% Competitive Proposals N N Y 50% Efficient Resource Management N N Y 50% Understanding Customer Needs N N N 100% Retain & Develop Skills & Domain Knowledge N N N 100% Skill Development Facilitation by Management N N Y 50% Efficient Information Management N N N 100% Teaming / Synergize N N Y 50% Measurement and Analysis New Technology N N Y 50% Measurement and Analysis Improved Institutionalization of tools / process / methods N Y Y 0% Measurement and Analysis Business Focus N N N 100% Measurement and Analysis Market Intelligence N N N 100% Table 6-10: Other Process Area/Benefit combinations of MA 136
151 6.2.6 Process and Product Quality Assurance Process Area Process and Product Quality Assurance Process and Product Quality Assurance Process and Product Quality Assurance Process and Product Quality RS- ICMMI Model Interviewee 1 Results Interviewee 2 Results Compliance to RS- ICMMI IGSI-ISM Benefit Improved Institutionalization of tools/process/methods (7-1) Y Y Y 100% Lower Time To Market (5-2) Y Y Y 100% Better Quality Product (4-1) Y Y Y 100% Better Risk Management (4-2) Y Y Y 100% Assurance Process and Product Quality Assurance Predictability (3-4) Y Y Y 100% Table 6-11: Primary benefits of PPQA All the responses for Process and Product Quality Assurance (PPQA) are 100% compliant with interviewees experiences. In particular, the first interviewee believes there is a positive relationship between PPQA and Improved Institutionalization of Tools/Process/Methods because if [PPQA] tools are useful, then they [software professionals] will use them. The second time around, if they find them useful, they will then ask for more [tools]. The same interviewee is also of the opinion that there is a positive relationship between PPQA and Lower Time to Market as most project delays arise from problems at the backend of the project. Anything which can shake things around at the frontend of the project can certainly save time. With regard to the relationship between PPQA and Better Risk Management, evidence of risk management tends to be qualitative and therefore hard to judge objectively and has seen specific evidence that there is a positive relationship between PPQA and Better Risk Management. The second interviewee notes that there is a positive relationship between PPQA and Lower Time to Market but believes that the industry that an organization resides in has some bearing on this relationship. If an organization is to be compared across its peers within a particular industry (who are all subject to the same level of regulation), then the second interviewee believes that there is a positive relationship between PPQA and Lower Time to Market. However, this is not the case if you re comparing between two organizations that are subject to different regulations the organization with the smaller amount of regulation would have a lower time to market than the organization with the higher amount of regulation. 137
152 Process Area Process and Product Quality Assurance IGSI-ISM Benefit RS- ICMMI Model Interviewee 1 Results Interviewee 2 Results Compliance to RS- ICMMI Increased Revenues/Profits Y Y Y 100% Process and Product Quality Assurance Image Y Y Y 100% Process and Product Quality Assurance Higher Customer Satisfaction Y Y Y 100% Process and Product Quality Assurance Market Reach Y Y Y 100% Process and Product Quality Assurance Process and Product Quality Assurance Process and Product Quality Assurance Process and Product Quality Assurance Process and Product Quality Assurance Process and Product Quality Assurance Process and Product Quality Assurance Process and Product Quality Assurance Process and Product Quality Assurance Process and Product Quality Assurance Increased Productivity Y Y Y 100% Setting right Customer Expectations Y Y Y 100% Competitive Proposals N N Y 50% Efficient Resource Management N Y N 50% Understanding Customer Needs N N Y 50% Retain & Develop Skills & Domain Knowledge N N Y 50% Skill Development Facilitation by Management N Y Y 0% Efficient Information Management N Y Y 0% Teaming / Synergize N Y Y 0% New Technology N Y Y 0% Process and Product Quality Assurance Business Focus N N N 100% Process and Product Quality Assurance Market Intelligence N N N 100% Table 6-12: Other Process Area/Benefit combinations of PPQA In summary, of the 17 Process Area/Benefit combinations for PPQA: 8 combinations are 100% compliant 4 combinations are 50% compliant 138
153 5 combinations are 0% compliant. There were 4 combinations which were 50% compliant with interviewees experiences. For the relationship between PPQA and Competitive Proposals, the second interviewee is of the opinion that there is a positive relationship between both. His reasoning behind this is that, especially in a highly regulated environment, if an organization does not implement PPQA, clients may not even accept your bid. In many cases in a highly regulated environment, a proposal can come down to certification and quality a competitive bid is more than just having the right financials compared to your competitors. The second interviewee is also of the opinion that there is a positive relationship between PPQA and PPQA and Retain and Develop Skills and Domain Knowledge because all process involves a build-up of the knowledge base. This knowledge base can then help people move more easily in to a new position. There were 5 combinations which were 0% compliant with expectations. From the interviews, both feel that, while they have no specific evidence and experience in their practices, to support their positions, they feel that logically there is a positive relationship between PPQA and Skill Development Facilitation By Management, Efficient Information Management, Teaming/Synergize, New Technology and Business Focus whereas the model stated that there was no relationship Configuration Management Process Area Configuration Management Configuration Management Configuration Management IGSI-ISM Benefit RS- ICMMI Model Interviewee 1 Results Interviewee 2 Results Compliance to RS- ICMMI Teaming/Synergize (6-3) Y Y Y 100% Better Quality Product (4-1) Y Y Y 100% Better Risk Management (4-2) Y Y Y 100% Table 6-13: Primary benefits of CM All the responses for Configuration Management (CM) are 100% compliant interviewees experiences. The second interviewee had specific evidence on the relationships between CM and Better Quality Product and Better Risk Management. For Better Quality Product, he has seen where teams don t like using configuration management but, unless they do, things fall apart from an efficiency and productivity perspective. With regards to Better Risk 139
154 Management, Configuration Management reduces waste of time and resources. The first interviewee also agrees with the relationship and cites an increase in productivity and an increase in positive communications as a result of implementation, which both act to reduce risk. In summary, of the 18 Process Area/Benefit combinations for CM: 11 combinations are 100% compliant 4 combinations are 50% compliant 3 combination is 0% compliant. There were 4 combinations which were 50% compliant with interviewees experiences. The first interviewee found that there is a positive relationship between CM and Skill Development Facilitation By Management and was of the opinion that the relationship was strong and is not given as much attention as it deserves. The remaining items were the logical opinions of the interviewees and they had no specific evidence to support their assertions. There were 3 combinations which were 0% compliant with expectations. The interviewees could not offer any evidence of their assertions on the cause and effect relationships between CM and Predictability, and Efficient Information Management from either specific experience or general experience in practice. Process Area Configuration Management IGSI-ISM Benefit RS- ICMMI Model 140 Interviewee 1 Results Interviewee 2 Results Compliance to RS- ICMMI Increased Revenues/Profits Y Y Y 100% Configuration Management Image Y Y Y 100% Configuration Management Higher Customer Satisfaction Y Y Y 100% Configuration Management Market Reach Y Y Y 100% Configuration Management Configuration Management Increased Productivity Y Y Y 100% Setting right Customer Expectations Y Y Y 100% Configuration Management Predictability Y Y Y 100% Configuration Management Configuration Management Competitive Proposals N Y Y 0% Efficient Resource Management Y Y Y 100%
155 Process Area Configuration Management Configuration Management Configuration Management Configuration Management RS- ICMMI Model IGSI-ISM Benefit Interviewee 1 Results Interviewee 2 Results Retain & Develop Skills & Domain Knowledge Y Y N 50% Compliance to RS- ICMMI Lower Time to Market Y Y Y 100% Skill Development Facilitation by Management N Y N 50% Efficient Information Management N Y Y 0% Configuration Management New Technology N Y N 50% Configuration Management Improved Institutionalization of tools / process / methods N Y N 50% Configuration Management Business Focus N N N 100% Configuration Management Market Intelligence N N N 100% Table 6-14: Other Process Area/Benefit combinations of CM 6.3 Updated RS-ICMMI Model In summary, according to the model, there were expected to be 31 PA/Benefit combinations which would yield primary benefits. As a result of the interviews, 28 combinations were 100% in compliance with expectations, with a further 3 being 50% compliant with expectations. In addition, there were 4 PA/Benefit combinations which were not defined in the model as having a primary impact but which have been identified through the interviews with experts. Of these 4, only 1 had 100% agreement from the interviewees and is therefore the only one which has been upgraded to a primary impact. From a secondary benefits perspective, according to the model there are a total of 123 PA/Benefit combinations. Of the 123 combinations, 73 are 100% compliant, 33 are 50% compliant, and 15 are 0% compliant. On a strict compliance basis, the model correctly predicted approximately 60% of the potential secondary PA/Benefits. If, on the hand, we give equal weight to the model and each interviewee, that number rises to approximately 87% (73 answers are 100% compliant and 33 are 50% compliant). Based on the feedback from the interviewees, the RS-ICMMI mapping instance was revised. As noted in section 6.2, when a response is 0% compliant with expectations, both interviewees disagree with the initial mapping. In such cases, 141
156 the initial mapping was modified to reflect the opinions of the interviewees. These modifications led to both additions to the mapping as well subtraction from the original mapping. In the cases where, in the original mapping, there was not a link between a Process Area and a Benefit but both interviewees have presented evidence to the contrary, it was added into the mapping. In the cases where, in the original mapping, a link between a Process Area and a Benefit was included but where both interviewees could not present evidence that such a relationship should exist, the mapping was removed. In addition, after the individual mappings were either added or removed from the RS-ICMMI benefits map, a further analysis was performed to either add in or remove any derived benefits. Table 6-15 summarizes the changes while Table 6-16 through to Table 6-22 contain the new, modified mapping. Process Area Benefit Type Action Mapping REQM Primary Addition Predictability (3-4) REQM Secondary Addition Increased Productivity (3-2), Better Quality Product (4-1), Skill Development Facilitation by Management (7-3) REQM Secondary Removal Market Intelligence (7-3) PMC Secondary Addition Competitive Proposals (3-5) SAM Secondary Addition Efficient Resource Management (4-3), Efficient Information Management (6-2) MA Secondary Addition Improved Institutionalization of Process/Tools/Methods (7-1) MA Secondary Removal Market Reach (3-1) PPQA Secondary Addition Efficient Information Management (6-2), Teaming/Synergize (6-3), New Technology (6-4), Skill Development Facilitation by Management (7-3) CM Secondary Addition Competitive Proposals (3-5), Efficient Information Management (6-2) Table 6-15: Summary of post-validation changes to RS-ICMMI mapping Expected Primary Benefits Lower Time to Market (5-2) Better Risk Management (4-2) Understanding Customer Needs (4-4) Predictability (3-4) Expected Secondary Benefits Skill Development Facilitation by Management (6-1) Retain & Develop Skills & Domain Knowledge (5-1) Better Quality Product (4-1) Efficient Resource Management (4-3) Increased Productivity (3-2) Predictability (3-4) Competitive Proposals (3-5) Image (2-1) Higher Customer Satisfaction (2-2) Increased Revenues/Profits (1-1) Table 6-16: Post-validation REQM benefits mapping 142
157 Expected Primary Benefits Better Quality Product (4-1) Better Risk Management (4-2) Efficient Resource Management (4-3) Understanding Customer Needs (4-4) Setting Right Customer Expectations (3-3) Predictability (3-4) Competitive Proposals (3-5) Expected Secondary Benefits Market Reach (3-1) Increased Productivity (3-2) Predictability (3-4) Competitive Proposals (3-5) Image (2-1) Higher Customer Satisfaction (2-2) Increased Revenues/Profits (1-1) Table 6-17: Post-validation PP benefits mapping Expected Primary Benefits Better Quality Product (4-1) Better Risk Management (4-2) Efficient Resource Management (4-3) Setting Right Customer Expectations (3-3) Predictability (3-4) Expected Secondary Benefits Market Reach (3-1) Increased Productivity (3-2) Competitive Proposals (3-5) Image (2-1) Higher Customer Satisfaction (2-2) Increased Revenues/Profits (1-1) Table 6-18: Post-validation PMC benefits mapping Expected Primary Benefits Lower Time To Market (5-2) Better Quality Product (4-1) Better Risk Management (4-2) Predictability (3-4) Expected Secondary Benefits Efficient Information Management (6-2) Retain & Develop Skills and Domain Knowledge (5-1) Efficient Resource Management (4-3) Market Reach (3-1) Increased Productivity (3-2) Setting Right Customer Expectations (3-3) Predictability (3-4) Image (2-1) Higher Customer Satisfaction (2-2) Increased Revenues/Profits (1-1) Table 6-19: Post-validation SAM benefits mapping 143
158 Expected Primary Benefits Lower Time To Market (5-2) Better Quality Product (4-1) Better Risk Management (4-2) Predictability (3-4) Expected Secondary Benefits Table 6-20: Post-validation MA benefits mapping Improved Institutionalization of Tools/Process/Methods (7-1) Skill Development Facilitation by Management (6-1) Efficient Information Management (6-2) Retain & Develop Skills & Domain Knowledge (5-1) Increased Productivity (3-2) Setting Right Customer Expectations (3-3) Predictability (3-4) Image (2-1) Higher Customer Satisfaction (2-2) Increased Revenues/Profits (1-1) Expected Primary Benefits Improved Institutionalization of tools/process/methods (7-1) Lower Time To Market (5-2) Better Quality Product (4-1) Better Risk Management (4-2) Predictability (3-4) Expected Secondary Benefits Skill Development Facilitation by Management (6-1) Effective Information Management (6-2) Teaming/Synergize (6-3) New Technology (6-4) Retain & Develop Skills & Domain Knowledge (5-1) Efficient Resource Management (4-3) Understanding Customer Needs (4-4) Market Reach (3-1) Increased Productivity (3-2) Setting Right Customer Expectations (3-3) Predictability (3-4) Image (2-1) Higher Customer Satisfaction (2-2) Increased Revenues/Profits (1-1) Table 6-21: Post-validation PPQA benefits mapping 144
159 Expected Primary Benefits Teaming/Synergize (6-3) Better Quality Product (4-1) Better Risk Management (4-2) Table 6-22: Post-validation CM benefits mapping Expected Secondary Benefits Efficient Information Management (6-2) Retain & Develop Skills & Domain Knowledge (5-1) Lower Time To Market (5-2) Efficient Resource Management (4-3) Understanding Customer Needs (4-4) Market Reach (3-1) Increased Productivity (3-2) Setting Right Customer Expectations (3-3) Predictability (3-4) Competitive Proposals (3-5) Image (2-1) Higher Customer Satisfaction (2-2) Increased Revenues/Profits (1-1) 6.4 Conclusion As a result of the validation, an updated model of the RS-ICMMI mapping instance is presented. For mappings which were either 100% compliant or 50% with expectations, no change was made to the RS-ICMMI mapping. For those mappings which were 0% compliant with expectations, the mapping was altered to reflect the opinions of the interviewees. This validation was completed for CMMI (Staged) Level 2 only. 145
160 7 Summary and Conclusions 7.1 Introduction This chapter summarizes the main findings of this dissertation, outlines its contribution to the field, and suggests potential areas for future research. To do this, I revisited the Research Objective and the Research Methodology used as well as the process by which the research was conducted. After this, the limitations of the research are reviewed thus placing the next section, Summary of Findings and Conclusions, into context. Finally, while the result of this research is a methodology for a business benefit driven approach to SPI as well as a concrete example of how this methodology can be used in practice, it has also shone the light on potential areas for future research, including some questions which arose as part of the research. These are explored in the section on Opportunities for Future Research. 7.2 Research Question While well-known SPI methodologies exist, e.g. CMMI (SEI 2002a; 2002b; 2006), ISO/IEC (SPICE) (ISO 2004a), ISO (ISO 1994), they are IT-driven in that they aim to improve software processes from a purely IT perspective without any specific drivers that would be considered to be businessdriven such as productivity improvement, minimization of time to market, and maximization of profit. The purpose of this research was to develop and evaluate a generic methodology that allows organizations to achieve specific business-focused objectives by implementing various existing and proven SPIs. While a business-driven approach to SPI is novel and research-worthy in itself, in order for such a model to be successful in the real world it should be flexible enough to be able to support the sometimes vastly different organizational objectives of various types of businesses government organizations, non-government organizations (NGOs), the military, and for-profit commercial companies to name but a few. Not only should it be flexible enough to support these various organization types, but it should also be customizable so that individual organizations are able to customize benefit models. In addition, as an enormous amount of effort has been spent on SPI and SPI research, any proposed model should leverage existing work as much as possible. In order to meet these objectives the Rosetta Stone Methodology was developed which meets all these requirements. It is a generic benefits-driven methodology 146
161 which, in its essence, allows practitioners to map from a benefits model which is appropriate to a particular organization to a proven SPI methodology. In addition, is it fully customizable and allows organizations to make adjustments to the implementation instance where they feel it appropriate. In summary, to quote from Chapter 3, the research objective is: To develop and evaluate a methodology that allows organizations to achieve specific organization-pertinent benefits using existing SPI methodologies and techniques. 7.3 Critical Review of Research Critical Review of Research Approach and Philosophy As discussed in Chapter 3, the research approach to this work is constructionist, interpretivist, and qualitative in nature. For any approach, there are arguments for and against. This is no less true for the constructionist, interpretivist, and qualitative paradigms than for any other paradigm. From an epistemological perspective, constructionism is in direct opposition to positivism. Contructionism holds that there is no single valid methodology and that scientific knowledge is constructed by scientists, not taken from the world. Positivism, on the other hand, holds that affirmation of theories can only come through strict scientific methods quantitative methods. Interpretivism, in loose terms, is the view that one can understand an area by studying what people think about the area. Positivism, as we have seen, is the primary philosophy behind what we in the Western world understand as the scientific method. It involves treating the world as a set of concrete entities with discrete measurements that have cause and effect relationships. While other research frequently builds on top of previous research to further our knowledge, this research is a branch off from previous research and so is quite unlike previous work done in this field. As a result, there is no vast body of knowledge that can be leveraged in order to provide affirmation (or contradiction) of the research. Instead we are forced to rely on people s industrial experiences and background to determine the validity of the research. Not only that, but there is a limited amount of people who can provide this input for various reasons. Therefore while the research presented in this thesis does not follow a positivist/quantitative philosophy, the approach followed qualitative research guidelines and therefore the results presented can be recognized as valid. 147
162 7.3.2 Critical Review of Research Contribution Central to any research work is the establishment of the trustworthiness or validity of the report itself. Lincoln and Guba (1985) suggest four questions which can be used to evaluate the trustworthiness of a report: 1. Truth Value can the report we relied upon to provide the truth in relation to the findings of the report in the context of the research? 2. Applicability to what extent are the findings generalizable and applicable to other contexts? 3. Consistency to what extent would another report produce the same results? 4. Neutrality to what extent is the report absent of bias (intentional or otherwise), interests, or perspectives of the person writing the report? Within the context of this thesis two distinct phases of research were undertaken research of the validity and applicability of the Rosetta Stone Methodology and the validation of the mapping of the RS-ICMMI. In order to arrive at a balanced, critical review of the research process for this thesis, including threats to the validity of the work, both phases will be evaluated individually in relation to the questions posed by Lincoln and Guba. Critical Review of the Validation of the Rosetta Stone Methodology The research process for the validation of the Rosetta Stone Methodology may be summarized as being interpretivist in nature, using an expert panel to analyse the validity of the proposed methodology. The interviews were then analysed using content analysis techniques. The expert panel members came primarily from three disparate sources IT professionals who have used CMMI extensively; peers in various organizations which practice some form of SPI; and several academics who have a professional and academic interest in SPI. Based on these sources, it could be argued that many of the interviewees have an in-built bias in favour of SPI. As the proposed methodology is quite different from other methodologies which have been proposed, there was very little basis on which to ask the members to compare one methodology against another. As a result, many of the questions were purposefully open-ended, allowing them to provide answers which could provide more depth and insight than if closed-ended questions were asked. Due to the open-ended nature of the answers, widely-used content analysis techniques were employed to analyse the results. While there were several panel members who admitted to either working or having worked in organizations where there was scepticism of SPI, many of the panel members had an in-built positive disposition towards SPI. As a result, from a truth value perspective, criticism could be levelled at the research that there may 148
163 be an in-built bias towards the positive aspects of SPI. However, this is also reflected in the literature where there are relatively fewer negative SPI articles than positive ones. As this is a general methodology, it should have a high level of applicability. From a consistency perspective, as a lot of the questions posed to the panel members were open ended there is no guarantee that, given the same interview at a different time, there would not be a different answer. That is not to say, however, that the answers panel members gave in the interviews were incorrect or misleading it might just be that, given a different stimulus from whatever source, the answer might be taken down a different path. It is extremely difficult for humans to be totally neutral in their thoughts and ideas everyone has their own built-in biases which they may not even be aware of. However, in an attempt to avoid this problem, the interviews were all pre-scripted, recorded, and analysed consistently so, within the context of what was actually asked, the results of the interviews are expected to be neutral. Critical Review of the Validation of RS-ICMMI The research process for the validation of the RS-ICMMI mapping consisted of a set of very tightly scripted mapping questions and, for each mapping question, an open ended question where the interviewee was asked if he or she had any particular evidence to support the mapping question. The results were then analyzed empirically. Again, as was the case for the validation phase of the Rosetta Stone Methodology, the population of members of the expert panel came from a group of professionals who, in many cases, would be expected to be biased in favour of SPI. As a result, from a truth value perspective, criticism could also be levelled at this phase of the research that there may be an in-built bias towards the positive aspects of SPI. The RS-ICMMI mapping is a specific application of the generic Rosetta Stone Methodology. In particular, it depends heavily on the IGSI-ISM benefits model. As a result, a possible criticism of the RS-ICMMI mapping is that, because it is closely coupled the IGSI-ISM benefits model, it could be seen to lack generalizability. With regard to consistency, while there was a substantial number of experts in the expert panel available for the research, due to the large volume of questions which needed to be answered, each mapping was put to only two expert panel members. From a statistical analysis perspective, larger populations samples tend to provide a more accurate reflection of the domain being studied and an extension of the study would increase the consistency of the result. With regard to neutrality, as the mapping questions were binary in nature, and not as open-ended as in the first phase, this phase of the research would seem to be more neutral than the previous phase. 149
164 7.3.3 Other Limitations This research is primarily focused on the creation of a methodology to support business-driven SPI, as well as one particular instance of that mapping using CMMI and the IGSI-ISM benefits model. As a result of this narrow focus, there are several other remaining interesting research areas which could be addressed in future research in order to increase the generalizability of the work. These areas are addressed in section 7.5. However, probably the main limitation of this research is the fact that the RS-ICMMI mapping has not been used in industry to verify that it works as anticipated. While there are legitimate reasons why it has not been implemented and these have been discussed earlier, the ultimate proof of its validity would be the implementation of it in practice to achieve specific business objectives. 7.4 Summary of Findings and Contribution The Rosetta Stone Methodology and an implementation instance of the methodology, the RS-ICMMI implementation instance, are presented in this work. Through a literature review, it was established that no business-driven SPI methodology was readily available. The Rosetta Stone Methodology and the RS- ICMMI mapping instance was then developed using a literature review, GQM, and an informal review by fellow professionals by combining an existing business objectives model, the IGSI-ISM benefits model, and CMMI. To validate the Rosetta Stone Methodology, a series of expert panel interviews was carried out with SPI experts. The response to the methodology has been positive with many of the interviewees expressing interest in potentially using the approach discussed in this thesis. The meta-model and methodology was universally approved by the interviewees without negative comment, while the only major comments on the IGSI-ISM benefits model to CMMI (Staged) mapping were on possible customizations to the IGSI-ISM benefits model, which is in any case catered for by the model itself. The RS-ICMMI mapping instance was validated using an expert panel and relevant changes were made to the mapping as a result of the validation process. Literature and potential methodologies/models in the chosen area are quite sparse. As we shall see in the next section, this whole area is ripe for research and commercial exploitation. That is not to say, however, that the methodology developed for this dissertation is perfect and is readily usable by practitioners; in fact, far from it. To date no organization has implemented either the methodology or the RS-ICMMI mapping instance and, while intellectually the methodology may appear to make sense, there is potentially a very large gap between a theoretical methodology and a practical (and useful) implementation of that methodology. 150
165 7.5 Opportunities for Future Research The entire area of an organization-driven objectives approach to SPI is novel and, as a result, has not been explored to any degree. Consequently, there are many opportunities for future research. As with the methodology itself, the opportunities for future research can be characterized along the lines of those opportunities which result from open questions or clarifications on the generic methodology and open questions or clarifications arising from the mapping from the IGSI-ISM benefits model to CMMI (Staged) Opportunities for Future Research Rosetta Stone Methodology The Rosetta Stone Methodology allows an arbitrary benefits/objectives model to be mapped to an arbitrary SPI methodology. As a demonstration of this, a mapping was developed between a benefits model developed by IBM in India and CMMI (Staged). As IBM is a commercial organization and the division in question was a consulting services organization, the focus on the benefits was primarily on commercial benefits with a bias towards consulting services. There are many other different types of organization NGOs, military, and government organizations to name but a few which each have their own organizational drivers. It is highly unlikely that these organizations would have the same drivers as the IGSI-ISM model so the whole area of developing generic objective/driver models for these organizations would be of tremendous interest to them, especially if the IGSI-ISM to CMMI mapping is undertaken by a commercial organization and proves to be of benefit. Another area for potential future research is on the IGSI-ISM model itself and to perhaps incorporate changes to the model. Indeed, as noted in section 5.4.3, some minor changes to the model were suggested by the participants in the interview process and these changes have been incorporated in Figure
166 Figure 7-1: Modified IGSI-ISM model In a similar vein, one of the interviewees in the expert panel interviews suggested a model based on the Project Management Triangle: Figure 7-2: Project Management Triangle The idea would be to have one benefits model for each of the constraints Cost, Scope, and Schedule. As this is a generic project management constraint model, it could potentially be used by organizations, primarily software houses, whose main business is in software development. This would not obviously address operational issues such as support of existing systems. 152
167 As we have seen in Chapter 2, CMM/CMMI has gone through a gradual evolution from the original CMM (SW) implementation which was a staged model through to the generic CMMI model which is now available in either a Staged or a Continuous model. Concurrently, the ISO/IEC model has been developed and is continuous in nature. In addition, it seems that a continuous approach offers a lot more flexibility than the traditional staged models. It would not be unexpected, therefore, that future evolutions of CMMI will move more and more towards a continuous approach, up to the point where it is conceivable that a staged approach may in fact be totally dropped from their offerings. While it may be useful to explore various other SPI methodologies from a generic methodology perspective, I would suggest that the next one to be mapped should be the CMMI (Continuous) model Opportunities for Future Research RS-ICMMI mapping Many of the areas for potential future research within the concrete demonstration mapping arise from the limitations already described within the research methodology and the results of the expert panel interviews. The first, and probably most critical, area for future research based on the mapping would be to implement it within a commercially focused organization who could easily customize (if required) the IGSI-ISM benefits/objectives model to their own organization. The successful implementation of the mapping would prove to usefulness of this approach. Failing a full implementation, a limitedscope implementation would be the next-best thing, again helping to demonstrate the usefulness of the Rosetta Stone Methodology. In addition, as this work validated the RS-ICMMI mapping for CMMI (Staged) Level 2 only, it may be worthwhile to validate the remaining CMMI Levels 3, 4, and Conclusion This research set out to both develop and evaluate a business-driven approach to SPI. As a result, a new methodology and a new instance mapping were developed the Rosetta Stone Methodology and the concrete RS-ICMMI model which maps from the IGSI-ISM business-focused benefits model to the CMMI (Staged) SPI model. Both the methodology and the instance mapping were then reviewed and evaluated by a set of experts in both the software life cycle and SPI. Based on their evaluation, both the methodology and the instance mapping constitute a valid and practical approach to a business-driven approach to SPI. As a result, both primary objectives of this research have been successfully accomplished. 153
168 References. "Manifesto for Agile Software Development." from Abrahamsson, P. (2001). Commitment Development in Software Process Improvement: Critical Misconceptions. 23rd International Conference on Software Engineering (ICSE'01), Toronto, Canada. Ahern, D. M., A. Clouse, et al. (2001). CMMI distilled : a practical introduction to integrated process improvement. Boston, Addison-Wesley. Akao, Y. (1990). QFD: Quality Function Deployment - Integrating Customer Requirements into Product Design, Productivity Press. Anderson, D. J. (2005). Stretching Agile to fit CMMI Level 3. AGILE 2005: Antill, L. (1985). Selection of a Research Method. Research methods in information systems. E. Mumford, R. Hirschheim, G. Fitzgerald and A. T. Wood-Harper, North-Holland Publishing Co. April, A. and F. Coallier (1995). Trillium: A Model for the Assessment of Telecom Software System Development and Maintenance Capability. IEEE Software Engineering Standards Symposium, Montreal, Quebec, Canada, IEEE. Ashrafi, N. (2003). "The impact of software process improvement on quality: in theory and practice." Information & Management 40(7): Avison, D. (1998). "Rigour in Action Research: Some Observations and a Plea." Scandanavian Journal of Information Systems 10(1-2): Baker, S. W. (2005). Formalizing agility: an agile organization's journey toward CMMI accreditation. AGILE 2005: Baker, S. W. (2006). Formalizing Agility part 2: how an agile organization embraced the CMMI. AGILE 2006: 8 pp Basili, V. (1992). Software Modeling and Measurement: The Goal/Question/Metric Paradigm, University of Maryland. Basili, V., G. Caldiera, et al. (1994). The Goal Question Metric Approach. Encyclopedia of Software Engineering. J. J. Marciniak, John Wiley & Sons Inc. 1. Basili, V. and S. Green (1994). "Software Process Evolution at the SEL." IEEE Software. Basili, V. and H. D. Rombach (1988). "The TAME Project: Towards Improvement-Oriented Software Environments." IEEE Transactions on Software Engineering SE-14(6): Basili, V. and D. M. Weiss (1984). "A Methodology for Collecting Valid Software Engineering Data." IEEE Transactions on Software Engineering SE-10(6):
169 Beecham, S. (2003). A Requirements-based Software Process Maturity Model. Department of Computer Science, University of Hertfordshire. PhD. Beecham, S., T. Hall, et al. (2005). "Using an expert panel to validate a requirements process improvement model." The Journal of Systems and Software 76(3): Beer, M., R. A. Eisenstat, et al. (1990). "Why Change Programs Don't Produce Change." Harvard Business Review 68(6): Blanco, M., P. Gutierrez, et al. (2001). "SPI Patterns: Learning from Experience." 18 3(May/June 2001): Boehm, B. (1981). Software Engineering Economics, Prentice-Hall. Boehm, B. (1998). "A Spiral Model of Software Development and Enhancement." IEEE Computer 21(5): Boehm, B., C. Abts, et al. (2000). Software Cost Estimation With COCOMO II, Prentice- Hall. Bollinger, T. B. and C. McGowan (1991). "A cricital look at software capability evaluations." IEEE Software 8(4): Brigham, E. F. and L. C. Gapenski (1994). Financial Management - Theory and Practice, Dryden Press. Brodman, J. G. and D. L. Johnson (1995). "Return on Investment (ROI) from Software Process Improvement as Measured by US Industry." Software Process: Improvement and Practice 1(1): Brodman, J. G. and D. L. Johnson (1996a). "Realities and Rewards of Software Process Improvement." IEEE Software 13(6): Brodman, J. G. and D. L. Johnson (1996b). "Return on Investment from Software Process Improvement as Measured by U.S. Industry." CrossTalk - The Journal of Defense Software Engineering(April). Brooks, F. P. (1995). The Mythical Man-Month, Addison Wesley Longman. Bruckhaus, T., N. H. Madhavji, et al. (1996). "The Impact of Tools on Software Productivity." IEEE Software 13(5): Buchman, C. D. (1996). Software Process Improvement at Allied Aerospace. 29th Annual International Conference on System Sciences, Hawaii, IEEE. Buckley, J. W. (1976). Research Methodology and Business Decisions, Institute of Management Accountants. 155
170 Burton, J., I. Richardson, et al. (2009). The Medical Device Industry: Developments in Software Risk Management, Cambridge Scholars Publishing. Burzcuk, S. P. and B. Appleton (2002). Software Configuration Management Patterns: Effective Teamwork, Practical Integration, Addison Wesley. Butler, K. L. (1995). "The Economic Benefits of Software Process Improvement." CrossTalk - The Journal of Defense Software Engineering 1995(July). Butler, K. L. and W. Lipke (2000). Software Process Achievement at Tinker Air force Base, Oklahma, Software Engineering Institute: 58. Buzan, T. (2006). The MindMap Book, BBC Active. Choudrie, J. and Y. K. Dwivedi (2005). "Investigating the Research Approaches for Examining Technology Adoption Issues." Journal of Research Practice 1(1): Chrissis, M. B., M. Konrad, et al. (2003). CMMI : Guidelines for Process Integration and Product Improvement. Boston, Addison-Wesley. Christensen, M. J. and R. H. Thayer (2001). The Project Manager's Guide to Software Engineering's Best Practices, IEEE Computer Society. Clark, B. K. (1997). The Effects of Software Process Maturity on Software Development Effort. Department of Computer Science, University of Southern California. Clark, B. K. (1999). Effects of Process Maturity on Development Effort, Center for Software Engineering, University of Southern California: 9. Clark, B. K. (2000). "Quantifying the Effects of Process Improvement on Effort." IEEE Software 17(6): Using a 161-project sample, this article isolates the effects on effort of process maturity versus other effects, concluding that an increase of one process maturity level can reduce development effort by 4% to 11% Clover, V. T. and H. L. Balsley (1984). Business Research Methods, John Wiley & Sons, Inc. CMMI Product Team (2002). Capability Maturity Model Integration Version 1.1, Software Engineering Institute. Coallier, F. (1994). "Trillium Reference Manual." from Coallier, F. (1995). "Trillium: A Model for the Assessment of Telecom Product Development & Support Capability." Software Process Newsletter 2(Winter 1995): 3-8. Coallier, F. (2003). Trillium Update. F. McLoughlin. Concise Oxford English Dictionary (2008). Concise Oxford English Dictionary, Oxford University Press. 156
171 Cooper, D. R. and P. S. Schindler (2008). Business Research Methods, McGraw-Hill Higher Education. Cornford, T. and S. Smithson (2005). Project Research in Information Systems, Palgrave Macmillan. Creswell, J. W. (2007). Qualitative Inquiry and Research Design: Choosing Among Five Traditions, Sage Publications, Inc. Dalmaris, P., E. Tsui, et al. (2007). "A framework for the improvement of knowledgeintensive business processes." Business Process Management 13(3): Damij, N., T. Damij, et al. (2008). "A methodology for business process improvement and IS development." Information and Software Technology 50(11): Davenport, T. H. and J. E. Short (1990). "The New Industrial Engineering: Information Technology and Business Process Redesign." Sloan Management Review 31(4). Davis, A. M., E. H. Bersoff, et al. (1988). "A Strategy for Comparing Alternative Software Development Lifecycle Models." IEEE Transactions on Software Engineering 14(10): Debou, C. and A. Kuntzmann-Combelles (2000). "Linking Software Process Improvement to Business Strategies: Experiences from Industry." Software Process: Improvement and Practice 5(1): Diaz, M. and J. Sligo (1997). "How Software Process Improvement Helped Motorola." IEEE Software 14(5): Dion, R. (1992). "Elements of a Process-Improvement Program." IEEE Software 9(4): Dion, R. (1993). Process Improvement and the Corporate Balance Sheet. IEEE Software. 10: Djikstra, E. (1979). Go to statement considered harmful. Classics in Software Engineering, Yourdon Press: Doolan, E. P. (1992). "Experience with Fagan's Inspection Method." Software - Practice and Experience 22(2): Dyba, T. (2000). "An Instrument for Measuring the Key Factors of Success in Software Process Improvement." Empirical Software Engineering 5(4): Dyba, T. (2005). "An Empirical Investigation of the Key Factors for Success in Software Process Improvement." IEEE Transactions on Software Engineering 31(5): El Emam, K. and L. Briand (1997). Cost and Benefits of Software Process Improvement, Fraunhofer IESE:
172 El Emam, K. and N. H. Madhavi (1996a). "Does Organizational Maturity Improve Quality?" IEEE Software 13(6): El Emam, K. and N. H. Madhavi (1996b). "User Participation in the Requirements Engineering Process: an Empirical Study." Requirements Engineering Journal 1(1): Fagan, M. E. (1976). "Design and Code inspections to reduce errors in program development." IBM Systems Journal 15(3): Fagan, M. E. (1986). "Advances in Software Inspections." IEEE Transactions on Software Engineering 12(7): Fantina, R. (2005). Practical Software Process Improvement Artech House. Fayad, M. E. and M. Laitinen (1997). "Process Assessment Considered Wasteful." Communications of the ACM 40(11): Ferguson, P., G. Leman, et al. (1999). Software Process Improvement Works!, Software Engineering Institute. Fitzgerald, B. (1997). Methodology-in-Action: The Nature of Usage of Systems Development Methodologies in Practice. Department of Computer Science, Birbeck College. London, University of London. Ph.D. Fitzgerald, B. and D. Howcroft (1998). Competing dichotomies in IS research and possible strategies for resolution. Proceedings of the international conference on Information systems. Helsinki, Finland, Association for Information Systems. Galin, D. and M. Avrahami (2006). "Are CMM Program Investments Beneficial? Analyzing Past Studies." IEEE Software 23(6): Galliers, R. (1992). Information Systems Research : Issues, Methods and Practical Guidelines, Blackwell Sci. Galliers, R. D. and F. Land, F. (1987). "Viewpoint: choosing appropriate information systems research methodologies." Communications of the ACM 30(11): Garmus, D. and D. Herron (2001). Function Point Analysis - Measurement Practices for Successful Software Projects, Addison-Wesley. Garmus, D. and S. Iwanicki (2007). "Improved Performance Should Be Expected from Process Improvement." Software Tech News 10(1): Glazer, H., J. Dalton, et al. (2008). CMMI or Agile: Why Not Embrace Both!, Software Engineering Institute. Glesne, C. and A. Peshkin (1991). Becoming Qualitative Researchers: An Introduction Pearson Education Ltd. 158
173 Goldenson, D. R. and D. L. Gibson (2003a). Demonstrating the Impact and Benefits of CMMI: An Update and Preliminary Results, Software Engineering Institute, Carnegie- Mellon University. Goldenson, D. R. and D. L. Gibson (2003b). Demonstrating the Impact and Benefits of CMMI :An Update and Preliminary Results, The Software Engineering Institute: 55. Goyal, A., S. Kanungo, et al. (2001). ROI for SPI: Lessons from Initiatives at IBM Global Services India. SEPG Grady, R. B. (1992). Practical Software Metrics for Project Management and Process Improvement, Prentice Hall. Grady, R. B. (1997). Successful Software Process Improvement, Prentice Hall. Grady, R. B. and D. L. Caswell (1987). Software Metrics: Establishing a Company-wide Program, Prentice Hall. Gray, E. M. and W. L. Smith (1998). "On the limitations of software process assessment and the recognition of a required re-orientation for global process improvement." Software Quality Journal 7(1): Hailey, V. A. (2001). ISO 9001: A Tool for Systematic Software Process Improvement. Software Process Improvement. R. Hunter and R. H. thayer, IEEE Computer Society: Hakim, C. (1987). Research Design: Strategies and Choices in the Design of Social Research, Routledge. Halstead, M. H. (1977). Elements of Software Science, Elsevier. Hammer, M. (1990). "Reengineering work: don't automated, obliterate." Harvard Business Review 68(4): Hammer, M. and J. Champy (1990). Reengineering the Corporation: A Manifesto for Business Revoluation, Harper Paperbacks. Harter, D. and S. Slaughter (2003). "Quality Improvement and Infrastructure Activity Costs in Software Development: A Longitudinal Analysis." Management Science 49(6): Hayashi, A. and N. Kataoka (2008). A Method to Identify Critical Software Process Improvement Area using Quality Function Deployment International Conferences on Computational Intelligence for Modelling, Control and Automation; Intelligent Agents, Web Technologies and Internet Commerce; and Innovation in Software Engineering: Herbsleb, J., A. Carleton, et al. (1994a). Benefits of CMM-Based Software Process Improvement: Executive Summary of Results, Software Engineering Institute: 16. Herbsleb, J., A. Carleton, et al. (1994b). Benefits of CMM-Based Software Process Improvement: Initial Results, Software Engineering Institute, Carnegie-Mellon University. 159
174 Herbsleb, J. and D. R. Goldenson (1995). After the Appraisal: A Systematic Survey of Process Improvement, its Benefits, and Factors the Influence Success, Software Engineering Institute. Herbsleb, J. and D. R. Goldenson (1996). A systematic survey of CMM experience and results. 18th International Conference on Software Engineering (ICSE'96), Berlin, Germany, IEEE. Herbsleb, J., D. Zubrow, et al. (1997). "Software Quality and the Capability Maturity Model." Communications of the ACM 40(6): Higgins, R. C. (1998). Analysis for Financial Management, Irwin/McGraw-Hill. Hinley, D. S. and S. Reiblein (1995). A goal-oriented approach for managing software process change. Software Quality Management III Vol 1 Quality Management. C. A. Brebbia, Witpress: Hirschheim, R. (1985). Information Systems Epistemology: A Historical Perspective. Research Methods In Information Systems. E. Mumford, R. Hirschheim, G. Fitzgerald and A. T. Wood-Harper, North-Holland Publishing Co. Houston, D. and J. B. Keats. (1996). "Cost of Software Quality: A Means of Promoting Software Process Improvement." from Humphrey, W. S. (1987). Characterizing the Software Process: A Maturity Framework CMU/SEI-87-TR-11, The Software Engineering Institute. Humphrey, W. S. (1988). "Characterizing the Software Process: A Maturity Framework." IEEE Software 5(2): Humphrey, W. S. (1989). Managing the Software Process, Addison Wesley. Humphrey, W. S., T. R. Snyder, et al. (1991). "Software Process Improvement at Hughes Aircraft." IEEE Software 8(4): Hyde, K. and D. Wilson (2004). "Intangible Benefits of CMM-based Software Process Improvement." Software Process Improvement and Practice 9(4): IEEE/EIA (1996). IEEE/EIA Standard Industry Implementation of International Standard ISO/IEC12207:1995 and (ISO/IEC 12207) Standard for Information Technology Software life cycle processes. IEEE/EIA IEEE/EIA (1998). Industry implementation of International Standard ISO/IEC 12207: )(ISO/IEC standard for information technology - software life cycle processes - implementation considerations). Iivari, J. (1991). "A paradigmatic analysis of contemporary schools of IS development." European Journal of Information Systems 1(1):
175 International Standards Organization (1994). ISO , International Standards Organization. International Standards Organization (2000). ISO 9001:2000, International Standards Organization. International Standards Organization (2003). "ISO/IEC :2003 Information technology - Process assessment - Part 2: Performing an assessment." International Standards Organization (2004). "ISO/IEC :2004 Information Technology - Process assessment - Part 1: Concepts and voabulary." International Standards Organization (2006). "ISO/IEC :2006 Information technology - Process assessment - Part 5: An exemplar Process Assessment Model." International Standards Organization (2008). "ISO/IEC 12207: Systems and software engineering - Software life cycle processes." ISACA (2007). COBIT 4.1. ISO (1994). ISO , International Standards Organization. ISO (2000). ISO 9001:2000, International Standards Organization. ISO (2003). "ISO/IEC :2003 Information technology - Process assessment - Part 2: Performing an assessment." ISO (2004a). "ISO/IEC :2004 Information Technology - Process assessment - Part 1: Concepts and voabulary." ISO (2004b). "ISO/IEC :2004 Information technology - Process assessment - Part 3: Guidance on performing an assessment." ISO (2004c). "ISO/IEC :2004 Information Technology - Process assessment - Part 4: Guidance on use for process improvement and process capability determination." ISO (2006). "ISO/IEC :2006 Information technology - Process assessment - Part 5: An exemplar Process Assessment Model." Jackson, M. A. (1975). Principles of Programme Design, Academic Press Inc. Jakobsen, C. R. and K. A. Johnson (2008). Mature Agile with a twist of CMMI. AGILE 2008: Jenkins, A. M. (1985). "Research Methodologies and MIS Research." Research Methods in Information Systems, Elsevier Science Publishers B.V. (North Holland): Jones, C. (1986). Programming Productivity, McGraw-Hill. Jones, C. (1991). Applied Software Measurement, McGraw-Hill. 161
176 Jones, C. (2008). Applied Software Measurement: Global Analysis of Productivity and Quality, McGraw-Hill Osborne. Kan, S. K. (2003). Metrics and Models in Software Quality Engineering, Addison-Wesley. Kaplan, A. (1964). The Conduct of Inquiry: Methodology for Behavioral Science, Chandler Publishing Co.. Kaplan, B. and D. Duchon (1988). "Combining qualitative and quantitative methods information systems research: a case study"." Manage. Inf. Syst. Q. 12(4): King, J. and M. Diaz (2002). "How CMM Impacts Quality, Productivity, Rework, and the Bottom Line." CrossTalk - The Journal of Defense Software Engineering(March 2002). Kitchenham, B., S. L. Pfleeger, et al. (2002). "An Empirical Study of Maintenance and Development Estimation Accuracy." The Journal of Systems and Software 64(1): Kitson, D. H., L. J. Kitson, et al. (2006). A compliant CMMI-based Appraisal Producing and 9001-related Outcomes. Proceedings of the 6th International SPICE Conference on Process Assessment and Improvement. Klein, H., K. and M. D. Myers (1999). "A Set of Principles for Conducting and Evaluating Interpretive Field Studies in Information Systems." MIS Quarterly 23(1): Kolakowski, L. (1972). Positivist Science, Penguin Books: Harmondsworth. Konrad, M. and S. Shrum (2001). CMM Integration: Enterprise-Wide Process Improvement Using the Next Generation of CMMs. Software Process Improvement. R. Hunter and R. H. Thayer: Krasner, H. (1995). A Case History of Process Improvements at the NASA Software Engineering Laboratory. Krasner, H., J. Pyles, et al. (1994). A Case History of the Space Shuttle Onboard Systems Project. Kuhn, T. S. (1996). The Structure of Scientific Revolutions, University of Chicago Press. Larman, C. and V. Basili (2003). "Iterative and incremental developments. a brief history." IEEE Computer 36(6): Lauesen, S. and O. Vinter (2001). "Preventing Requirement Defects: An Experiment in Process Improvement " Requirements Engineering 6(1): Lawlis, P. K., R. M. Flowe, et al. (1995). "A Correlational Study of the CMM and Software Development Performance." CrossTalk - The Journal of Defense Software Engineering(September). 162
177 Lee, A. S. (1991). "Integrating Positivist and Interpretive Approaches to Organizational Research." Organization Science 2(4): Lim, W. C. (1994). "Effects of Reuse on Quality, Productivity, and Economics." IEEE Software 11(5): Lincoln, Y. and E. A. Guba (1985). Naturalistic Inquiry, Sage Publications, Inc. Liu, A. Q. (2007). "Motorola Software Group's China Center: Value Added by CMMI." Software Tech News 10(1): Liu, X. F., Y. Sun, et al. (2006). "Business-oriented Software Process Improvement Based on CMM using QFD." Software Process Improvement and Practice 11(6): Macdonald, J. (1997). "Together TQM and BPR are winners." TQM Magazine 7(3): MacKenzie, B. D. (1977). Behaviourism and the Limits of Scientific Methods, Humanities Press. Mandeville, W. A. (1990). "Software Costs of Quality." IEEE Journal on Selected Areas in Communications 8(2): McCabe, T. J. (1976). "A Complexity Measure." IEEE Transactions on Software Engineering 2(4): McCaffery, F. and A. Dorling (2009). "Medi SPICE development." Software Process: Improvement and Practice: n/a. McGarry, F., R. Pajerski, et al. (1994). Software Process Improvement in the NASA Software Engineering Laboratory, Software Engineering Institute. McLoone, P. J. and S. L. Rohde (2007). "Performance Outcomes of CMMI-Based Process Improvements." Software Tech News 10(1): 5-9. Miles, M. B. and A. M. Huberman (1994). Qualitative Data Analysis - An Expanded Sourcebook, Sage Publications Inc. Mingers, J. (2003). "The paucity of multi-method research: a review of the information systems literature." Information Systems Journal 13: Moody, D. L. (2000). Building links between IS research and professional practice: improving the relevance and impact of IS research. Proceedings of the twenty first international conference on Information systems. Brisbane, Queensland, Australia, Association for Information Systems. Nogueira, J. C., Luqi, et al. (2000). A Formal Risk Assessment Model for Software Evolution. Proceedings of the 22nd International Conference on Software Engineering (ICSE 2000), Limerick, Ireland. 163
178 O'Neill, D. (2003). "Determining Return on Investment Using Software Inspections." CrossTalk - The Journal of Defense Software Engineering. OECD (2008). OECD.Stat Database, OECD. Office of Government Commerce (2007). ITIL Lifecycle Publication Suite: Service Strategy WITH Service Design AND Service Transition AND Service Operation AND Continual Service Improvement, Stationery Office Books. OGC (2005). Managing Successful Projects with PRINCE2. OGC (2007a). ITIL Lifecycle Publication Suite: Service Strategy WITH Service Design AND Service Transition AND Service Operation AND Continual Service Improvement, Stationery Office Books. OGC (2007b). ITIL Service Lifecycle (Official Introduction), Stationery Office Books. Oldham, L. G., D. B. Putnam, et al. (1999). "Benefits Realized from Climbing the CMM Ladder." CrossTalk - The Journal of Defense Software Engineering. Omran, A. (2008). AGILE CMMI from SMEs perspective. ICTTA 2008: 1-8 Organization for Economic Co-Operation and Development (2006). OECD Information Technology Outlook, 2006, OECD. Orlikowski, W. J. and J. J. Baroudi (1991). "Studying Information Technology in Organizations: Research Approaches and Assumptions." Information Systems Research 2(1): Parnas, D. L. and P. C. Clements (1986). "A Rational Design Process: How and Why to Fake It." IEEE Transactions on Software Engineering SE-12(2): Patton, M. Q. (2001). Qualitative Research & Evaluation Methods, Sage Publications. Paulk, M. C., B. Curtis, et al. (1993). Capability Maturity Model for Software, Version 1.1, Software Engineering Institute. Paulk, M. C., C. V. Weber, et al. (1995). The Capability Maturity Model - Guidelines for Improving the Software Process, Addison-Wesley. Pennington, H. D. (1956). Production of Large Compuer Programs. ONR Symposium Advanced Programming Methods for Digial Computers. Phillips, J. J. (1997). Return On Investment in Training and Performance Improvement Programs, Gulf Publishing Company. Pino, F. J., M. T. Baldassarre, et al. (2009). "Harmonizing Maturity Levels from CMMI-DEV and ISO/IEC " Software Process Improvement and Practice 22(4): PMI (2004). Project Management Book Of Knowledge. 164
179 Povey, B. (1998). "The development of a best practice business process improvement methodology." Benchmarking for Quality Management & Technology 5(1): Pressman, R. (1996). "Software Process Impediment." IEEE Software 13(5): Putnam, L. H. and W. Myers (1997). "How Solved is the Cost Estimation Problem." IEEE Software 14(6): Reiblein, S. and A. Symons (1997). "SPI: 'I can't get no satisfaction' - directing process improvement to meet business needs." Software Quality Journal 6(2): Remus, U. and S. Schub (2003). "A Blueprint for the Implementation of Process-oriented Knowledge Management." Knowledge and Process Management 10(4): Robeson, D., S. Davidson, et al. (1997). "Evolution of a Software Engineering Factory." CrossTalk - The Journal of Defense Software Engineering September 1997(1997). Rosqvist, T., M. Koskela, et al. (2003). "Software Quality Evaluation Based on Expert Judgement." Software Quality Journal 11(1): Ross, S. A., R. W. Westerfield, et al. (1999). Corporate Finance, Irwin/McGraw-Hill. Rout, T. P. (1998). SPICE and the CMM: is the CMM compatible with ISO/IEC 15504? AQUIS (International Conference on Achieving Quality In Software), Venice, Italy. Rout, T. P. (2003). "ISO/IEC Evolution to an International Standard." Software Process Improvement and Practice 8(1): Rout, T. P. and A. Tuffley (2007). "Harmonizing ISO/IEC and CMMI." Software Process Improvement and Practice 12(4): Royce, W. (1970). Managing the Development of Large Software Systems. IEEE Wescon, IEEE. Royce, W. (2002). CMM vs. CMMI: From Conventional to Modern Software Management. The Rational Edge E-zine, Rational Software. Rubin, H. A. (1993). Software Process Maturity: Measuring Its Impact on Productivity and Quality. International Conference on Software Engineering. Saaty, T. L. (1980). The Analytic Hierarchy Process, McGraw-Hill. Sapp, M., R. Stoddard, et al. (2007). "Cost, Schedule and Quality Improvements at Warner Robins Air Logistics Center." Software Tech News 10(1): Schmidt, M. E. C. (2000). Implementing the IEEE Software Engineering Standards, SAMS. SEI (2002a). CMMI for Software Engineering, Version 1.1, Continuous Representation (CMMI-SW, V1.1, Continuous) - CMU/SEI-2002-TR
180 SEI (2002b). CMMI for Software Engineering, Version 1.1, Staged Representation (CMMI- SW, V1.1, Staged) - CMU/SEI-2002-TR-029. SEI (2002c). CMMI for Systems Engineering/Software Engineering/Integrated Product and Process Development/Supplier Sourcing, Version 1.1, Continuous Representation (CMMI- SE/SW/IPPD/SS, V1.1, Continuous), Software Engineering Institute, Carnegie Mellon University: 724. SEI (2002d). CMMI for Systems Engineering/Software Engineering/Integrated Product and Process Development/Supplier Sourcing, Version 1.1, Staged Representation (CMMI- SE/SW/IPPD/SS, V1.1, Staged), Software Engineering Institute, Carnegie Mellon University: 729. SEI. (2005). "CMMI Performance Results " Retrieved 07/12/2008, 2008, from SEI (2006). CMMI for Development Version 1.2, SEI. Shaikh, A., A. Ahmed, et al. (2009). Strengths and Weaknesses of Maturity Driven Process Improvement Effort International Conference on Complex, Intelligent and Software Intensive Systems, Fukuoka, Japan. Sheard, S. A. (1997). "The Frameworks Quagmire." CrossTalk - The Journal of Defense Software Engineering 10(9): Shepperd, M. and M. Cartwright (2001). "Predicting with Sparse Data." IEEE Transactions on Software Engineering 27(11): Silverman, D. (1998). "Qualitative research: meanings or practices?" Information Systems Journal 8(1): Silverman, D. (2006). Interpreting Qualitative Data: Methods for Analyzing Talk, Text and Interaction, Sage Publications Ltd. Slowey, K. and I. Richardson (2006). A Practical Application of Content Analysis, Lero - the Irish Software Research Center. Solon, R., Jr. and J. Statz (2002). "Benchmarking the ROI for Software Process Improvement (SPI)." Software Tech News 5(4): Sommerville, I. (2004). Software Engineering, Addison Wesley. Sommerville, I. (2007). Software Engineering, Addison Wesley. Stone, E. F. (1978). Research Methods in Organizational Behavior, Goodyear Publishing. Sun, Y. and X. F. Liu (2010). "Business-oriented software process improvement based on CMMI using QFD." Information and Software Technology 52(1):
181 Sutherland, J., C. R. Jakobsen, et al. (2007). Scrum and CMMI Level 5: The Magic Potion for Code Warriors. AGILE 2007: Tantara Consulting Services Inc. (2001). "History and relationship of process standards/models." from Tockey, S. (2004). Return on Software: Maximizing the Return on Your Software Investment, Addison Wesley. Valiris, G. and M. Glykas (1999). "Critical review of existing BPR methodologies - the need for a holistic approach." Business Process Management 5(1): van Loon, H. (2007). Process Assessment and ISO/IEC A Reference Book, Springer. van Solingen, R. (2004). "Measuring the ROI of Software Process Improvement." IEEE Software 21(3): Vogel, D., R. and J. Wetherbe, C. (1984). "MIS research: a profile of leading journals and universities." ACM SIGMIS Database 16(1): Webster, W. A. R. (1973). Handbook of O. & M analysis, London Business Books. Williams, L. and A. Cockburn (2003). "Agile software development: it's about feedback and change." IEEE Computer 36(6): Wohlwend, H. and S. Rosenbaum (1994). "Schlumberger's Software Improvement Program." IEEE Transactions on Software Engineering 20(11): Yamamura, G. and G. B. Wigle (1997). "SEI CMM Level 5: For the Right Reasons." CrossTalk - The Journal of Defense Software Engineering(August 1997). Zahran, S. (1996). Business and Cost Justification of Software Process Improvement - "ROI from SPI". International Software Process Association Conference, Brighton, England. 167
182 Appendixes 168
183 Appendix A Full CMMI (Staged) to IGSI-ISM Mapping Level 2 Mapping Process Area Expected Primary Benefits Expected Secondary Benefits Requirements Management Better Risk Management (4-2) Market Intelligence (7-3) Requirements Understanding Customer Needs Retain & Develop Skills & Domain Management (4-4) Knowledge (5-1) Requirements Management Lower Time to Marker (5-2) Efficient Resource Management (4-3) Requirements Management Predictability (3-4) Requirements Management Competitive Proposals (3-5) Requirements Management Image (2-1) Requirements Management Higher Customer Satisfaction (2-2) Requirements Management Increased Revenues/Profits (1-1) Process Area Expected Primary Benefits Expected Secondary Benefits Project Planning Better Quality Product (4-1) Market Reach (3-1) Project Planning Better Risk Management (4-2) Increased Productivity (3-2) Project Planning Predictability (3-4) Predictability (3-4) Setting Right Customer Project Planning Expectations (3-3) Competitive Proposals (3-5) Project Planning Competitive Proposals (3-5) Image (2-1) Project Planning Efficient Resource Management (4-3) Higher Customer Satisfaction (2-2) Project Planning Understanding Customer Needs (4-4) Increased Revenues/Profits (1-1) Process Area Expected Primary Benefits Expected Secondary Benefits Project Monitoring and Control Better Quality Product (4-1) Market Reach (3-1) Project Monitoring and Control Better Risk Management (4-2) Increased Productivity (3-2) Project Monitoring and Control Efficient Resource Management (4-3) Image (2-1) Project Monitoring and Setting Right Customer Control Expectations (3-3) Higher Customer Satisfaction (2-2) Project Monitoring and Control Predictability (3-4) Increased Revenues/Profits (1-1) 169
184 Process Area Expected Primary Benefits Expected Secondary Benefits Supplier Agreement Management Lower Time To Market (5-2) Market Reach (3-1) Supplier Agreement Management Better Quality Product (4-1) Increased Productivity (3-2) Supplier Agreement Management Better Risk Management (4-2) Setting Right Customer Expectations (3-3) Supplier Agreement Management Predictability (3-4) Predictability (3-4) Supplier Agreement Management Image (2-1) Supplier Agreement Management Higher Customer Satisfaction (2-2) Supplier Agreement Management Increased Revenues/Profits (1-1) Process Area Expected Primary Benefits Expected Secondary Benefits Measurement and Analysis Lower Time To Market (5-2) Market Reach (3-1) Measurement and Analysis Better Quality Product (4-1) Increased Productivity (3-2) Measurement and Analysis Better Risk Management (4-2) Setting Right Customer Expectations (3-3) Measurement and Analysis Predictability (3-4) Predictability (3-4) Measurement and Analysis Image (2-1) Measurement and Analysis Higher Customer Satisfaction (2-2) Measurement and Analysis Increased Revenues/Profits (1-1) 170
185 Process Area Expected Primary Benefits Expected Secondary Benefits Process and Product Improved Institutionalization of Skill development facilitation by management Quality Assurance tools/process/methods (7-1) (6-1) Process and Product Quality Assurance Process and Product Quality Assurance Process and Product Quality Assurance Process and Product Quality Assurance Process and Product Quality Assurance Process and Product Quality Assurance Process and Product Quality Assurance Process and Product Quality Assurance Process and Product Quality Assurance Process and Product Quality Assurance Process and Product Quality Assurance Process and Product Quality Assurance Lower Time To Market (5-2) Effecitive Information Management (6-2) Better Quality Product (4-1) Teaming/Synergize (6-3) Better Risk Management (4-2) Retain & Develop Skills & Domain Knowledge (5-1) Predictability (3-4) Efficient Resource Management (4-3) Understanding Customer Needs (4-4) Market Reach (3-1) Increased Productivity (3-2) Setting Right Customer Expectations (3-3) Predictability (3-4) Image (2-1) Higher Customer Satisfaction (2-2) Increased Revenues/Profits (1-1) 171
186 Process Area Expected Primary Benefits Expected Secondary Benefits Configuration Teaming/Synergize (6-3) Retain & Develop Skills & Domain Management Knowledge (5-1) Configuration Better Quality Product (4-1) Lower Time To Market (5-2) Management Configuration Better Risk Management (4-2) Efficient Resource Management (4-3) Management Configuration Understanding Customer Needs (4-4) Management Configuration Market Reach (3-1) Management Configuration Increased Productivity (3-2) Management Configuration Setting Right Customer Expectations (3-3) Management Configuration Predictability (3-4) Management Configuration Image (2-1) Management Configuration Higher Customer Satisfaction (2-2) Management Configuration Management Increased Revenues/Profits (1-1) 172
187 Level 3 Mapping Process Area Expected Benefits Expected Secondary Benefits Requirements Development Lower Time To Market (5-2) Efficient Resource Management (4-3) Requirements Development Better Quality Product (4-1) Market Reach (3-1) Requirements Development Better Risk Management (4-2) Increased Productivity (3-2) Understanding Customer Needs (4-4) Setting Right Customer Requirements Development Expectations (3-3) Requirements Development Predictability (3-4) Requirements Development Competitive Proposals (3-5) Requirements Development Image (2-1) Higher Customer Satisfaction (2- Requirements Development 2) Requirements Development Increased Revenues/Profits (1-1) Improved Institutionalization of Skill development facilitation by Process Area tools/process/methods (7-1) Management (6-1) Effective Information Organizational Process Focus Business Focus (7-2) Management (6-2) Organizational Process Focus Market Intelligence (7-3) Teaming / Synergize (6-3) Organizational Process Focus New Technology (6-4) Retain & Develop Skills & Organizational Process Focus Domain Knowledge (5-1) Organizational Process Focus Lower Time to Market (5-2) Organizational Process Focus Better Quality Product (4-1) Organizational Process Focus Better Risk Management (4-2) Efficient Resource Management Organizational Process Focus (4-3) Understanding Customer Needs Organizational Process Focus (4-4) Organizational Process Focus Market Reach (3-1) Organizational Process Focus Increased Productivity (3-2) Setting Right Customer Organizational Process Focus Expectations (3-3) Organizational Process Focus Predictability (3-4) Organizational Process Focus Competitive Proposals (3-5) Organizational Process Focus Image (2-1) Higher Customer Satisfaction (2- Organizational Process Focus 2) Increased Revenues / Profits (1- Organizational Process Focus 1) 173
188 Process Area Expected Primary Benefits Expected Secondary Benefits Organizational Process Improved Institutionalization of Skill development facilitation by Definition tools/process/methods (7-1) Management (6-1) Organizational Process Definition Effective Information Management (6-2) Teaming / Synergize (6-3) Organizational Process Retain & Develop Skills & Definition Domain Knowledge (5-1) Organizational Process Definition Lower Time to Market (5-2) Organizational Process Definition Better Quality Product (4-1) Organizational Process Definition Better Risk Management (4-2) Organizational Process Efficient Resource Management Definition (4-3) Organizational Process Understanding Customer Needs (4- Definition 4) Organizational Process Definition Market Reach (3-1) Organizational Process Definition Increased Productivity (3-2) Organizational Process Setting Right Customer Definition Expectations (3-3) Organizational Process Definition Predictability (3-4) Organizational Process Definition Competitive Proposals (3-5) Organizational Process Definition Image (2-1) Organizational Process Definition Higher Customer Satisfaction (2-2) Organizational Process Definition Increased Revenues / Profits (1-1) 174
189 Process Area Expected Primary Benefits Expected Secondary Benefits Skill development facilitation by Retain & Develop Skills & Organizational Training Management (6-1) Domain Knowledge (5-1) Organizational Training Teaming / Synergize (6-3) Lower Time to Market (5-2) Organizational Training Better Quality Product (4-1) Organizational Training Better Risk Management (4-2) Efficient Resource Management Organizational Training (4-3) Understanding Customer Needs (4- Organizational Training 4) Organizational Training Market Reach (3-1) Organizational Training Increased Productivity (3-2) Setting Right Customer Organizational Training Expectations (3-3) Organizational Training Predictability (3-4) Organizational Training Competitive Proposals (3-5) Organizational Training Image (2-1) Organizational Training Higher Customer Satisfaction (2-2) Organizational Training Increased Revenues / Profits (1-1) 175
190 Process Area Expected Primary Benefits Expected Secondary Benefits Technical Solution Better Quality Product (4-1) Market Reach (3-1) Technical Solution Better Risk Management (4-2) Increased Productivity (3-2) Setting Right Customer Technical Solution Efficient Resource Management (4-3) Expectations (3-3) Technical Solution Understanding Customer Needs (4-4) Predictability (3-4) Technical Solution Competitive Proposals (3-5) Technical Solution Image (2-1) Technical Solution Higher Customer Satisfaction (2-2) Technical Solution Increased Revenues / Profits (1-1) Process Area Expected Primary Benefits Expected Secondary Benefits Integrated Project Retain & Develop Skills & Management for IPPD Teaming / Synergize (6-3) Domain Knowledge (5-1) Integrated Project Management for IPPD Better Quality Product (4-1) Lower Time to Market (5-2) Integrated Project Management for IPPD Better Risk Management (4-2) Market Reach (3-1) Integrated Project Management for IPPD Efficient Resource Management (4-3) Increased Productivity (3-2) Integrated Project Setting Right Customer Management for IPPD Understanding Customer Needs (4-4) Expectations (3-3) Integrated Project Management for IPPD Predictability (3-4) Integrated Project Management for IPPD Competitive Proposals (3-5) Integrated Project Management for IPPD Image (2-1) Integrated Project Management for IPPD Higher Customer Satisfaction (2-2) Integrated Project Management for IPPD Increased Revenues / Profits (1-1) 176
191 Process Area Expected Primary Benefits Expected Secondary Benefits Retain & Develop Skills & Integrated Teaming Effective Information Management (6-2) Domain Knowledge (5-1) Integrated Teaming Teaming / Synergize (6-3) Lower Time to Market (5-2) Integrated Teaming Better Quality Product (4-1) Market Reach (3-1) Integrated Teaming Better Risk Management (4-2) Increased Productivity (3-2) Setting Right Customer Integrated Teaming Efficient Resource Management (4-3) Expectations (3-3) Integrated Teaming Understanding Customer Needs (4-4) Predictability (3-4) Integrated Teaming Competitive Proposals (3-5) Integrated Teaming Image (2-1) Integrated Teaming Higher Customer Satisfaction (2-2) Integrated Teaming Increased Revenues / Profits (1-1) Process Area Expected Primary Benefits Expected Secondary Benefits Integrated Supplier Retain & Develop Skills & Management Business Focus (7-2) Domain Knowledge (5-1) Integrated Supplier Management Market Intelligence (7-3) Lower Time to Market (5-2) Integrated Supplier Efficient Resource Management Management Teaming / Synergize (6-3) (4-3) Integrated Supplier Management New Technology (6-4) Market Reach (3-1) Integrated Supplier Management Lower Time to Market (5-2) Increased Productivity (3-2) Integrated Supplier Setting Right Customer Management Better Quality Product (4-1) Expectations (3-3) Integrated Supplier Management Better Risk Management (4-2) Competitive Proposals (3-5) Integrated Supplier Management Predictability (3-4) Image (2-1) Integrated Supplier Management Higher Customer Satisfaction (2-2) Integrated Supplier Management Increased Revenues / Profits (1-1) 177
192 Process Area Expected Primary Benefits Expected Secondary Benefits Organizational Environment Improved Institutionalization of Skill development facilitation by for Integration tools/process/methods (7-1) Management (6-1) Organizational Environment for Integration Business Focus (7-2) New Technology (6-4) Organizational Environment Retain & Develop Skills & for Integration Effective Information Management (6-2) Domain Knowledge (5-1) Organizational Environment for Integration Teaming / Synergize (6-3) Lower Time to Market (5-2) Organizational Environment for Integration Lower Time to Market (5-2) Better Quality Product (4-1) Organizational Environment for Integration Better Risk Management (4-2) Organizational Environment for Integration Efficient Resource Management (4-3) Organizational Environment for Integration Understanding Customer Needs (4-4) Organizational Environment for Integration Market Reach (3-1) Organizational Environment for Integration Increased Productivity (3-2) Organizational Environment Setting Right Customer for Integration Expectations (3-3) Organizational Environment for Integration Predictability (3-4) Organizational Environment for Integration Competitive Proposals (3-5) Organizational Environment for Integration Image (2-1) Organizational Environment for Integration Higher Customer Satisfaction (2-2) Organizational Environment for Integration Increased Revenues / Profits (1-1) 178
193 Process Area Expected Primary Benefits Expected Secondary Benefits Product Integration Better Quality Product (4-1) Market Reach (3-1) Product Integration Better Risk Management (4-2) Increased Productivity (3-2) Setting Right Customer Product Integration Expectations (3-3) Product Integration Predictability (3-4) Product Integration Competitive Proposals (3-5) Product Integration Image (2-1) Product Integration Higher Customer Satisfaction (2-2) Product Integration Increased Revenues / Profits (1-1) Process Area Expected Primary Benefits Expected Secondary Benefits Verification Better Quality Product (4-1) Market Reach (3-1) Verification Better Risk Management (4-2) Increased Productivity (3-2) Setting Right Customer Verification Expectations (3-3) Verification Predictability (3-4) Verification Competitive Proposals (3-5) Verification Image (2-1) Verification Higher Customer Satisfaction (2-2) Verification Increased Revenues / Profits (1-1) 179
194 Process Area Expected Primary Benefits Expected Secondary Benefits Validation Better Quality Product (4-1) Market Reach (3-1) Validation Better Risk Management (4-2) Increased Productivity (3-2) Setting Right Customer Validation Expectations (3-3) Validation Predictability (3-4) Validation Competitive Proposals (3-5) Validation Image (2-1) Validation Higher Customer Satisfaction (2-2) Validation Increased Revenues / Profits (1-1) Process Area Expected Primary Benefits Expected Secondary Benefits Risk Management Better Quality Product (4-1) Market Reach (3-1) Risk Management Better Risk Management (4-2) Increased Productivity (3-2) Setting Right Customer Risk Management Expectations (3-3) Risk Management Predictability (3-4) Risk Management Competitive Proposals (3-5) Risk Management Image (2-1) Risk Management Higher Customer Satisfaction (2-2) Risk Management Increased Revenues / Profits (1-1) Process Area Expected Primary Benefits Expected Secondary Benefits Decision Analysis and Efficient Resource Management Resolution Better Quality Product (4-1) (4-3) Decision Analysis and Resolution Better Risk Management (4-2) Market Reach (3-1) Decision Analysis and Resolution Understanding Customer Needs (4-4) Increased Productivity (3-2) Decision Analysis and Setting Right Customer Resolution Expectations (3-3) Decision Analysis and Resolution Predictability (3-4) Decision Analysis and Resolution Competitive Proposals (3-5) Decision Analysis and Resolution Image (2-1) Decision Analysis and Resolution Higher Customer Satisfaction (2-2) Decision Analysis and Resolution Increased Revenues / Profits (1-1) 180
195 Level 4 Mapping Process Area Expected Primary Benefits Expected Secondary Benefits Organizational Performance Organizational Performance Organizational Performance Organizational Performance Organizational Performance Organizational Performance Organizational Performance Organizational Performance Organizational Performance Organizational Performance Organizational Performance Organizational Performance Organizational Performance Organizational Performance Organizational Performance Organizational Performance Organizational Performance Organizational Performance Process Process Process Process Process Process Process Process Process Process Process Process Process Process Process Process Process Process Improved Institutionalization of tools/process/methods (7-1) Skill development facilitation by Management (6-1) Business Focus (7-2) Effective Information Management (6-2) Market Intelligence (7-3) Teaming / Synergize (6-3) New Technology (6-4) Retain & Develop Skills & Domain Knowledge (5-1) Lower Time to Market (5-2) Better Quality Product (4-1) Better Risk Management (4-2) Efficient Resource Management (4-3) Understanding Customer Needs (4-4) Market Reach (3-1) Increased Productivity (3-2) Setting Right Customer Expectations (3-3) Predictability (3-4) Competitive Proposals (3-5) Image (2-1) Higher Customer Satisfaction (2-2) Increased Revenues / Profits (1-1) 181
196 Process Area Expected Primary Benefits Expected Secondary Benefits Quantitative Project Lower Time to Market (5-2) Efficient Resource Management (4-3) Management Quantitative Project Better Quality Product (4-1) Understanding Customer Needs (4-4) Management Quantitative Project Better Risk Management (4-2) Market Reach (3-1) Management Quantitative Project Efficient Resource Increased Productivity (3-2) Management Management (4-3) Quantitative Project Setting Right Customer Expectations (3-3) Management Quantitative Project Predictability (3-4) Management Quantitative Project Competitive Proposals (3-5) Management Quantitative Project Image (2-1) Management Quantitative Project Higher Customer Satisfaction (2-2) Management Quantitative Project Increased Revenues / Profits (1-1) Management 182
197 Level 5 Mapping Process Area Expected Primary Benefits Expected Secondary Benefits Organizational Innovation and Deployment Organizational Innovation and Deployment Organizational Innovation and Deployment Organizational Innovation and Deployment Organizational Innovation and Deployment Organizational Innovation and Deployment Organizational Innovation and Deployment Organizational Innovation and Deployment Organizational Innovation and Deployment Organizational Innovation and Deployment Organizational Innovation and Deployment Organizational Innovation and Deployment Organizational Innovation and Deployment Organizational Innovation and Deployment Organizational Innovation and Deployment Organizational Innovation and Deployment Organizational Innovation and Deployment Organizational Innovation and Deployment Improved Institutionalization of tools/process/methods (7-1) Skill development facilitation by Management (6-1) Business Focus (7-2) Effective Information Management (6-2) Market Intelligence (7-3) Teaming / Synergize (6-3) New Technology (6-4) Retain & Develop Skills & Domain Knowledge (5-1) Lower Time to Market (5-2) Better Quality Product (4-1) Better Risk Management (4-2) Efficient Resource Management (4-3) Understanding Customer Needs (4-4) Market Reach (3-1) Increased Productivity (3-2) Setting Right Customer Expectations (3-3) Predictability (3-4) Competitive Proposals (3-5) Image (2-1) Higher Customer Satisfaction (2-2) Increased Revenues / Profits (1-1) 183
198 Process Area Expected Primary Benefits Expected Secondary Benefits Causal Analysis and Resolution Improved Institutionalization of tools/process/methods (7-1) Skill development facilitation by Management (6-1) Causal Analysis and Resolution Effective Information Teaming / Synergize (6-3) Management (6-2) Causal Analysis and Resolution Lower Time to Market (5-2) Retain & Develop Skills & Domain Knowledge (5-1) Causal Analysis and Resolution Better Quality Product (4-1) Understanding Customer Needs (4-4) Causal Analysis and Resolution Better Risk Management (4-2) Market Reach (3-1) Causal Analysis and Resolution Efficient Resource Increased Productivity (3-2) Management (4-3) Causal Analysis and Resolution Setting Right Customer Expectations (3-3) Causal Analysis and Resolution Predictability (3-4) Causal Analysis and Resolution Competitive Proposals (3-5) Causal Analysis and Resolution Image (2-1) Causal Analysis and Resolution Higher Customer Satisfaction (2-2) Causal Analysis and Resolution Increased Revenues / Profits (1-1) 184
199 Appendix B (Final) Post-validation Level 2 Mapping Summary of post-validation changes to RS-ICMMI mapping Process Area Benefit Type Action Mapping REQM Primary Addition Predictability (3-4) REQM Secondary Addition Increased Productivity (3-2), Better Quality Product (4-1), Skill Development Facilitation by Management (7-3) REQM Secondary Removal Market Intelligence (7-3) PMC Secondary Addition Competitive Proposals (3-5) SAM Secondary Addition Efficient Resource Management (4-3), Efficient Information Management (6-2) MA Secondary Addition Improved Institutionalization of Process/Tools/Methods (7-1) MA Secondary Removal Market Reach (3-1) PPQA Secondary Addition Efficient Information Management (6-2), Teaming/Synergize (6-3), New Technology (6-4), Skill Development Facilitation by Management (7-3) CM Secondary Addition Competitive Proposals (3-5), Efficient Information Management (6-2) Expected Primary Benefits Lower Time to Market (5-2) Better Risk Management (4-2) Understanding Customer Needs (4-4) Predictability (3-4) Post-validation REQM benefits mapping Expected Secondary Benefits Skill Development Facilitation by Management (6-1) Retain & Develop Skills & Domain Knowledge (5-1) Better Quality Product (4-1) Efficient Resource Management (4-3) Increased Productivity (3-2) Predictability (3-4) Competitive Proposals (3-5) Image (2-1) Higher Customer Satisfaction (2-2) Increased Revenues/Profits (1-1) 185
200 Expected Primary Benefits Better Quality Product (4-1) Better Risk Management (4-2) Efficient Resource Management (4-3) Understanding Customer Needs (4-4) Setting Right Customer Expectations (3-3) Predictability (3-4) Competitive Proposals (3-5) Post-validation PP benefits mapping Expected Secondary Benefits Market Reach (3-1) Increased Productivity (3-2) Predictability (3-4) Competitive Proposals (3-5) Image (2-1) Higher Customer Satisfaction (2-2) Increased Revenues/Profits (1-1) Post-validation PMC benefits mapping Expected Primary Benefits Expected Secondary Benefits Better Quality Product (4-1) Better Risk Management (4-2) Efficient Resource Management (4-3) Setting Right Customer Expectations (3-3) Predictability (3-4) Market Reach (3-1) Increased Productivity (3-2) Competitive Proposals (3-5) Image (2-1) Higher Customer Satisfaction (2-2) Increased Revenues/Profits (1-1) Post-validation SAM benefits mapping Expected Primary Benefits Expected Secondary Benefits Lower Time To Market (5-2) Better Quality Product (4-1) Better Risk Management (4-2) Predictability (3-4) Efficient Information Management (6-2) Retain & Develop Skills and Domain Knowledge (5-1) Efficient Resource Management (4-3) Market Reach (3-1) Increased Productivity (3-2) Setting Right Customer Expectations (3-3) Predictability (3-4) Image (2-1) Higher Customer Satisfaction (2-2) Increased Revenues/Profits (1-1) 186
201 Expected Primary Benefits Lower Time To Market (5-2) Better Quality Product (4-1) Better Risk Management (4-2) Predictability (3-4) Post-validation MA benefits mapping Expected Secondary Benefits Improved Institutionalization of Tools/Process/Methods (7-1) Skill Development Facilitation by Management (6-1) Efficient Information Management (6-2) Retain & Develop Skills & Domain Knowledge (5-1) Increased Productivity (3-2) Setting Right Customer Expectations (3-3) Predictability (3-4) Image (2-1) Higher Customer Satisfaction (2-2) Increased Revenues/Profits (1-1) Post-validation PPQA benefits mapping Expected Primary Benefits Expected Secondary Benefits Improved Institutionalization of tools/process/methods (7-1) Lower Time To Market (5-2) Better Quality Product (4-1) Better Risk Management (4-2) Predictability (3-4) Skill Development Facilitation by Management (6-1) Effective Information Management (6-2) Teaming/Synergize (6-3) New Technology (6-4) Retain & Develop Skills & Domain Knowledge (5-1) Efficient Resource Management (4-3) Understanding Customer Needs (4-4) Market Reach (3-1) Increased Productivity (3-2) Setting Right Customer Expectations (3-3) Predictability (3-4) Image (2-1) Higher Customer Satisfaction (2-2) Increased Revenues/Profits (1-1) 187
202 Post-validation CM benefits mapping Expected Primary Benefits Expected Secondary Benefits Teaming/Synergize (6-3) Better Quality Product (4-1) Better Risk Management (4-2) Efficient Information Management (6-2) Retain & Develop Skills & Domain Knowledge (5-1) Lower Time To Market (5-2) Efficient Resource Management (4-3) Understanding Customer Needs (4-4) Market Reach (3-1) Increased Productivity (3-2) Setting Right Customer Expectations (3-3) Predictability (3-4) Competitive Proposals (3-5) Image (2-1) Higher Customer Satisfaction (2-2) Increased Revenues/Profits (1-1) 188
203 Appendix C Rosetta Stone Methodology Expert Panel Biographies Swaraj Bhattacharia Swaraj Bhattacharia currently works for a leading Indian software consulting firm which he has requested not be named. He has over 11 years experience in the software industry, of which 7 have involved working directly in CMM/.CMMI. He is currently responsible for ensuring that staff within his company are following the agreed CMMI-based lifecycle framework and are compliant with CMMI. He has also worked on ISO9000 projects. Al Chatmon Al is currently employed in Northrop Grumman Electronics Systems and has over 20 years experience in Software Process Improvement. Al has published several papers on the benefits in Software Process Improvement. Gillian Corkery Gillian Corkery has over 6 years experience in Fidelity Investments where she was involved in several CMM Level 2 projects and holds a B.Sc. in Computer Science from University College Cork and. Aldo Dagnino Aldo has over 9 years experience in Software Process Improvement and works for ABB (US) where he is responsible for all US-based software improvement activities using CMMI. Aldo is also an Adjunct Professor of Computer Science at North Carolina State University. He holds a Ph.D. from the University of Waterloo in Canada in Systems Engineering. Pete Dittmar Pete Dittmar is currently employed at Northrop Grumman Electronics Systems and has over 10 years experience in software process improvement. His background is in project management and finance. 189
204 Michael Doyle Michael has 15 years work experience in various companies including Ericsson Telecoms GSM & 3G divisions and Motorola (Ireland). Both companies are CMM Level 2 and Level 5 respectively and Michael has managed projects within the divisions that are CMM Level 2 and 5 compliant. Michael Doyle holds a B.Eng. in Electronic Engineering from the University of Limerick and an M.B.A. from the Smurfit Business School, University College Dublin. Abina Falvey Abina has been a project manager in Ericcson for over 9 years as well as having over 5 years exposure to CMMI. She was involved in a project to adapt CMMI for Open Systems. Abina is the holder of a Computer Science (Honours) degree from University College Cork and a diploma in Project Management from the Smurfit Business School in University College Dublin. Bob Fantina Bob has over 10 years experience in various companies including Research In Motion (RIM), MetLife, Merrill Lynch, Motorola, and Lucent Technologies. While in Lucent, he was responsible for preparing his division s compliance with CMM Level 2. Bob holds an M.Sc. in Administration Policy and Planning from Rutgers University and has written a book on SPI entitled Practical Software Process Improvement. Steve Fried Steve currently works for Boeing Aerospace and has over 25 years experience in software development and project management for various Fortune 500 companies. He has over 12 years process-related experience and was a core team member of the team which brought the Motorola (Cellphone) division to CMM Level 5. Israel Gatt Israel Gatt has 25 years experience in IT, the last 7 of which have been in a company that specializes in CMMI-based Process Definition and Performance and Configuration Management. 190
205 Pat Lucey Pat has over 17 years experience in Motorola (Ireland) where he has variously worked in software development, customer support, technical assistance, QA, and Process Management. He is currently the Managing Director of Aspiracon, a consulting and software development business based in Cork which specializes in Project and Process management. Pat holds a B.Eng. in Electronic Engineering from the University of Limerick. Harvey Millner Harvey Millner currently works for Satyam, an Indian IT consulting firm. He has over 16 years experience in the IT industry and in 2005, while working for J.P. Morgan, was trained as a CMMI Assessment team member and participated on internal assessments for 3 years. Amit Mitra Amit Mitra has been working in the industry since During that time, he has worked in several large companies including the American Insurance Group (AIG) where he was the Chief Methodologist and Nynex/Verizon where he was the Director of Architecture. He currently teaches at the University of Arizona and University of California, San Diego (UCSD) and has published several books on Agile methodologies. Amit holds a B.Tech. from the Indian Institute of Technology and Tom O Kane Tom is currently a lecturer in Computer Science in University College Cork. Before that Tom spent 12 years in industry working for Motorola (Ireland) and Motorola Labs (US). He is a qualified CMM Lead Assessor and, during his time in Motorola, he has lead 15 assessments and performed 16 supplier assessments. In addition, he also taught introductory and intermediate training on CMMI to staff and was the chair of the Motorola Lead Assessor program. Tom holds a B.Eng. in Computing, an M.Sc. in Information Systems and a Ph.D. on the topic of the Alignment of Business Strategy and Process Improvement. Joan Rayford Joan Rayford works for Innovision Technologies, a consulting firm which consults in software systems, particularly in system quality, software process improvement and the cost of failure. She has been working in the Industry since 1990, starting off as a software developer. She currently works on software process improvement consulting, particularly CMMI, and has American Society for Quality (ASQ) and International Association for Contract and Commercial Management (IACCM) certifications. She was also involved in bringing General Motors software division from a Level 1 through to Level
206 April Reeve April Reeve has over 28 years experience in IT and 20 years experience as a project manager. During that time, she has worked at several Financial Services organizations, including the CitiBank Global Securities processing organization where she worked for 11 years and was instrumental in bringing it from a CMM Level 1 to a Level 3 organization. Rolf Reitzig Rolf Reitzig is the owner of Cogence, an independent consulting firm which is a business partner to the SEI and which specializes in the Rational Unified Process (RUP) and CMMI implementation consulting. Cognence has been in existence for the last 10 years. Before that, Rolf has worked in the industry since 1990 and holds a B.Eng. in Computer Science Engineering from the University of Colorado and an M.B.A., also from the University of Colorada. 192
207 Appendix D RS-ICMMI Expert Panel Biographies Colum Horgan Colum has over 17 years industry experience in a variety of areas, primarily in QA and SPI. He started working in 1993 as a quality engineer and has consistently worked on ISO 9001 and CMM/CMMI SPI programs since. He joined Motorola (Cork) in 1998 and eventually was in charge of approximately 100 quality engineers there. He is currently a partner in Aspiracon, a company which specializes project management and business process management. In addition, he is currently the vice president of the Irish chapter of the Project Management Institute. Colum holds a B.Eng. in Electronic Engineering. Charlie Penders Charlie has been in the financial services industry for over 15 years. His exposure to SPI started in Morgan Stanley 15 years ago when they partnered with the Software Engineering Institute. In the intervening years he has continued his experience in CMM/CMMI and Six Sigma. Charlie holds one bachelor s degree in Telecommunications and another in Biology. Fergal McCaffery Fergal has worked in industry as both a software designer and senior manager in Nortel. In all, Fergal has over 7 years experience in practice and further 10 years in academia. Fergal holds a B.Sc. and a PhD in Computer Science from the University of Ulster. Fran O Hara Fran is Principal Process Consultant and Practice Manager in Sogeti. He was a co-founder of Insight Test Services (since 2003) and founder and Principal Consultant of Insight Consulting (since 1996). Fran has worked in the software industry for over 25 years in research, safetycritical software development and in process improvement/quality assurance services across a range of sectors. He is a fellow of the ICS and a trained CMM lead assessor and TickIT auditor. He co-founded and is ex-chairman of the Irish Software Testing SIG, SoftTest Ireland ( a TMMi Foundation trustee and a regular presenter at international test and process improvement. Fran holds B.E. and M.Sc. degrees in Electronic Engineering. Marty Sanders Marty has over 50 years of experience in software, including development, maintenance, management and consulting of which over 20 year s experience has been in SPI. She holds a bachelor s degree in Ocean Engeering and a PhD in Computer Science from the University of Limerick. 193
208 Michael Doyle Michael has 15 years work experience in various companies including Ericsson Telecoms GSM & 3G divisions and Motorola (Ireland). Both companies are CMM Level 2 and Level 5 respectively and Michael has managed projects within the divisions that are CMM Level 2 and 5 compliant. Michael Doyle holds a B.Eng. in Electronic Engineering from the University of Limerick and an M.B.A. from the Smurfit Business School, University College Dublin. Pat Lucey Pat has over 17 years experience in Motorola (Ireland) where he has variously worked in software development, customer support, technical assistance, QA, and Process Management. He is currently the Managing Director of Aspiracon, a consulting and software development business based in Cork which specializes in Project and Process management. Pat holds a B.Eng. in Electronic Engineering from the University of Limerick. John Burton John is currently the Chief Technical Officer for Vitalograph and has worked in industry since John is also a co-author of a book on software risk management in the medical devices industry (Burton et al. 2009). John holds a B.Sc. in Computer Systems as well as a PhD in Computer Science, both from the University of Limerick. Tom O Kane Tom is currently a lecturer in Computer Science in University College Cork. Before that Tom spent 12 years in industry working for Motorola (Ireland) and Motorola Labs (US). He is a qualified CMM Lead Assessor and, during his time in Motorola, he has lead 15 assessments and performed 16 supplier assessments. In addition, he also taught introductory and intermediate training on CMMI to staff and was the chair of the Motorola Lead Assessor program. Tom holds a B.Eng. in Computing, an M.Sc. in Information Systems and a Ph.D. on the topic of the Alignment of Business Strategy and Process Improvement. Val Casey Val has 25 years of software experience, of which 15 years is in SPI. Val holds a B.Sc. in Economics & Management from the University of London, an M.Sc. in Software Reengineering from the University of Limerick and a PhD in Computer Science from the University of Limerick. His PhD is based on the implementation of global software development. 194
209 Appendix E Summary of CMMI Process Area to IGSI-ISM Benefits Map Level Process Area Expected Primary Benefits Expected Secondary Total Non- Benefits Primary 2 Requirements Management Project Management Project Monitoring and Control 2 Supplier Agreement Management 2 Measurement & Analysis 2 Process and Product Quality Assurance 2 Configuration Management Total Level
210 Level Process Area Expected Primary Benefits Expected Secondary Total Non- Benefits Primary 3 Requirements Development 3 Organizational Process Focus 3 Organizational Process Definition Organizational Training Technical Solution Integrated Project Management for IPPD Integrated Teaming Integrated Supplier Management Organizational Environment Integration for Product Integration Verification Validation Risk Management Decision Analysis and Resolution Total Level
211 Level Process Area Expected Primary Benefits Expected Secondary Total Non- Benefits Primary 4 Organizational Process Performance 5 Quantitative Project Management Total Level Organizational Innovation Deployment and Causal Analysis and Resolution Total Level Total All Levels
212 Appendix F Expert Panel Interview Presentation Rosetta Stone ROI Model F I O N B A R R M C L O U G H L I N I T A R I C H A R D S O N U N I V E R S I T Y O F L I M E R I C K, I R E L A N D Sunday, 16 August 2009 Contents Current state of play Rosetta Stone Model Introductory concepts IGSI-ISM Benefits/Objectives Model CMMI Level 2 (Staged) Benefit mapping How to achieve specific Benefits Funding provided by B4-Step/Science Foundation of Ireland (SFI) 198
213 Where are we currently? A lot of studies available on benefits of CMM/CMMI Many benefits are high-level benefits e.g. increased productivity, increased ROI What do they mean? Where do they come from? How are benefits related to each other? How do they translate to concrete benefits? Smaller companies tend to want to focus on specific benefits Companies already have some metrics available to them can they re-use them? Funding provided by B4-Step/Science Foundation of Ireland (SFI) Where are we currently (cont.) Organizational Focus Metrics Focus Many valuable studies of the benefits resulting from implementation of CMM/CMMI and Software Process Improvement (SPI) in general have been undertaken over the last several years. These studies may be viewed as having at least separate three axes Funding provided by B4-Step/Science Foundation of Ireland (SFI) 199
214 Why use the Rosetta Stone ROI (RSROI) Model? Provides a flexible framework that can be modified if needed Hierarchy of Business Objectives or Benefits how one benefit can impact others Benefits fine-grained Allows re-use of metrics where appropriate Allows targeting of specific benefits Funding provided by B4-Step/Science Foundation of Ireland (SFI) The Rosetta Stone Wiki - The Rosetta Stone is an ancient stele inscribed with the same passage of writing in two Egyptian language scripts and in classical Greek. It was created in 196 BC, discovered by the French in 1799, and translated in Comparative translation of the stone assisted in understanding many previously undecipherable examples of hieroglyphic writing. Funding provided by B4-Step/Science Foundation of Ireland (SFI) 200
215 Rosetta Stone and the Rosetta Stone ROI Model Rosetta Stone Rosetta Stone ROI Hieroglyphics Indicators Egyptian Business Objective Greek SPI Funding provided by B4-Step/Science Foundation of Ireland (SFI) What is the Rosetta Stone ROI Model? Indicators Business Objective SPI Return Costs a well-defined and extensible hierarchical set of Business Objectives associated with Software Process Improvement in general and CMMI in particular a mapping of those benefits by CMMI Process Areas an extensible set of performance measures and indicators. Users of the model are free to add any pre-existing, custom, or about-to-be-initiated performance measures that they may have, thus allowing them to re-use any existing work they have already undertaken or are about to undertake Funding provided by B4-Step/Science Foundation of Ireland (SFI) 201
216 Benefits/Objectives Goyal et al. [1], as part of research undertaken on the benefits of SPI for IBM Global Services, India (IGSI), held two workshops that used consensus-based responses as inputs for an Interpretive Structural Modeling (ISM) methodology to develop a model of the needs and consequences of SPI This model is called the IGSI-ISM ROI Model and shows the relationships between the various benefits that can be derived from SPI. Using this model, there are 21 separate identifiable benefit areas. Funding provided by B4-Step/Science Foundation of Ireland (SFI) IGSI-ISM Benefit/Business Objectives Model Funding provided by B4-Step/Science Foundation of Ireland (SFI) 202
217 Benefit Types Primary Brought about as a direct result of implementation of a PA/SPI where the cause and effect relationship between the Process Area implementation and the benefit is very strong Derived IGSI-ISM model is a hierarchical graph. Benefits elements that are closer to the root of the tree automatically accrue from benefits that are farther down if there is a path/relationship between them these are derived Funding provided by B4-Step/Science Foundation of Ireland (SFI) Indicators/Metrics and SPI Indicators/Metrics Metrics or indicators that will allow us to measure increased (or decreased) success in achieving benefits. In effect, these metrics act as proxies for the general benefit area SPI Applicable to any SPI. For the purposes of this presentation we are interested in CMMI Funding provided by B4-Step/Science Foundation of Ireland (SFI) 203
218 Costs, Return & ROI Benefits should ultimately lead to a monetary impact on the organization Some benefit impact may be difficult to quantify how much does increased morale save an organization? SPI costs effort/money Funding provided by B4-Step/Science Foundation of Ireland (SFI) ROI ROI is typically some ratio of benefit to cost There are several popular methods for evaluating projects [2-4]: Net Present Value (NPV) Internal Rate of Return (IRR) Return on Investment (ROI) Profitability Index (PI) Funding provided by B4-Step/Science Foundation of Ireland (SFI) 204
219 How RSROI Applies to CMMI Level 2 Staged Requirements Management Benefits - Better Risk Management, Understanding customer needs, Lower time to market Project Planning Benefits Better quality product, Better risk management, Efficient resource management, Understanding customer needs, Setting right customer expectations, predictability, Competitive proposals Funding provided by B4-Step/Science Foundation of Ireland (SFI) How RSROI Applies to CMMI Level 2 Staged (cont.) Project Monitoring & Control Benefits - Better quality product, Better risk management, Efficient resource management, Setting right customer expectations, Predictability Supplier Agreement Management Benefits - Better quality product, Better risk Management, predictability, Lower time to market Measurement & Analysis Benefits - Better quality product, Better risk Management, predictability, Lower time to market Funding provided by B4-Step/Science Foundation of Ireland (SFI) 205
220 How RSROI Applies to CMMI Level 2 Staged (cont.) Process and Product Quality Assurance Benefits - Improved institutionalization of Tools / Process / Methods, Better quality product, Better risk Management, predictability, Lower time to market Configuration Management Benefits - Better quality product, Better risk management, Teaming / Synergize Funding provided by B4-Step/Science Foundation of Ireland (SFI) CMMI Level 2 to Benefit Map PA Identifier Staged Level Process Area Expected Primary IGSI ROI Benefits Expected Derived IGSI ROI Benefits Managed Requirements Management 4-2, 4-4, , 2-1, 4-3, 3-2, 3-3, 3-4, 3-5, 2-1, 2-2, Project Planning 4-1, 4-2, 3-4, 3-5, 3-3, 4-3, , 3-4, 2-2, 1-1, 3-1, 3-3, 3-5, 2-1, Project Monitoring and Control 2-4 Supplier Agreement Management 4-2, 4-1, 4-3, 3-4, , 3-2, 3-3, 3-4, 2-1, 2-2, , 4-1, 3-4, , 3-2, 3-3, 3-4, 2-1, 2-2, Measurement and Analysis 4-2, 4-1, 5-2, , 3-2, 3-3, 3-4, 2-1, 2-2, Process and Product Quality Assurance 4-1, 4-2, 5-2, 7-1, , 6-2, 6-3, 5-1, 5-2, 4-3, 4-4, 3-1, 3-2, 3-3, 3-4, 3-5, 2-1, 2-2, Configuration Management 6-3, 4-2, , 5-2, 4-3, 4-4, 3-1, 3-2, 3-3, 3-4, 3-5, 2-1, 2-2, 1-1 Funding provided by B4-Step/Science Foundation of Ireland (SFI) 206
221 Meeting the Business Objectives of an Organization Approach/Process Identify specific benefit you want to achieve/improve Determine potential benefits for each PA Determine relevant PAs Identify indicators/metrics that can be used as proxies for benefits Order implementations of PAs Implement! Example - Lower Time to Market (5-2) Funding provided by B4-Step/Science Foundation of Ireland (SFI) Lower Time to Market Lower Time to Market (5-2) depends on: IGSI-ISM Id Objective Name 6-1 Skill development Facilitation by Management 6-2 Effective Information Management 6-3 Teaming/Synergize 7-1 Improved Institutionalization of Tools/Process/Methods 7-2 Business Focus Funding provided by B4-Step/Science Foundation of Ireland (SFI) 207
222 What Process Areas are linked to Business Objectives? PA Identifier Staged Level Process Area Expected Primary IGSI Expected Secondary IGSI ROI ROI Benefits Benefits 5-1, 2-1, Managed Requirements 4-2, 4-4, , 7-3, 3-4, 3-5, 2-1, 2- Management 2, , 3-2, 2-4 Supplier Agreement 4-2, 4-1, 3-4, , 3-4, 2-1, 2-2, 1-1 Management Measurement 2-5 and 4-2, 4-1, 5-2, , 3-2, 3-3, 3-4, 2-1, 2-2, 1-1 Analysis Process 2-6 and Product 4-1, 4-2, 5-2, 7-1, , 6-2, 6-3, 5-1, 5-2, 4-3, 4-4, 3- Quality Assurance 1, 3-2, 3-3, 3-4, 3-5, 2-1, 2-2, Configuration 6-3, 4-2, , 5-2, 4-3, 4-4, 3-1, 3-2, 3-3, 3- Management 4, 3-5, 2-1, 2-2, , 3-1, 3-2, 3-3, 3-4, Defined Requirements 5-2, 4-4, 4-2, , 2-1, 2- Development 2, , 6-2, 3-6 Organizational Process 7-1, 7-2, , 6-4, 5-1, 5-2, 4-1, 4- Focus 2, 4-3, 4-4, 3-1, 3-2, 3-3, 3-4, 3-5, 2-1, 2-2, , 6-3, 5-1, 5-2, 4-1, 4-2, 4-3, 3-7 Organizational Process 6-2, Definition 4, 3-1, 3-2, 3-3, 3-4, 3-5, 2-1, 2-2, Organizational Training 6-1, , 5-2, 4-1, 4-2, 4-3, 4-4, 3-1, 3-2, 3-3, 3-4, 3-5, 2-1, 2-2, 1-1 Integrated Project 6-3, 4-1, 4-2, 4-3, , 5-2, 3-1, 3-2, 3-3, 3-4, 3-5, 2- Management 1, 2-2, Integrated Project 6-3, 4-1, 4-2, 4-3, , 5-2, 3-1, 3-2, 3-3, 3-4, 3-5, 2- Management for IPPD 1, 2-2, Integrated Teaming 6-3, 4-1, 4-3, 4-2, 4-4, , 5-2, 3-1, 3-2, 3-3, 3-4, 3-5, 2-1, 2-2, Integrated Supplier 7-3, 6-3, 6-4, 4-1, 4-2, 7-2, 5-1, 5-2, 4-3, 3-1, 3-2, 3-3, 3-5, 2- Management 3-4, 5-2 1, 2-2, Organizational 6-2, 6-3, 7-2, 5-2, , 6-2, 6-4, 5-1, 5-2, 4-1, 4-2, 4- Environment for 3, 4-4, 3-1, 3-2, 3-3, 3-4, 3-5, 2- Integration 1, 2-2, Organizational Process 7-1, 7-2, 7-3, , 6-3, 5-1, 5-2, 4-1, 4-2, 4-3, Quantitatively Managed Performance 4, 3-1, 3-2, 3-3, 3-4, 3-5, 2-1, 2-2, , 4-4, 2-1, 3-3, 3-4, 3-5, 2-1, 4-2 Quantitative Project 4-1, 4-2, 4-3, Management 2, , 6-2, Optimizing Organizational Innovation 7-1, 7-2, , 6-4, 5-1, 5-2, 4-1, 4- and Deployment 2, 4-3, 4-4, 3-1, 3-2, 3-3, 3-4, 3-5, 2-1, 2-2, , 6-3, 5-1, 4-4, 3-1, 3-2, 3-3, 5-2 Causal Analysis and 6-2, 5-2, 4-1, 4-2, 4-3, Resolution 4, 3-5, 2-1, 3, 1-1 Funding provided by B4-Step/Science Foundation of Ireland (SFI) Prioritization of Implementation Factors: More consideration should be given to those PAs that primarily satisfy a particular objective. By this we mean that those PAs that satisfy an objective as a primary objective should be given higher ranking than those that do not. More consideration should be given to those PAs that, in the Staged Model, are lower in the Stage phases. Funding provided by B4-Step/Science Foundation of Ireland (SFI) 208
223 A Recommended Order of Implementation PA Identifier Process Area Expected Primary IGSI ROI Benefits 2-1 Requirements Management 4-2, 4-4, Supplier Agreement Management 4-2, 4-1, 3-4, Measurement and Analysis 4-2, 4-1, 5-2, Process and Product Quality Assurance 4-1, 4-2, 5-2, 7-1, Requirements Development 5-2, 4-4, 4-2, Integrated Supplier Management 7-3, 6-3, 6-4, 4-1, 4-2, 7-2, 3-4, Organizational Environment for Integration 6-2, 6-3, 7-2, 5-2, Quantitative Project Management 4-1, 4-2, 4-3, Causal Analysis and Resolution 6-2, 5-2, 4-1, 4-2, 4-3, Configuration Management 6-3, 4-2, Organizational Process Focus 7-1, 7-2, Organizational Process Definition 6-2, Organizational Training 6-1, Integrated Project Management for IPPD 6-3, 4-1, 4-2, 4-3, Integrated Teaming 6-3, 4-1, 4-3, 4-2, 4-4, Organizational Process Performance 7-1, 7-2, 7-3, Organizational Innovation and Deployment 7-1, 7-2, 7-3 Funding provided by B4-Step/Science Foundation of Ireland (SFI) References [1] A. Goyal, S. Kanungo, V. Muthu, and S. Jayadevan, "ROI for SPI: Lessons from Initiatives at IBM Global Services India," presented at SEPG 2001, [2] E. F. Brigham and L. C. Gapenski, Financial Management - Theory and Practice: Dryden Press, [3] R. C. Higgins, Analysis for Financial Management, vol. 5th: Irwin/McGraw-Hill, [4] S. A. Ross, R. W. Westerfield, and J. Jaffe, Corporate Finance, 5th Ed. ed: Irwin/McGraw-Hill, Funding provided by B4-Step/Science Foundation of Ireland (SFI) 209
224 Questions? Funding provided by B4-Step/Science Foundation of Ireland (SFI) Contacts University of Limerick Fionbarr McLoughlin Dr. Ita Richardson +353-(0) Funding provided by B4-Step/Science Foundation of Ireland (SFI) 210
225 Appendix G Presentation to NDIA Conference 2006 The following presentation was delivered to the National Defense Industry Association Conference held in Denver, Colorado in June, Rosetta Stone ROI Model Fionbarr McLoughlin Ita Richardson University of Limerick, Ireland Wednesday, 02 June Contents Current state of play Rosetta Stone Model Introductory concepts IGSI-ISM Benefits/Objectives Model CMMI Level 2 (Staged) Benefit mapping How to achieve specific Benefits Funding provided by B4-Step/Science Foundation of Ireland (SFI) 2 211
226 Where are we currently? A lot of studies available on benefits of CMM/CMMI Many benefits are high-level benefits e.g. increased productivity, increased ROI What do they mean? Where do they come from? How are benefits related to each other? How do they translate to concrete benefits? Smaller companies tend to want to focus on specific benefits Companies already have some metrics available to them can they re-use them? Funding provided by B4-Step/Science Foundation of Ireland (SFI) 1 Why use the Rosetta Stone ROI (RSROI) Model? Provides a flexible framework that can be modified if needed Hierarchy of Business Objectives or Benefits how one benefit can impact others Benefits fine-grained Allows re-use of metrics where appropriate Allows targeting of specific benefits Funding provided by B4-Step/Science Foundation of Ireland (SFI) 5 212
227 The Rosetta Stone Wiki - The Rosetta Stone is an ancient stele inscribed with the same passage of writing in two Egyptian language scripts and in classical Greek. It was created in 196 BC, discovered by the French in 1799, and translated in Comparative translation of the stone assisted in understanding many previously undecipherable examples of hieroglyphic writing. Funding provided by B4-Step/Science Foundation of Ireland (SFI) 6 Rosetta Stone and the Rosetta Stone ROI Model Rosetta Stone Rosetta Stone ROI Hieroglyphics Indicators Egyptian Business Objective Greek SPI Funding provided by B4-Step/Science Foundation of Ireland (SFI) 7 213
228 What is the Rosetta Stone ROI Model? Indicators Business Objective SPI Return Costs a well-defined and extensible hierarchical set of Business Objectives associated with Software Process Improvement in general and CMMI in particular a mapping of those benefits by CMMI Process Areas an extensible set of performance measures and indicators. Users of the model are free to add any pre-existing, custom, or about-to-be-initiated performance measures that they may have, thus allowing them to re-use any existing work they have already undertaken or are about to undertake Funding provided by B4-Step/Science Foundation of Ireland (SFI) 8 Benefits/Objectives Goyal et al. [1], as part of research undertaken on the benefits of SPI for IBM Global Services, India (IGSI), held two workshops that used consensus-based responses as inputs for an Interpretive Structural Modeling (ISM) methodology to develop a model of the needs and consequences of SPI This model is called the IGSI-ISM ROI Model and shows the relationships between the various benefits that can be derived from SPI. Using this model, there are 21 separate identifiable benefit areas. Funding provided by B4-Step/Science Foundation of Ireland (SFI) 9 214
229 IGSI-ISM Benefit/Business Objectives Model Funding provided by B4-Step/Science Foundation of Ireland (SFI) 10 Benefit Types Primary Brought about as a direct result of implementation of a PA/SPI where the cause and effect relationship between the Process Area implementation and the benefit is very strong Derived IGSI-ISM model is a hierarchical graph. Benefits elements that are closer to the root of the tree automatically accrue from benefits that are farther down if there is a path/relationship between them these are derived Funding provided by B4-Step/Science Foundation of Ireland (SFI)
230 Indicators/Metrics and SPI Indicators/Metrics Metrics or indicators that will allow us to measure increased (or decreased) success in achieving benefits. In effect, these metrics act as proxies for the general benefit area SPI Applicable to any SPI. For the purposes of this presentation we are interested in CMMI Funding provided by B4-Step/Science Foundation of Ireland (SFI) 12 Costs, Return & ROI Benefits should ultimately lead to a monetary impact on the organization Some benefit impact may be difficult to quantify how much does increased morale save an organization? SPI costs effort/money Funding provided by B4-Step/Science Foundation of Ireland (SFI)
231 ROI ROI is typically some ratio of benefit to cost There are several popular methods for evaluating projects [2-4]: Net Present Value (NPV) Internal Rate of Return (IRR) Return on Investment (ROI) Profitability Index (PI) Funding provided by B4-Step/Science Foundation of Ireland (SFI) 14 How RSROI Applies to CMMI Level 2 Staged Requirements Management Benefits - Better Risk Management, Understanding customer needs, Lower time to market Project Planning Benefits Better quality product, Better risk management, Efficient resource management, Understanding customer needs, Setting right customer expectations, predictability, Competitive proposals Funding provided by B4-Step/Science Foundation of Ireland (SFI)
232 How RSROI Applies to CMMI Level 2 Staged (cont.) Project Monitoring & Control Benefits - Better quality product, Better risk management, Efficient resource management, Setting right customer expectations, Predictability Supplier Agreement Management Benefits - Better quality product, Better risk Management, predictability, Lower time to market Measurement & Analysis Benefits - Better quality product, Better risk Management, predictability, Lower time to market Funding provided by B4-Step/Science Foundation of Ireland (SFI) 16 How RSROI Applies to CMMI Level 2 Staged (cont.) Process and Product Quality Assurance Benefits - Improved institutionalization of Tools / Process / Methods, Better quality product, Better risk Management, predictability, Lower time to market Configuration Management Benefits - Better quality product, Better risk management, Teaming / Synergize Funding provided by B4-Step/Science Foundation of Ireland (SFI)
233 CMMI Level 2 to Benefit Map PA Identifier Staged Level Process Area Expected Primary IGSI ROI Benefits Expected Derived IGSI ROI Benefits Managed Requirements Management 4-2, 4-4, , 2-1, 4-3, 7-3, 3-4, 3-5, 2-1, 2-2, Project Planning 4-1, 4-2, 3-4, 3-5, 3-3, 4-3, , 3-4, 2-2, 1-1, 3-1, 3-3, 3-5, 2-1, Project Monitoring and Control 2-4 Supplier Agreement Management 4-2, 4-1, 4-3, 3-4, , 3-2, 3-3, 3-4, 2-1, 2-2, , 4-1, 3-4, , 3-2, 3-3, 3-4, 2-1, 2-2, Measurement and Analysis 4-2, 4-1, 5-2, , 3-2, 3-3, 3-4, 2-1, 2-2, Process and Product Quality Assurance 4-1, 4-2, 5-2, 7-1, , 6-2, 6-3, 5-1, 5-2, 4-3, 4-4, 3-1, 3-2, 3-3, 3-4, 3-5, 2-1, 2-2, Configuration Management 6-3, 4-2, , 5-2, 4-3, 4-4, 3-1, 3-2, 3-3, 3-4, 3-5, 2-1, 2-2, 1-1 Funding provided by B4-Step/Science Foundation of Ireland (SFI) 18 Meeting the Business Objectives of an Organization Approach/Process Identify specific benefit you want to achieve/improve Determine potential benefits for each PA Determine relevant PAs Identify indicators/metrics that can be used as proxies for benefits Order implementations of PAs Implement! Example - Lower Time to Market (5-2) Funding provided by B4-Step/Science Foundation of Ireland (SFI)
234 Lower Time to Market Lower Time to Market (5-2) depends on: IGSI-ISM Id Objective Name 6-1 Skill development Facilitation by Management 6-2 Effective Information Management 6-3 Teaming/Synergize 7-1 Improved Institutionalization of Tools/Process/Methods 7-2 Business Focus Funding provided by B4-Step/Science Foundation of Ireland (SFI) 20 What Process Areas are linked to Business Objectives? PA Identifier Staged Level Process Area Expected Primary IGSI Expected Secondary IGSI ROI ROI Benefits Benefits 5-1, 2-1, Managed Requirements 4-2, 4-4, , 7-3, 3-4, 3-5, 2-1, 2- Management 2, , 3-2, 2-4 Supplier Agreement 4-2, 4-1, 3-4, , 3-4, 2-1, 2-2, 1-1 Management Measurement 2-5 and 4-2, 4-1, 5-2, , 3-2, 3-3, 3-4, 2-1, 2-2, 1-1 Analysis Process 2-6 and Product 4-1, 4-2, 5-2, 7-1, , 6-2, 6-3, 5-1, 5-2, 4-3, 4-4, 3- Quality Assurance 1, 3-2, 3-3, 3-4, 3-5, 2-1, 2-2, Configuration 6-3, 4-2, , 5-2, 4-3, 4-4, 3-1, 3-2, 3-3, 3- Management 4, 3-5, 2-1, 2-2, , 3-1, 3-2, 3-3, 3-4, Defined Requirements 5-2, 4-4, 4-2, , 2-1, 2- Development 2, , 6-2, 3-6 Organizational Process 7-1, 7-2, , 6-4, 5-1, 5-2, 4-1, 4- Focus 2, 4-3, 4-4, 3-1, 3-2, 3-3, 3-4, 3-5, 2-1, 2-2, , 6-3, 5-1, 5-2, 4-1, 4-2, 4-3, 3-7 Organizational Process 6-2, Definition 4, 3-1, 3-2, 3-3, 3-4, 3-5, 2-1, 2-2, Organizational Training 6-1, , 5-2, 4-1, 4-2, 4-3, 4-4, 3-1, 3-2, 3-3, 3-4, 3-5, 2-1, 2-2, 1-1 Integrated Project 6-3, 4-1, 4-2, 4-3, , 5-2, 3-1, 3-2, 3-3, 3-4, 3-5, 2- Management 1, 2-2, Integrated Project 6-3, 4-1, 4-2, 4-3, , 5-2, 3-1, 3-2, 3-3, 3-4, 3-5, 2- Management for IPPD 1, 2-2, Integrated Teaming 6-3, 4-1, 4-3, 4-2, 4-4, , 5-2, 3-1, 3-2, 3-3, 3-4, 3-5, 2-1, 2-2, Integrated Supplier 7-3, 6-3, 6-4, 4-1, 4-2, 7-2, 5-1, 5-2, 4-3, 3-1, 3-2, 3-3, 3-5, 2- Management 3-4, 5-2 1, 2-2, Organizational 6-2, 6-3, 7-2, 5-2, , 6-2, 6-4, 5-1, 5-2, 4-1, 4-2, 4- Environment for 3, 4-4, 3-1, 3-2, 3-3, 3-4, 3-5, 2- Integration 1, 2-2, Organizational Process 7-1, 7-2, 7-3, , 6-3, 5-1, 5-2, 4-1, 4-2, 4-3, Quantitatively Managed Performance 4, 3-1, 3-2, 3-3, 3-4, 3-5, 2-1, 2-2, , 4-4, 2-1, 3-3, 3-4, 3-5, 2-1, 4-2 Quantitative Project 4-1, 4-2, 4-3, Management 2, , 6-2, Optimizing Organizational Innovation 7-1, 7-2, , 6-4, 5-1, 5-2, 4-1, 4- and Deployment 2, 4-3, 4-4, 3-1, 3-2, 3-3, 3-4, 3-5, 2-1, 2-2, , 6-3, 5-1, 4-4, 3-1, 3-2, 3-3, 5-2 Causal Analysis and 6-2, 5-2, 4-1, 4-2, 4-3, Resolution 4, 3-5, 2-1, 3, 1-1 Funding provided by B4-Step/Science Foundation of Ireland (SFI)
235 Prioritization of Implementation Factors: More consideration should be given to those PAs that primarily satisfy a particular objective. By this we mean that those PAs that satisfy an objective as a primary objective should be given higher ranking than those that do not. More consideration should be given to those PAs that, in the Staged Model, are lower in the Stage phases. Funding provided by B4-Step/Science Foundation of Ireland (SFI) 22 A Recommended Order of Implementation PA Identifier Process Area Expected Primary IGSI ROI Benefits 2-1 Requirements Management 4-2, 4-4, Supplier Agreement Management 4-2, 4-1, 3-4, Measurement and Analysis 4-2, 4-1, 5-2, Process and Product Quality Assurance 4-1, 4-2, 5-2, 7-1, Requirements Development 5-2, 4-4, 4-2, Integrated Supplier Management 7-3, 6-3, 6-4, 4-1, 4-2, 7-2, 3-4, Organizational Environment for Integration 6-2, 6-3, 7-2, 5-2, Quantitative Project Management 4-1, 4-2, 4-3, Causal Analysis and Resolution 6-2, 5-2, 4-1, 4-2, 4-3, Configuration Management 6-3, 4-2, Organizational Process Focus 7-1, 7-2, Organizational Process Definition 6-2, Organizational Training 6-1, Integrated Project Management for IPPD 6-3, 4-1, 4-2, 4-3, Integrated Teaming 6-3, 4-1, 4-3, 4-2, 4-4, Organizational Process Performance 7-1, 7-2, 7-3, Organizational Innovation and Deployment 7-1, 7-2, 7-3 Funding provided by B4-Step/Science Foundation of Ireland (SFI)
236 References [1] A. Goyal, S. Kanungo, V. Muthu, and S. Jayadevan, "ROI for SPI: Lessons from Initiatives at IBM Global Services India," presented at SEPG 2001, [2] E. F. Brigham and L. C. Gapenski, Financial Management - Theory and Practice: Dryden Press, [3] R. C. Higgins, Analysis for Financial Management, vol. 5th: Irwin/McGraw-Hill, [4] S. A. Ross, R. W. Westerfield, and J. Jaffe, Corporate Finance, 5th Ed. ed: Irwin/McGraw-Hill, Funding provided by B4-Step/Science Foundation of Ireland (SFI)
237 Appendix H PROFES2010 Conference Paper The following paper was accepted for the PROFES2010 conference in the University of Limerick in June
238 224
239 225
240 226
241 227
242 228
243 229
244 230
245 231
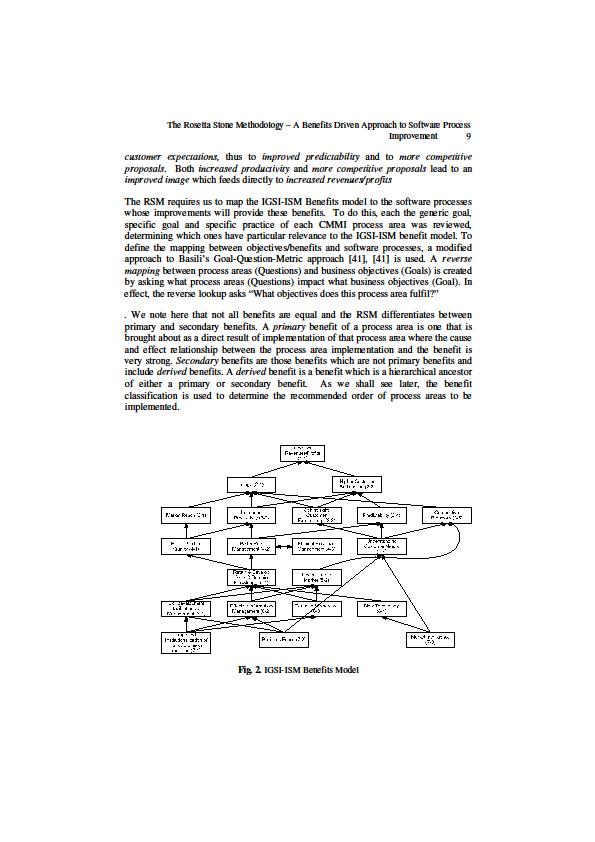
246 232
The Rosetta Stone Methodology A Benefits Driven Approach to Software Process Improvement
 The Rosetta Stone Methodology A Benefits Driven Approach to Software Process Improvement Fionbarr McLoughlin and Ita Richardson Lero the Irish Software Engineering Research Centre University of Limerick
Software technology 3. Process improvement models. BSc Course Dr. Katalin Balla
 Software technology 3. Process improvement models BSc Course Dr. Katalin Balla Contents Process improvement models. Popular SPI models: CMM, SPICE, CMMI The Personal Software Process (PSP) and the Team
Aldo Dagnino. ABB Corporate Research Industrial Software Systems. Raleigh, NC
 Measuring Economic Benefits of CMMI: Leveraging the Interpretive Structural Methodology CMMI Conference 2008 Denver, CO Aldo Dagnino ABB Corporate Research Industrial Software Systems Raleigh, NC ABB Corporate
Rosetta Stone ROI Model
 Rosetta Stone ROI Model Fionbarr McLoughlin Ita Richardson University of Limerick, Ireland Thursday, November 16, 2006 1 Contents Current state of play Rosetta Stone Model Introductory concepts IGSI-ISM
Understanding Model Representations and Levels: What Do They Mean?
 Pittsburgh, PA 15213-3890 Understanding Model Representations and Levels: What Do They Mean? Mary Beth Chrissis Mike Konrad Sandy Shrum Sponsored by the U.S. Department of Defense 2004 by Carnegie Mellon
9/24/2011 Sof o tw t a w re e P roc o e c s e s s s Mo M d o e d l e s l 1 Wh W a h t t i s i s a Pr P oc o ess s 2 1
 Software Process Models 1 What is a Process 2 1 What is a Process? Given input, transforms it into output Consist of a set of activities Ordering among the activities (a partial order) Software Process
SOFTWARE ENGINEERING SOFTWARE PROCESS. Saulius Ragaišis.
 SOFTWARE ENGINEERING SOFTWARE PROCESS Saulius Ragaišis saulius.ragaisis@mif.vu.lt CSC2008 SE Software Processes Learning Objectives: Explain the concept of a software life cycle and provide an example,
MTAT Software Engineering Management
 MTAT.03.243 Software Engineering Management Lecture 16: Software Process Assessment Dietmar Pfahl Spring 2013 email: dietmar.pfahl@ut.ee Structure of Lecture 16 Process Assessment Origins: CMM & CMMI Process
Update Observations of the Relationships between CMMI and ISO 9001:2000
 Update Observations of the Relationships between CMMI and ISO 9001:2000 September September 14, 14, 2005 2005 ASQ Section 509 - ISO 9000 Users Group Page 1 This presentation summaries points made and topics
MEASURING PROCESS CAPABILITY VERSUS ORGANIZATIONAL PROCESS MATURITY
 MEASURING PROCESS CAPABILITY VERSUS ORGANIZATIONAL PROCESS MATURITY Mark C. Paulk and Michael D. Konrad Software Engineering Institute Carnegie Mellon University Pittsburgh, PA 15213-3890 Abstract The
Two Branches of Software Engineering
 ENTERPRISE SOFTWARE ENGINEERING & SOFTWARE ENGINEERING IN THE ENTERPRISE Two Branches of Software Engineering 1 Crafting Software Resource Input Code Debug Product Test 2 Engineering Software Resource
DORNERWORKS QUALITY SYSTEM
 DORNERWORKS QUALITY SYSTEM ALIGNMENT WITH CMMI INTRODUCTION Since its beginning, DornerWorks has had quality as one of our main goals. We have delivered solutions for over a dozen aircraft, including several
CMMI Version 1.2. Model Changes
 Pittsburgh, PA 15213-3890 CMMI Version 1.2 Model Changes SM CMM Integration, IDEAL, and SCAMPI are service marks of Carnegie Mellon University. Capability Maturity Model, Capability Maturity Modeling,
USAF Software Technology Support Center (STSC) STSC SPI Help Desk COM , DSN
 STSC SPI Help Desk COM , DSN") This mapping was performed by the For all your Software Improvement (SPI) needs call the USAF Software Technology Support Center (STSC) STSC SPI Help Desk COM 801.777.7214, DSN 777.7214 E-mail: larry.w.smith@hill.af.mil
This mapping was performed by the For all your Software Improvement (SPI) needs call the USAF Software Technology Support Center (STSC) STSC SPI Help Desk COM 801.777.7214, DSN 777.7214 E-mail: larry.w.smith@hill.af.mil
A Global Overview of The Structure
 A Global Overview of The Structure CMMI for Development V.1.2 Module 2 M02/GO/v1.2 Agenda Overview of CMMI General Structure of CMMI CMMI Model Representations Generic Goals and Practices CMMI by PAs and
SW CMM. Capability Maturity Models. Level 1: Initial Level SW CMM (2) CS 390 Lecture 8 Improving the Software Process
 CS 390 Lecture 8 Improving the Software Process") CS 390 Lecture 8 Improving the Software Process 1987 U.S. Department of Defense task force: The fundamental problem with software is that the software process is badly managed DoD initiative: Software
CS 390 Lecture 8 Improving the Software Process 1987 U.S. Department of Defense task force: The fundamental problem with software is that the software process is badly managed DoD initiative: Software
This chapter illustrates the evolutionary differences between
 CHAPTER 6 Contents An integrated approach Two representations CMMI process area contents Process area upgrades and additions Project management concepts process areas Project Monitoring and Control Engineering
Software Engineering
 Software Engineering (CS550) Software Development Process Jongmoon Baik Software Development Processes (Lifecycle Models) 2 What is a S/W Life Cycle? The series of stages in form and functional activity
CMMI-DEV V1.3 CMMI for Development Version 1.3 Quick Reference Guide
 processlabs CMMI-DEV V1.3 CMMI for Development Version 1.3 Quick Reference Guide CMMI-DEV V1.3 Process Areas Alphabetically by Process Area Acronym processlabs CAR - Causal Analysis and Resolution...
Rational Software White Paper TP 174
 Reaching CMM Levels 2 and 3 with the Rational Unified Process Rational Software White Paper TP 174 Table of Contents Abstract... 1 Introduction... 1 Level 2, Repeatable... 2 Requirements Management...
SWEN 256 Software Process & Project Management
 SWEN 256 Software Process & Project Management Understanding existing processes Introducing process changes to achieve organisational objectives which are usually focused on quality improvement, cost reduction
Revista Economică 70:4 (2018) USING THE INTEGRATED CAPABILITY AND MATURITY MODEL IN THE DEVELOPMENT PROCESS OF SOFTWARE SYSTEMS
 USING THE INTEGRATED CAPABILITY AND MATURITY MODEL IN THE DEVELOPMENT PROCESS OF SOFTWARE SYSTEMS") USING THE INTEGRATED CAPABILITY AND MATURITY MODEL IN THE DEVELOPMENT PROCESS OF SOFTWARE SYSTEMS Marian Pompiliu CRISTESCU 1, Ana-Maria Ramona STANCU 2 1 Lucian Blaga University of Sibiu, Sibiu, Romania
USING THE INTEGRATED CAPABILITY AND MATURITY MODEL IN THE DEVELOPMENT PROCESS OF SOFTWARE SYSTEMS Marian Pompiliu CRISTESCU 1, Ana-Maria Ramona STANCU 2 1 Lucian Blaga University of Sibiu, Sibiu, Romania
Software Project Management Sixth Edition. Chapter Software process quality
 Software Project Management Sixth Edition Chapter 13.2 Software process quality 1 Product and Process Quality A good process is usually required to produce a good product. For manufactured goods, process
Boldly Going Where Few Have Gone Before SCAMPI SM C Appraisal Using the CMMI for Acquisition
 Boldly Going Where Few Have Gone Before SCAMPI SM C Appraisal Using the CMMI for Acquisition Carol Klingler & John Kennedy klingler@mitre.org; jkennedy@mitre.org 8th Annual CMMI Technology Conference &
Managing a Project and Keeping Sane While Wrestling Elegantly With PMBOK, Scrum and CMMI (Together or Any Combination)
") Managing a Project and Keeping Sane While Wrestling Elegantly With PMBOK, Scrum and CMMI (Together or Any Combination) Neil Potter The Process Group neil@processgroup.com 1 Agenda Summary of PMBOK, CMMI
Managing a Project and Keeping Sane While Wrestling Elegantly With PMBOK, Scrum and CMMI (Together or Any Combination) Neil Potter The Process Group neil@processgroup.com 1 Agenda Summary of PMBOK, CMMI
The CMMI Product Suite and International Standards
 Pittsburgh, PA 15213-3890 The Product Suite and International Standards Dave Kitson, Jeanie Kitson, Terry Rout and Pedro Sousa is registered in the US Patent & Trademark Office by Carnegie Mellon University
Software Process Assessment
 Software Process Assessment A method of determining the effectiveness of the software process with a goal towards improving the process. Software Process Assessment Approaches Capability Maturity Model
Highlights of CMMI and SCAMPI 1.2 Changes
 Highlights of CMMI and SCAMPI 1.2 Changes Presented By: Sandra Cepeda March 2007 Material adapted from CMMI Version 1.2 and Beyond by Mike Phillips, SEI and from Sampling Update to the CMMI Steering Group
CMM,,mproving and,ntegrating
 Pittsburgh, PA 15213-3890 CMM,,mproving and,ntegrating Mike Phillips Mary Beth Chrissis Mike Konrad Sandy Shrum SM SCAMPI, SCAMPI Lead Appraiser, SEPG, and SEI are service marks of Carnegie Mellon University.,
CMMI for Services Quick Reference
 CAPACITY AND AVAILABILITY MANAGEMENT PROJECT & WORK MGMT (ML3) The purpose of Capacity and Availability Management (CAM) is to ensure effective service system performance and ensure that resources are
CMMI SM Model Measurement and Analysis
 Carnegie Mellon University Software Engineering Institute CMMI SM Model CMMI SM is a Service Mark of Carnegie Mellon University Carnegie Mellon University Software Engineering Institute CMMI Staged Representation
Measuring Performance: Evidence about the Results of CMMI
 Pittsburgh, PA 15213-3890 Measuring Performance: Evidence about the Results of CMMI Dennis R. Goldenson Diane L. Gibson Software Engineering Institute 5 th Annual CMMI Technology Conference & User Group
Engineering. CMMI for Development V.1.2 Module 3. M03/Engineering/v1.2
 Engineering CMMI for Development V.1.2 Module 3 M03/Engineering/v1.2 Agenda Global scope RD Development REQM Management TS Technical Solution PI Product Integration VER Verification VAL Validation SE Process
Leveraging Your Service Quality Using ITIL V3, ISO and CMMI-SVC. Monday Half-Day Tutorial
 Leveraging Your Service Quality Using ITIL V3, ISO 20000 and CMMI-SVC Monday Half-Day Tutorial Definitions Service - Employment in duties or work for another The Challenge This situation where organization
CMMI for Technical Staff
 CMMI for Technical Staff SES CMMI Training Series April 7, 2009 Audio Conference #: Dial - 1-877-760-2042 Pass code - 147272 SM SEI and CMM Integration are service marks of Carnegie Mellon University CMM
Chapter 26 Process improvement
 Chapter 26 Process improvement 1 Topics covered The process improvement process Process measurement Process analysis Process change The CMMI process improvement framework 2 Process improvement Many software
Object-Oriented and Classical Software Engineering
 Slide 3.1 Object-Oriented and Classical Software Engineering Seventh Edition, WCB/McGraw-Hill, 2007 Stephen R. Schach srs@vuse.vanderbilt.edu CHAPTER 3 Slide 3.2 THE SOFTWARE PROCESS Overview Slide 3.3
Chapter 6. Software Quality Management & Estimation
 Chapter 6 Software Quality Management & Estimation What is Quality Management Also called software quality assurance (SQA) s/w quality:- It is defined as the degree to which a system, components, or process
CMMI for Acquisition Quick Reference
 AGREEMENT MANAGEMENT PROJECT MANAGEMENT (ML2) The purpose of Agreement Management (AM) is to ensure that the supplier and the acquirer perform according to the terms of the supplier agreement. SG 1 The
Evolutionary Differences Between CMM for Software and the CMMI
 Evolutionary Differences Between CMM for Software and the CMMI Welcome WelKom Huan Yín Bienvenue Bienvenido Wilkommen????S???S??? Bienvenuto Tervetuloa Välkommen Witamy - 2 Adapting an An Integrated Approach
CMMI SM Mini- Assessments
 CMMI SM Mini- Assessments Gary Natwick Harris Corporation Melbourne, Florida SM - CMMI is a service mark of Carnegie Mellon University next level solutions Gary Natwick - 1 Harris Corporation Government
Best Practice Information Aids for CMMI SM -Compliant Process Engineering
 Paul R. Croll Chair, IEEE Software Engineering Standards Committee Vice Chair, ISO/IEC JTC1/SC7 U.S. TAG Computer Sciences Corporation pcroll@csc.com Best Practice Information Aids for CMMI SM -Compliant
CMMI A-Specification. Version 1.7. November, For CMMI Version 1.2. This document is controlled by the CMMI Steering Group.
 CMMI A-Specification Version 1.7 For CMMI Version 1.2 November, 2007 This document is controlled by the CMMI Steering Group. CHANGE PAGE HISTORY This is the first release of the A-Spec for CMMI v1.2. Change
Quality Management of Software and Systems: Software Process Assessments
 Quality Management of Software and Systems: Software Process Assessments Contents Temporal development of the CMM and the assessment procedures Mature and Immature Processes Structure of the Capability
Assessment Results using the Software Maintenance Maturity Model (S 3m )
") Assessment Results using the Software Maintenance Maturity Model (S 3m ) David-Alexandre Paquette Alain April Alain Abran École de Technologie Supérieure david-alexandre.paquette.1@ens.etsmtl.ca alain.april@etsmtl.ca
Assessment Results using the Software Maintenance Maturity Model (S 3m ) David-Alexandre Paquette Alain April Alain Abran École de Technologie Supérieure david-alexandre.paquette.1@ens.etsmtl.ca alain.april@etsmtl.ca
CMMI-SVC V1.3 CMMI for Services Version 1.3 Quick Reference Guide
 processlabs CMMI-SVC V1.3 CMMI for Services Version 1.3 Quick Reference Guide CMMI-SVC V1.3 Process Areas Alphabetically by Process Area Acronym processlabs CAM - Capacity and Availability Management...
Relationship between CMMI Maturity Levels and ISO/IEC Processes Capability Profiles
 Relationship between CMMI Maturity Levels and ISO/IEC 15504 Processes Capability Profiles Antanas Mitašiūnas, Saulius Ragaišis Faculty of Mathematics and Informatics, Vilnius University, Lithuania Baltic
Overview of Maintenance. CPRE 416-Software Evolution and Maintenance-Lecture 3
 Overview of Maintenance CPRE 416-Software Evolution and Maintenance-Lecture 3 1 Need to Study Software Maintenance Software Maintenance is the single most expensive activity in software engineering requiring
Quality Systems Frameworks. RIT Software Engineering
 Quality Systems Frameworks Some Major Quality Frameworks ISO 9000 family of standards A general international standard for organizational quality systems Oriented towards assessment and certification Malcolm-Baldrige
What s New in V1.3. Judah Mogilensky Process Enhancement Partners, Inc.
 What s New in V1.3 Judah Mogilensky Process Enhancement Partners, Inc. 1 Acknowledgements This presentation is based, in part, on the CMMI V1.3 released materials, as well as on several presentations by
SCRUM and the CMMI. The Wolf and the Lamb shall Feed Together
 The Wolf and the Lamb shall Feed Together Dr. Tami Zemel Tangram Hi-Tech Ltd. Shlomi Oren Creo Israel Ltd. The Scrum is an agile, lightweight process developed as a mean to deal with ever changing requirements
Lesson Learned from Cross Constellations and Multi Models Process Improvement Initiatives
 Lesson Learned from Cross Constellations and Multi Models Process Improvement Initiatives Kobi Vider Picker K.V.P Consulting Kobi.Vider@hotmail.com +972522946676 Conceptual Structure and Elements Dashboards
Extending an Agile Method to Support Requirements Management and Development in Conformance to CMMI
 Extending an Agile Method to Support Requirements Management and Development in Conformance to CMMI Alexandre Lazaretti Zanatta 1, Patrícia Vilain 2 1 Instituto de Ciências Exatas e Geociências - Ciência
CMMI for Services (CMMI -SVC) Process Areas
 Process Areas") CMMI for Services (CMMI -SVC) Process Areas SES CMMI Training Series August27, 2009 Dial - 1-877-760-2042 Pass code - 147272 SM SEI and CMM Integration are service marks of Carnegie Mellon University CMM
CMMI for Services (CMMI -SVC) Process Areas SES CMMI Training Series August27, 2009 Dial - 1-877-760-2042 Pass code - 147272 SM SEI and CMM Integration are service marks of Carnegie Mellon University CMM
Software Engineering. Lecture 7: CMMI
 Chair of Software Engineering Software Engineering Spring Semester 2008 Lecture 7: CMMI (based in part on material by Dr. Peter Kolb) SEI Trademarks and Service Marks SM CMM Integration SCAMPI are service
Changes to the SCAMPI Methodology and How to Prepare for a SCAMPI Appraisal
 Changes to the SCAMPI Methodology and How to Prepare for a SCAMPI Appraisal Presented by: Lemis O. Altan SEI-Certified SCAMPI V1.3 Lead Appraiser for Development Process Edge International, Inc. Copyright
Object-Oriented and Classical Software Engineering THE SOFTWARE PROCESS 9/17/2017. CHAPTER 3 Slide 3.2. Stephen R. Schach. Overview Slide 3.
 Slide 3.1 CHAPTER 3 Slide 3.2 Object-Oriented and Classical Software Engineering THE SOFTWARE PROCESS Eighth Edition, WCB/McGraw-Hill, 2011 Stephen R. Schach Overview Slide 3.3 Overview (contd) Slide 3.4
A Measurement Approach Integrating ISO 15939, CMMI and the ISBSG
 A Measurement Approach Integrating ISO 15939, CMMI and the ISBSG Luc Bégnoche, Alain Abran, Luigi Buglione Abstract In recent years, a number of well-known groups have developed sets of best practices
The Rational Unified Process and the Capability Maturity Model Integrated Systems/Software Engineering
 The Rational Unified Process and the Capability Maturity Model Integrated Systems/Software Engineering Brian Gallagher Lisa Brownsword SM CMMI and CMM Integration are service marks of Carnegie Mellon University.
CGEIT Certification Job Practice
 CGEIT Certification Job Practice Job Practice A job practice serves as the basis for the exam and the experience requirements to earn the CGEIT certification. This job practice consists of task and knowledge
Contents. viii. List of figures List of tables OGC s foreword Chief Architect s foreword. 5 Continual Service Improvement methods and techniques 93
 iii Contents List of figures iv List of tables vi OGC s foreword vii Chief Architect s foreword viii Preface ix Acknowledgements xi 1 Introduction 1 1.1 Overview 3 1.2 Context 3 1.3 Purpose 7 1.4 Usage
Chapter 1. Software Engineering Supporting Processes
 Chapter 1 Software Engineering Supporting Processes 1. Introduction to IEEE/EIA Standard 12207.0-1996 IEEE/EIA Standard 12207.0-1996 establishes a common framework for software life cycle processes. The
Chapter 3. Information Systems Development. McGraw-Hill/Irwin. Copyright 2007 by The McGraw-Hill Companies, Inc. All rights reserved.
 Chapter 3 Information Systems Development McGraw-Hill/Irwin Copyright 2007 by The McGraw-Hill Companies, Inc. All rights reserved. Objectives 3-2 Describe the motivation for a system development process
Generating Supportive Hypotheses
 Generating Supportive Hypotheses in Introducing Formal Methods using a Software Process Improvement Model S. KUSAKABE, H. LIN, Y. OMORI, and K. ARAKI Grad. Sch. of Info. Sci. & Elec. Eng., Kyushu University
A Practical Guide to Implementing Levels 4 and 5
 A Practical Guide to Implementing Levels 4 and 5 CMMI Technology Conference & User Group 14-17 November 2005 Rick Hefner, Ph.D. Northrop Grumman Corporation Agenda An Overview of Levels 4 and 5 New Behaviors
Software Quality Management
 Software Quality Management Minsoo Ryu Hanyang University msryu@hanyang.ac.kr Outline Software Quality Model Software Quality Management Process and Quality Quality Metrics 2 2 What is Quality? Quality,
8. CMMI Standards and Certifications
 Computer Science and Software Engineering University of Wisconsin - Platteville 8. CMMI Standards and Certifications Yan Shi SE 3730 / CS 5730 Lecture Notes This note is partially based on http://www.sei.cmu.edu/reports/10tr033.pdf
Comparing Scrum And CMMI
 Comparing Scrum And CMMI How Can They Work Together Neil Potter The Process Group help@processgroup.com www.processgroup.com Version 1.0 1 Agenda Definition of Scrum Agile Principles Definition of CMMI
Using Pilots to Assess the Value and Approach of CMMI Implementation
 Using Pilots to Assess the Value and Approach of CMMI Implementation Godfrey, S., Andary, J., Rosenberg, L. NASA Goddard Space Flight Center, Greenbelt, Maryland, USA, 20771 Sara.H.Godfrey.1@gsfc.nasa.gov
Critical Design Decisions in the Development of the Standard for Process Assessment
 Critical Design Decisions in the Development of the Standard for Process Assessment Author Rout, Terry Published 2013 Conference Title Software Process Improvement and Capability Determination DOI https://doi.org/10.1007/978-3-642-38833-0_24
The Quality Paradigm. Quality Paradigm Elements
 The Quality Paradigm We shall build good ships here; at a profit if we can, at a loss if we must, but always good ships. motto used at Newport News Shipbuilding Quality Paradigm Elements Defining the nature
Software Quality Assurance Framework (SQA) Yujuan Dou 窦玉娟 2008/11/28
 Yujuan Dou 窦玉娟 2008/11/28") Software Quality Assurance Framework (SQA) Yujuan Dou 窦玉娟 2008/11/28 Whole Course Plan Software Quality Assurance Framework Test Requirement Test Planning Test Case Design Test Execution and Defect Management
Software Quality Assurance Framework (SQA) Yujuan Dou 窦玉娟 2008/11/28 Whole Course Plan Software Quality Assurance Framework Test Requirement Test Planning Test Case Design Test Execution and Defect Management
USING PILOTS TO ASSESS THE VALUE AND APPROACH OF CMMI IMPLEMENTATION. Goddard Space Flight Center (GSFC)
") USING PILOTS TO ASSESS THE VALUE AND APPROACH OF CMMI IMPLEMENTATION Goddard Space Flight Center (GSFC) Sally Godfrey, James Andary, Linda Rosenberg SEPG 2003 2/03 Slide 1 Agenda! Background " NASA Improvement
USING PILOTS TO ASSESS THE VALUE AND APPROACH OF CMMI IMPLEMENTATION Goddard Space Flight Center (GSFC) Sally Godfrey, James Andary, Linda Rosenberg SEPG 2003 2/03 Slide 1 Agenda! Background " NASA Improvement
An Overview of Software Process
 An Overview of Software Process Objectives To introduce the general phases of the software development life cycle (SDLC) To describe various generic software process models and discuss their pros and cons
Process Quality Levels of ISO/IEC 15504, CMMI and K-model
 Process Quality Levels of ISO/IEC 15504, CMMI and K-model Sun Myung Hwang Dept. of Computer Engineering Daejeon University, Korea sunhwang@dju.ac.kr 1. Introduction 1.1 Background The quality of a product
Using Lean Six Sigma to Accelerate CMMI Implementation
 Using Lean Six Sigma to Accelerate CMMI Implementation Briefers: Diane A. Glaser Michael D. Barnett US Army CECOM LCMC SEC CMMI Coordinator Communication Software ASQ SSGB Engineering Support Division
CMMI Level 2 for Practitioners: A Focused Course for Your Level 2 Efforts
 CMMI Level 2 for Practitioners: A Focused Course for Your Level 2 Efforts Software Engineering Institute Carnegie Mellon University Pittsburgh, PA 15213 Mary Beth Chrissis May 27, 2009 Report Documentation
The Explicit Relationship Between CMMI and Project Risks
 0 The Explicit Relationship Between CMMI and Project Risks NDIA 4th Annual CMMI Technology Conference & User Group November 16, 2004 Warren Scheinin Systems Engineer Northrop Grumman Corporation 1 Objectives
Patricia A Eglin David Consulting Group
 CMMI-SVC: What you need to know before you buy it Patricia A Eglin David Consulting Group Agenda What is a service? Process Areas/Continuous Representation Staged Representation CMMI-DEV versus CMMI-SVC
What is ISO/IEC 20000?
 An Introduction to the International Service Management Standard By President INTERPROM September 2018 Copyright 2018 by InterProm USA. All Rights Reserved www.interpromusa.com Contents INTRODUCTION...
Contents. viii. List of figures. List of tables. OGC s foreword. 6 Organizing for Service Transition 177. Chief Architect s foreword.
 iii Contents List of figures List of tables OGC s foreword Chief Architect s foreword Preface Acknowledgements v vii viii 1 Introduction 1 ix xi xii 1.1 Overview 3 1.2 Context 3 1.3 Goal and scope of Transition
A Real-Life Example of Appraising and Interpreting CMMI Services Maturity Level 2
 A Real-Life Example of Appraising and Interpreting CMMI Services Maturity Level 2 Neil Potter The Process Group help@processgroup.com www.processgroup.com SM CMM Integration, IDEAL, and SCAMPI are service
MIS Systems & Infrastructure Lifecycle Management 1. Week 9 March 17, 2016
 MIS 5203 Lifecycle Management 1 Week 9 March 17, 2016 Study Objectives Application Control related to Data and Transaction Software Development Processes and Quality Standards 2 Phase 1 Feasibility Phase
Teuvo Suntio. Quality Development Tools. Professor of Power Electronics at University of Oulu. Electronic System Design A TS Rev. 1.
 * * * Quality Development Tools Teuvo Suntio Professor of Power Electronics at University of Oulu Slide 1/25 Six Sigma: [1] S. G. Shina, Six Sigma for Electronics Design and Manufacturing, McGraw-Hill,
Deriving Software Acquisition Process from Maturity Models An Experience Report
 J. Software Engineering & Applications, 2010, 3: 280-286 doi:10.4236/jsea.2010.33034 Published Online March 2010 (http://www.scirp.org/journal/jsea) Deriving Software Acquisition Process from Maturity
7. Project Management
 Subject/Topic/Focus: 7. Project Management Management of Systems Engineering Processes Summary: Project management Systems engineering Maturity model and process improvement Literature: Ian Sommerville:
Moving Toward CMM Levels 4 and 5: Combining Models and Metrics to Achieve Quantitative Process Management
 Association for Information Systems AIS Electronic Library (AISeL) AMCIS 2000 Proceedings Americas Conference on Information Systems (AMCIS) 2000 Moving Toward CMM Levels 4 and 5: Combining Models and
Mapping of Fusion Process Model onto ISO/IEC 12207:2008
 Mapping of Fusion Model onto ISO/IEC 12207:2008 Rupinder Kaur; Jyotsna Sengupta Department of Computer Science; Punjabi University Patiala, India rupadeo@gmail.com Abstract Fusion Model is a component
Strategies for Transitioning to CMMI-SVC
 Strategies for Transitioning to CMMI-SVC CMMI Technology Conference and User Group 16-19 November 2009 Rick Hefner, Ph.D. Northrop Grumman Corporation rick.hefner@ngc.com Topics The Business Case for Adopting
Practical Application of the CMMI for Building a Strong Project Management Infrastructure
 Practical Application of the CMMI and PMBOK for Building a Strong Project Management Infrastructure PMI - NAC and DAU 3 rd Annual Professional Development Symposium Von Braun Center Huntsville, Alabama
CC and CMMI. An Approach to Integrate CC with Development
 CC and CMMI An Approach to Integrate CC with Development Wolfgang Peter TÜV Informationstechnik GmbH -TÜViT - Contents 1. Status Quo 2. CMMI for Development 3. Striking Analogies 4. Combining Standards
Maturing Measurement Capability The CMMI SM Measurement Thread and Recognized Industry Guidance - Standards
 Maturing Measurement Capability The CMMI SM Measurement Thread and Recognized Industry Guidance - Standards Kevin Richins, Measurement Lead Joe Jarzombek, PMP Software Technology Support Center (STSC)
Translate stakeholder needs into strategy. Governance is about negotiating and deciding amongst different stakeholders value interests.
 Principles Principle 1 - Meeting stakeholder needs The governing body is ultimately responsible for setting the direction of the organisation and needs to account to stakeholders specifically owners or
PRM - IT IBM Process Reference Model for IT
 PRM-IT V3 Reference Library - A1 Governance and Management Sysem PRM-IT Version 3.0 April, 2008 PRM - IT IBM Process Reference Model for IT Sequencing the DNA of IT Management Copyright Notice Copyright
Practical Process Improvement: the Journey and Benefits
 Practical Process Improvement: the Journey and Benefits 27-29 September 2004 Colin Connaughton AMS Metrics Consultant CMM, Capability Maturity Model, and Capability Maturity Modeling are registered in
TrialStat Corporation: On Schedule with High Quality and Cost Savings for the Customer*
 with High Quality and Cost Savings for the Customer* By Khaled El Emam Background The Organization and Its Products TrialStat Corporation is a small software company in Canada that develops software for
DEVELOPING A CONFIGURATION MANAGEMENT MODEL FOR USE IN THE MEDICAL DEVICE INDUSTRY
 DEVELOPING A CONFIGURATION MANAGEMENT MODEL FOR USE IN THE MEDICAL DEVICE INDUSTRY Fergal McCaffery Lero The Irish Software Engineering Research Centre, University of Limerick, Ireland Fergal.McCaffery@dkit.ie
Software Process - Standards, Assessments and Improvement
 Chapter 2 Software Process - Standards, Assessments and Improvement (1) Chapter Editor: Wolfgang Emmerich (WE) (2) Participants: AF, CM, JCD (3) Software engineering and software process improvement standards
Given the competitive importance of
 Making Work A successful measurement process becomes a way of doing business. is embedded in the organization, and performance improves because people are making fact-based decisions. This article describes
Software Process Evaluation
 Software Process IV Software Process Evaluation Today we will look at methods for evaluating and improving software processes, regardless of which process is being used J.S. Bradbury, J.R. Cordy CSCI 3060U