PRINCIPLES AND APPLICATIONS OF SPECIAL EDUCATION ASSESSMENT
|
|
|
- Rhoda Owens
- 6 years ago
- Views:
Transcription
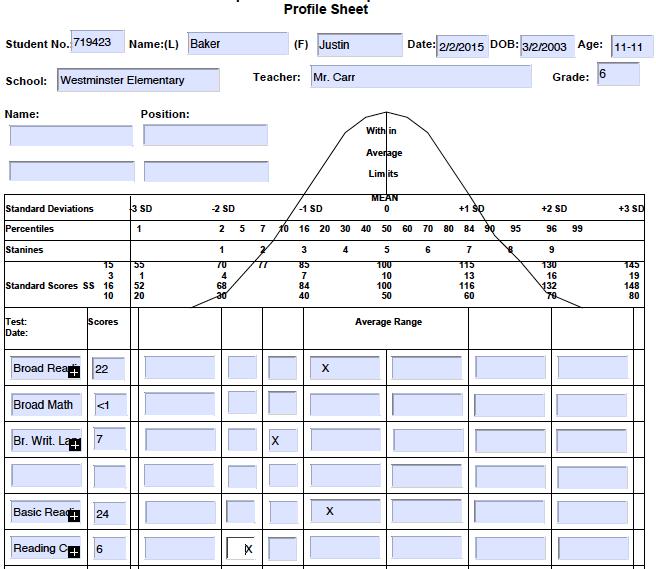
1 PRINCIPLES AND APPLICATIONS OF SPECIAL EDUCATION ASSESSMENT CLASS 3: DESCRIPTIVE STATISTICS & RELIABILITY AND VALIDITY FEBRUARY 2, 2015
2 OBJECTIVES Define basic terminology used in assessment, such as validity, reliability, standard deviation, etc. Understand how to evaluate the technical adequacy of tests including the norms, reliability, and validity. Interpret information from formal and informal assessments. Describe the function of standardized assessment in the eligibility process.
3 TONIGHT S SCHEDULE 4:30 4:45 Group Presentations Utah SPED Rules 4:45 5:15 Problem-Solving Teams Case Studies 5:15 6:00 Descriptive Statistics 6:00 6:15 Break 6:15 7:00 Reliability & Validity 7:00 7:20 Graduate Students Annotated Bibliography
4 REVIEW Children can not be determined to have a disability because of what? Describe each of the following: RIOT/ICEL RTI and its relationship to the medical model LRE Components of an IEP
5 CRITERION OR NORM-REFERENCED? WISC-IV (Intelligence Test) History test Correct words on a spelling test Woodcock Johnson Achievement Test III Driving Test Number of steps correctly performed in a dressing routine.
6 WHY IS MEASUREMENT IMPORTANT? Standardized assessment is heavily applied in the educational decision-making process. Educators must understand Test-selection criteria Basic principles of measurement Administration techniques Scoring procedures
7 CONCERNS IN THE FIELD High priority placed on assessment Mistakes made by professionals: Identified students based upon referral information and not testing. Data presented played little role in planning. Choosing poor-quality instruments. Taking the recommendation at face value. Using quick assessments even if those assessments do not address the areas of concern. Failure to establish effective rapport with the examinee. Failure to document behaviors during the examination that may be of diagnostic value. Failure to adhere to the administration rules. Making scoring errors. Ineffectively interpreting assessment results for educational use.
8 NUMERICAL SCALES Nominal Scale Used for identification purposes only; the numbers function like a name (e.g., an ID number) Numbers cannot be used in mathematical operations Least useful scale
9 NUMERICAL SCALES Ordinal Scale Used to rank the order of items Numbers have the quality of identification and indicate greater or lesser quality (e.g., first place, second place, etc.) Numbers are not equidistant (i.e., the distance between first and second place and second and third place is not necessarily the same)
10 NUMERICAL SCALES Ratio Scale Used for direct comparisons and mathematical manipulations Numbers are equidistant from each other Numbers have a true meaning of absolute zero Can be used in all mathematical operations (e.g., counts of behaviors, income, height, weight, etc.)
11 NUMERICAL SCALES Interval Scale Used for identification that rank greater or lesser quality or amount Numbers are equidistant (e.g., degrees on a thermometer, IQ Scores, rating scales). Most data in education will be interval scale data. Does not have an absolute-zero quality Numbers cannot be used in other mathematical operations (e.g., multiplication)
12 RAW SCORES Scores an individual receives when individual items on tests are summed. Raw scores convey very little meaning unless referenced to some standard. Subtract the number of items students missed from the number of items presented. All other scores, derived scores, are derived from the raw score.
13 DESCRIPTIVE STATISTICS Large sets of data are organized and understood through methods known as descriptive statistics. Derived scores obtain meaning from large sets of data or large samples of scores. Scores derived from the raw score include: Percentile rank Standard score Grade equivalent Age equivalent
14 MEASURES OF CENTRAL TENDENCY Measures of Central Tendency: A way to organize data to see how the data cluster, or are distributed around a numerical representation of the average score. Caution using this technique if your scores are widely scattered. A normal distribution represents the way test scores would fall if a test was given to every single student of the same age or grade in the population. Most students scores fall in the middle of the curve Distribution is symmetric or equal on either side of the vertical line. Fewer students scores fall at the edges of the curve
15 AVERAGE PERFORMANCE It is important to know how students performed as a group and what constitutes excellent, average, and poor performance. Frequency Distribution Rank scores from highest to lowest. Tally how many of each score was obtained. Mode The score that occurs the most number of times. Bimodal Distribution The distribution has two modes. Multimodal Distribution A distribution with three or more modes. Frequency Polygon A graph that represents a data set.
16 MODE & FREQUENCY POLYGON Mode
17 MEDIAN Median Found by rank ordering the data set, writing each score the number of times it occurs. Count halfway down the list of scores; 50% of the data are listed above the median and 50% are below. In a data set with an even number of scores, the median score may not actually exist in the data set.
18 MEDIAN EXAMPLES Median Score Median Score
19 MEAN One of the best measures of average performance is the mean. The mean is found by calculating simple average. Mean can be affected by extreme scores, especially if the group is composed of only a few students. Can be controlled by eliminating extreme scores (i.e., outliers). Example: Data set: 90, 80, 75, 60, 70, 65, 80, 100, 80, = 78
20 MEASURES OF DISPERSION Measures of dispersion are used to calculate how scores are spread from the mean. Variability is the way that scores in a set of data are spread apart. Range Provides an idea about the spread. Calculated by subtracting the lowest score from the highest score. Example: Top score = 100; Lowest score = = 55
21 VARIANCE Data are described as having variance. Variance can be described as the degree or amount of variability or dispersion in a set of scores. The dispersion of a set of scores around the mean Applicable for Equal Interval & Ratio, not Nominal or Ordinal
22 STANDARD DEVIATION Standard deviation is one determined typical unit above and below the score of 100. Standard deviation is one method of calculating difference in scores or variability of scores known as dispersion. Must calculate variance before you can calculate standard deviation. Standard Deviation = variance Any test score that is 1 standard deviation above or below the mean score is considered significant. Applicable for Equal Interval & Ratio, not Nominal or Ordinal
23 STANDARD DEVIATION & NORMAL DISTRIBUTION In a normal distribution, the standard deviations represent the percentages of scores shown on the bell curve. More than 68% of the scores fall within one standard deviation above or below the mean. Two standard deviations below the mean = Intellectual Disability Two standard deviations above the mean = Gifted
24
25 SKEWED DISTRIBUTIONS When small samples or very restricted populations are used, test results may not distribute into a normal curve. Extreme scores can change the appearance of a set of scores and subsequently influence the way the data are described. Distributions can be skewed in a positive or negative direction. Negatively Skewed: Large number of scores occur above the mean. Positively Skewed: Large number of scores occur below the mean.
26 TYPES OF SCORES Percentile Rank Rank each score on the continuum of the normal distribution Percentiles range from <1% to 99.9%, with 50 being the average. A person who scores at the 75%tile scored as well or better than 75% of the students in that age/grade group.
27 Percentile Rank For example: Jalen obtained a percentile rank of 42. This means that Jalen performed as well as or better than 42% of children his age on the test. Or, 42% of children Jalen's age scored at or below Jalen's score.
28 Descriptors for Percentile Ranges Percentile Range Descriptor 98 th %ile and Above Upper Extreme 91 st to 97 th %ile Well Above Average 75 th to 90 th %ile Above Average 25 th to 74 th %ile Average 9 th to 24 th %ile Below Average 3 rd to 8 th %ile Well Below Average 2 nd %ile and Below Lower Extreme
29 TYPES OF SCORES T scores Have an average of 50 and standard deviation of 10 Stanines Scores are divided into 9 groups with 5 being the mean and 2 being the standard deviation Deciles Scores are divided into 10 groups, 10 for the lowest group, 100 for the highest Each group represents 10% of the obtained scores.

30 STANDARD SCORES Standard scores are scores of relative standing with a set, fixed, predetermined mean and standard deviation
31
32
33 CHOICE OF TEST SCORES Percentile Ranks Preferable over age and grade equivalents Are considered comparable scores Straightforward indicators of an individual s standing within a group Reported as a reference to the student s standing to the group upon which the test was normed
34 CHOICE OF TEST SCORES (CONTINUED) Standard Scores Advantages Comparative Based upon a normal or normalized distribution of scores (bell curve) Can be directly translated into percentile ranks Because of a uniform mean (bell curve), they can be compared from one subtest to the next and one test administration to another.
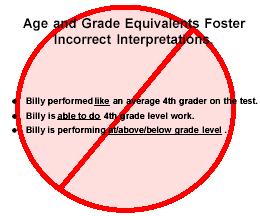
35 CHOICE OF TEST SCORES (CONTINUED) Age and Grade Equivalents: Appear to be the simplest, but in fact, they can be the most misinterpreted. Major limitations: Do not provide information about whether student s performance is within average limits. Do not describe a student s current instructional level. Do not indicate what test questions the student answered correctly. A word of caution: Findings should be reported and worded carefully to prevent misinterpretation.

36 GRADE EQUIVALENTS ARE OBTAINED FROM MEAN OR MEDIAN SCORES BY GRADE.
37
38 MISLEADING: FALSE IMPRESSION OF PROGRESS Grade Placement Grade Equivalent Years Below Percentile Rank th th th th th th
39 AGE AND GRADE EQUIVALENTS What are the scores based on? Why is this a problem? 1) ) 3) 4) ) 6) 7) 8) 9) 10) 11) 12) Chelyn only gets the even # questions correct Raw Score = 6 Lou only gets the odd # questions correct Raw Score = 6 DO THESE STUDENTS HAVE THE SAME SKILLS?
40 AGE & GRADE EQUIVALENTS 2 years below grade has different meanings at different grades Kurt is at the 12.5 grade level and obtained a grade equivalent of 10.5 on the Reading Recognition Subtest of the PIAT. Mason is at the 3.5 grade level and obtained a grade equivalent of 1.5 on the same test. Is their performance the same? Who performed better? Kurt obtained a standard score of 93, 33rd percentile Mason obtained a standard score of 72, 3rd percentile
41 GRADE EQUIVALENTS MEAN DIFFERENT THINGS ON DIFFERENT TESTS Billy, grade placement 7.5, obtained a grade equivalent of 5.5 on the WRMT. Bobby, grade placement 7.5, obtained a grade equivalent of 5.5 on the Reading Subtest of the WRAT. Is their performance the same? Who performed better? Billy performed at the 18th percentile Bobby performed at the 34th percentile At the same point on the scale and the same age level, identical grade equivalents mean different things on different tests.
42 RELIABILITY & VALIDITY
43 RELIABILITY & VALIDITY Aids in determining test accuracy and dependability Reliability the dependability or consistency of an instrument across time or items. Validity the degree to which an instrument measures what it was designed to measure. Instruments should have both properties but may have only one (not that strong of an instrument)
44 Correlation (r) Correlation the degree of relationship between two variables. Two administrations of the same test Administration of equivalent forms Correlation coefficient ranges: to Perfect positive correlation = Perfect negative correlation = No correlation = 0 Numbers closer to represent stronger relationships The greater degree of the relationship, the more reliable the instrument. The + does not indicate strength, but direction.
45 SCATTERGRAM Scattergrams provide a graphic representation of a data set and show a correlation. The more closely the dots on a scattergram approximate a straight line, the nearer to perfect the correlation.
46 TYPES OF CORRELATION POSITIVE CORRELATION NEGATIVE CORRELATION No Correlation Variables with a positive relationship move in the same direction. Scores on variables increase simultaneously. High scores on one variable are associated with low scores on another variable. n n When data from two variables are not associated or have no relationship. No linear direction on a scattergram
47 RELATIONSHIP BETWEEN RELIABIITY & VALIDITY On the other hand, if I have a correctly printed measuring tape Suppose I have a faulty measuring tape and I use it to measure each student s height. My tool is invalid, but it s still reliable. My tool is both valid and reliable.
48 RELIABILITY Another way to think of reliability is to imagine a kitchen scale. If you weigh five pounds of potatoes in the morning, and the scale is reliable, the same scale should register five pounds for the potatoes an hour later.
49 VALIDITY Let s imagine a bathroom scale that consistently tells you that you weigh 130 pounds. The reliability (consistency) of this scale is very good, but it is not accurate (valid) because you actually weigh 150 pounds (perhaps you re-set the scale in a weak moment).
50 RELIABILITY CHECKS Test-Retest (Stability) Equivalent Forms Inter-Rater (Agreement)
51 TEST-RETEST RELIABILITY Test-retest reliability the trait being measured is one that is stable over time. If the trait being measured remains constant, the re-administration of the instrument will result in scores similar to the first score. Important to conduct re-test shortly after first test to control for influencing variables. Difficulties: Too soon: Students may remember test items (practice effect) and score higher the second time. Too far: Greater influence of time variables (e.g., learning, maturation, etc.)
52 EQUIVALENT (ALTERNATE) FORMS RELIABILITY Equivalent forms reliability Two forms of the same instrument are used. Items are matched for difficulty. Advantage: Two tests of the same difficulty level that can be administered within a short time frame without the influence of practice effects.
53 INTERRATER RELIABILITY Interrater reliability The consistency of a test across examiners. One person administers a test, a second person rescores the test. The scores are then correlated to determine how much variability exists between the scores.
54 ASSUMPTIONS OF TESTING 1. People involved are skilled 2. Error is always present 3. Acculturation is comparable 4. Behavior sample is adequate 5. Present behavior is observed
55 1. PEOPLE ARE SKILLED: in administering the test - including establishing rapport in scoring the test in interpreting the results in utilizing the results
56 2. ERROR IS ALWAYS PRESENT Obtained Score = True Score + Error Random error is unreliability e.g., lack of familiarity with tests, examiner fatigue, etc. Do not make decisions based on error
57 3. ACCULTURATION IS COMPARABLE The comparison group has comparable Experiential Background Test item asking about how to get out of a forest for an inner city child. Opportunity to Learn Books available in the child s home
58 4. BEHAVIOR SAMPLE IS ADEQUATE All tests are only samples of behavior. Samples of Behaviors on Test Domain of Behaviors of Interest
59 5. PRESENT BEHAVIOR IS OBSERVED Future behavior is inferred. Tests can only inform us directly about present behavior.
60 TEST VALIDITY Does the test actually measure what it is supposed to measure? Criterion-related validity: Comparing scores with other criteria known to be indicators of the same trait or skill Concurrent Validity: Two tests are given within a very short timeframe (often the same day). If scores are similar, the tests are said to be measuring the same trait. Predictive Validity: Measures how well an instrument can predict performance on some other variable (e.g, ACT or GRE scores).
61 CONTENT VALIDITY Ensuring that the items in a test are representative of content purported to be measured. PROBLEM: Teachers often generalize and assume the test covers more than it does (e.g., the WRAT-3 reading subtest only measures word recognition not phonemic awareness, phonics, vocabulary, reading comprehension, etc.). Some of the variables of content validity may influence the manner in which results are obtained and can contribute to bias in testing. Presentation Format: The method by which items are presented to the student Response Mode: The method for the examinee to answer items.
62 VALIDITY OF TEST ~V~ VALIDITY OF USE Tests may be used inappropriately even though they are valid instruments. Results obtained may be used in an invalid manner. Tests may be biased and/or discriminate against different groups. Item bias, when an item is answered incorrectly a disproportionate number of times by one group compared to another. Predictive validity may predict accurately for one group and not another.
63 NEXT WEEK Read Chapter 5 Submit Online Self-Assessment
64 SOURCES Overton, T. (2012). Assessing learners with special needs (7 th ed.). Upper Saddle River, NJ: Pearson Education Inc.
UNIVERSIlY OF SWAZILAND. FACULlY OF EDUCATION DEPARTMENT OF EDUCATIONAL FOUNDATIONS AND MANAGEMENT SUPPLEMENTARY EXAMINATION PAPER 2012/2013
 UNIVERSIlY OF SWAZILAND FACULlY OF EDUCATION DEPARTMENT OF EDUCATIONAL FOUNDATIONS AND MANAGEMENT SUPPLEMENTARY EXAMINATION PAPER 2012/2013 TITLE OF PAPER: COURSE NUMBER: MEASUREMENT AND TESTING EDF321PGCE
Standardized Measurement and Assessment
 Standardized Measurement and Assessment Measurement Identify dimensions, quantity, capacity, or degree of something Assign a symbol or number according to rules (e.g., assign a number for height in inches
KeyMath Revised: A Diagnostic Inventory of Essential Mathematics (Connolly, 1998) is
 is") KeyMath Revised Normative Update KeyMath Revised: A Diagnostic Inventory of Essential Mathematics (Connolly, 1998) is an individually administered, norm-referenced test. The 1998 edition is a normative
KeyMath Revised Normative Update KeyMath Revised: A Diagnostic Inventory of Essential Mathematics (Connolly, 1998) is an individually administered, norm-referenced test. The 1998 edition is a normative
Glossary of Standardized Testing Terms https://www.ets.org/understanding_testing/glossary/
 Glossary of Standardized Testing Terms https://www.ets.org/understanding_testing/glossary/ a parameter In item response theory (IRT), the a parameter is a number that indicates the discrimination of a
VIII. STATISTICS. Part I
 VIII. STATISTICS Part I IN THIS CHAPTER: An introduction to descriptive statistics Measures of central tendency: mean, median, and mode Measures of spread, dispersion, and variability: range, variance,
Chapter 3 Norms and Reliability
 Chapter 3 Norms and Reliability - This chapter concerns two basic concepts: o Norms o Reliability - Scores on psychological tests are interpreted by reference to norms that are based on the distribution
Kaufman Test of Educational Achievement Normative Update. The Kaufman Test of Educational Achievement was originally published in 1985.
 Kaufman Test of Educational Achievement Normative Update The Kaufman Test of Educational Achievement was originally published in 1985. In 1998 the authors updated the norms for the test, and it is now
Statistical Analysis. Chapter 26
 Statistical Analysis Chapter 26 Short Description Background Strategic Rationale & Implications Strengths & Advantages Weaknesses & Limitations Process for Applying Technique FAROUT Ch26.2 Short Description
Kaufman Test of Educational Achievement - Third Edition
 Kaufman Test of Educational Achievement - Third Edition (KTEA-3) Administration and Scoring Learning Outcomes PARTICIPANTS WILL BE ABLE TO: Identify KTEA-3 features & materials Identify when to use the
STAT 2300: Unit 1 Learning Objectives Spring 2019
 STAT 2300: Unit 1 Learning Objectives Spring 2019 Unit tests are written to evaluate student comprehension, acquisition, and synthesis of these skills. The problems listed as Assigned MyStatLab Problems
Woodcock Reading Mastery Test Revised (WRM)Academic and Reading Skills
Academic and Reading Skills") Woodcock Reading Mastery Test Revised (WRM)Academic and Reading Skills PaTTANLiteracy Project for Students who are Deaf or Hard of Hearing A Guide for Proper Test Administration Kindergarten, Grades 1,
Woodcock Reading Mastery Test Revised (WRM)Academic and Reading Skills PaTTANLiteracy Project for Students who are Deaf or Hard of Hearing A Guide for Proper Test Administration Kindergarten, Grades 1,
Statistics Definitions ID1050 Quantitative & Qualitative Reasoning
 Statistics Definitions ID1050 Quantitative & Qualitative Reasoning Population vs. Sample We can use statistics when we wish to characterize some particular aspect of a group, merging each individual s
Stanford 10 (Stanford Achievement Test Series, Tenth Edition)
") Stanford 10: over VIEW Stanford 10 (Stanford Achievement Test Series, Tenth Edition) Multiple-choice assessment of academic achievement. Grade Range: K 12 Completion Time: Untimed with flexible guidelines.
Stanford 10: over VIEW Stanford 10 (Stanford Achievement Test Series, Tenth Edition) Multiple-choice assessment of academic achievement. Grade Range: K 12 Completion Time: Untimed with flexible guidelines.
FOR TRAINING ONLY! Score Report. DAS II: School Age Battery CORE BATTERY. Core Cluster and Composite Scores and Indexes
 Score Report Student Name Date of Report 2/25/2013 Student ID Grade 2 Date of Birth 2/11/2005 Home Language English Gender Male Handedness Right Race/Ethnicity White not Hispanic Origin Examiner Name Amy
Distinguish between different types of numerical data and different data collection processes.
 Level: Diploma in Business Learning Outcomes 1.1 1.3 Distinguish between different types of numerical data and different data collection processes. Introduce the course by defining statistics and explaining
GETTING READY FOR DATA COLLECTION
 3 Chapter 7 Data Collection and Descriptive Statistics CHAPTER OBJECTIVES - STUDENTS SHOULD BE ABLE TO: Explain the steps in the data collection process. Construct a data collection form and code data
Bar graph or Histogram? (Both allow you to compare groups.)
") Bar graph or Histogram? (Both allow you to compare groups.) We want to compare total revenues of five different companies. Key question: What is the revenue for each company? Bar graph We want to compare
Bar graph or Histogram? (Both allow you to compare groups.) We want to compare total revenues of five different companies. Key question: What is the revenue for each company? Bar graph We want to compare
Glossary of Terms Ability Accommodation Adjusted validity/reliability coefficient Alternate forms Analysis of work Assessment Band Battery
 1 1 1 0 1 0 1 0 1 Glossary of Terms Ability A defined domain of cognitive, perceptual, psychomotor, or physical functioning. Accommodation A change in the content, format, and/or administration of a selection
Central Tendency. Ch 3. Essentials of Statistics for the Behavior Science Ch.3
 Central Tendency Ch 3 Ch. 3 Central Tendency 3.1 Introduction 3.2 Mean 3.3 Median 3.4 Mode 3.5 Selecting a Measure of Central Tendency 3.6 Central Tendency & Shape of the Distribution Summary 3.1 Introduction
Section Sampling Techniques. What You Will Learn. Statistics. Statistics. Statisticians
 Section 13.1 Sampling Techniques What You Will Learn Sampling Techniques Random Sampling Systematic Sampling Cluster Sampling Stratified Sampling Convenience Sampling 13.1-2 Statistics Statistics is the
Statistics: General principles
 Statistics: General principles Statistics are simply ways to measure things and to describe relationships between things, using numbers. Part of the confusion that many people experience when they begin
Score Report. Client Information
 Score Report Client Information Name: SAMPLE CLIENT Client ID: SC1 Test date: 4/17/2015 Date of birth: 5/30/2009 Age: 5 yrs 10 mo Gender: (not specified) Ethnicity: (not specified) Examiner: ChAMP discrepancies
Clovis Community College Class Assessment
 Class: Math 110 College Algebra NMCCN: MATH 1113 Faculty: Hadea Hummeid 1. Students will graph functions: a. Sketch graphs of linear, higherhigher order polynomial, rational, absolute value, exponential,
Screening Score Report
 Screening Score Report by Steven Feifer, DEd, Heddy Kovach Clark, PhD, and PAR Staff Client Information Client name : Sample Client Client ID : FAMSAMP Test date : 05/12/2016 Date of birth : 02/02/2003
Module - 01 Lecture - 03 Descriptive Statistics: Graphical Approaches
 Introduction of Data Analytics Prof. Nandan Sudarsanam and Prof. B. Ravindran Department of Management Studies and Department of Computer Science and Engineering Indian Institution of Technology, Madras
3.2 Measures of Central Tendency
 3.2 Measures of Central Tendency In statistics, the three most commonly used measures of central tendency are the mean, median, and mode. Each of these measures has its particular advantages and disadvantages
Understanding and Interpreting Pharmacy College Admission Test Scores
 REVIEW American Journal of Pharmaceutical Education 2017; 81 (1) Article 17. Understanding and Interpreting Pharmacy College Admission Test Scores Don Meagher, EdD NCS Pearson, Inc., San Antonio, Texas
Diagnostic Online Math Assessment: Technical Document. Published by Let s Go Learn, Inc.
 Diagnostic Online Math Assessment: Technical Document Published by Let s Go Learn, Inc. Table of Contents Diagnostic Online Math Assessment Specifications... 3 ADAM: K-7 & DOMA: Basic Math Skills...3 DOMA:
Students will understand the definition of mean, median, mode and standard deviation and be able to calculate these functions with given set of
 Students will understand the definition of mean, median, mode and standard deviation and be able to calculate these functions with given set of numbers. Also, students will understand why some measures
Introduction to Statistics. Measures of Central Tendency
 Introduction to Statistics Measures of Central Tendency Two Types of Statistics Descriptive statistics of a POPULATION Relevant notation (Greek): µ mean N population size sum Inferential statistics of
The Standardized Reading Inventory Second Edition (Newcomer, 1999) is an
 is an") Standardized Reading Inventory Second Edition (SRI-2) The Standardized Reading Inventory Second Edition (Newcomer, 1999) is an individually administered, criterion-referenced measure for use with students
Standardized Reading Inventory Second Edition (SRI-2) The Standardized Reading Inventory Second Edition (Newcomer, 1999) is an individually administered, criterion-referenced measure for use with students
AP Statistics Scope & Sequence
 AP Statistics Scope & Sequence Grading Period Unit Title Learning Targets Throughout the School Year First Grading Period *Apply mathematics to problems in everyday life *Use a problem-solving model that
ALTE Quality Assurance Checklists. Unit 1. Test Construction
 ALTE Quality Assurance Checklists Unit 1 Test Construction Name(s) of people completing this checklist: Which examination are the checklists being completed for? At which ALTE Level is the examination
Scoring & Reporting Software
 Scoring & Reporting Software Joe is proud that, with G. MADE, his test-taking skills no longer hold him back from showing his math teacher how much he has learned. Sample Reports Level 4 Efficient and
Lecture 10. Outline. 1-1 Introduction. 1-1 Introduction. 1-1 Introduction. Introduction to Statistics
 Outline Lecture 10 Introduction to 1-1 Introduction 1-2 Descriptive and Inferential 1-3 Variables and Types of Data 1-4 Sampling Techniques 1- Observational and Experimental Studies 1-6 Computers and Calculators
Chapter 3. Displaying and Summarizing Quantitative Data. 1 of 66 05/21/ :00 AM
 Chapter 3 Displaying and Summarizing Quantitative Data D. Raffle 5/19/2015 1 of 66 05/21/2015 11:00 AM Intro In this chapter, we will discuss summarizing the distribution of numeric or quantitative variables.
Applying the Principles of Item and Test Analysis
 Applying the Principles of Item and Test Analysis 2012 Users Conference New Orleans March 20-23 Session objectives Define various Classical Test Theory item and test statistics Identify poorly performing
ALTE Quality Assurance Checklists. Unit 1. Test Construction
 s Unit 1 Test Construction Name(s) of people completing this checklist: Which examination are the checklists being completed for? At which ALTE Level is the examination at? Date of completion: Instructions
Chapter 1 Data and Descriptive Statistics
 1.1 Introduction Chapter 1 Data and Descriptive Statistics Statistics is the art and science of collecting, summarizing, analyzing and interpreting data. The field of statistics can be broadly divided
CHAPTER 4. Labeling Methods for Identifying Outliers
 CHAPTER 4 Labeling Methods for Identifying Outliers 4.1 Introduction Data mining is the extraction of hidden predictive knowledge s from large databases. Outlier detection is one of the powerful techniques
Introducing WISC-V Spanish Anise Flowers, Ph.D.
 Introducing Introducing Assessment Consultant Introducing the WISC V Spanish, a culturally and linguistically valid test of cognitive ability in Spanish for use with Spanish-speaking children ages 6:0
Math 1 Variable Manipulation Part 8 Working with Data
 Name: Math 1 Variable Manipulation Part 8 Working with Data Date: 1 INTERPRETING DATA USING NUMBER LINE PLOTS Data can be represented in various visual forms including dot plots, histograms, and box plots.
Math 1 Variable Manipulation Part 8 Working with Data
 Math 1 Variable Manipulation Part 8 Working with Data 1 INTERPRETING DATA USING NUMBER LINE PLOTS Data can be represented in various visual forms including dot plots, histograms, and box plots. Suppose
Computing Descriptive Statistics Argosy University
 2014 Argosy University 2 Computing Descriptive Statistics: Ever Wonder What Secrets They Hold? The Mean, Mode, Median, Variability, and Standard Deviation Introduction Before gaining an appreciation for
Ante s parents have requested a cognitive and emotional assessment so that Ante can work towards fulfilling his true potential.
 55 South Street Strathfield 2135 0417 277 124 Name: Ante Orlovic Date Of Birth: 5/6/2001 Date Assessed: 27/5/2013 Reason for Referral: Test Administered: Cognitive Assessment Wechsler Intelligence Scale
Chapter 8 Script. Welcome to Chapter 8, Are Your Curves Normal? Probability and Why It Counts.
 Chapter 8 Script Slide 1 Are Your Curves Normal? Probability and Why It Counts Hi Jed Utsinger again. Welcome to Chapter 8, Are Your Curves Normal? Probability and Why It Counts. Now, I don t want any
Introduction to Statistics. Measures of Central Tendency and Dispersion
 Introduction to Statistics Measures of Central Tendency and Dispersion The phrase descriptive statistics is used generically in place of measures of central tendency and dispersion for inferential statistics.
Assessment Report. Name: Roel Maldonado Date of Assessment: October 8 November 12, 2014 Date of Birth: 04/07/2005 Date of Report: November 13, 2014
 Page 1 Assessment Report Name: Roel Maldonado Date of Assessment: October 8 November 12, 2014 Date of Birth: 04/07/2005 Date of Report: School: TEC: Lewisville Examiner: Sara Davis Age: 9 years, 7 months
10.2 Correlation. Plotting paired data points leads to a scatterplot. Each data pair becomes one dot in the scatterplot.
 10.2 Correlation Note: You will be tested only on material covered in these class notes. You may use your textbook as supplemental reading. At the end of this document you will find practice problems similar
Statistics Chapter 3 Triola (2014)
") 3-1 Review and Preview Branches of statistics Descriptive Stats: is the branch of stats that involve the organization, summarization, and display of data Inferential Stats: is the branch of stats that
3-1 Review and Preview Branches of statistics Descriptive Stats: is the branch of stats that involve the organization, summarization, and display of data Inferential Stats: is the branch of stats that
Section 9: Presenting and describing quantitative data
 Section 9: Presenting and describing quantitative data Australian Catholic University 2014 ALL RIGHTS RESERVED. No part of this work covered by the copyright herein may be reproduced or used in any form
STAT/MATH Chapter3. Statistical Methods in Practice. Averages and Variation 1/27/2017. Measures of Central Tendency: Mode, Median, and Mean
 STAT/MATH 3379 Statistical Methods in Practice Dr. Ananda Manage Associate Professor of Statistics Department of Mathematics & Statistics SHSU 1 Chapter3 Averages and Variation Copyright Cengage Learning.
Measurement and Scaling Concepts
 Business Research Methods 9e Zikmund Babin Carr Griffin Measurement and Scaling Concepts 13 Chapter 13 Measurement and Scaling Concepts 2013 Cengage Learning. All Rights Reserved. May not be scanned, copied
Descriptive Statistics Tutorial
 Descriptive Statistics Tutorial Measures of central tendency Mean, Median, and Mode Statistics is an important aspect of most fields of science and toxicology is certainly no exception. The rationale behind
AP Statistics Part 1 Review Test 2
 Count Name AP Statistics Part 1 Review Test 2 1. You have a set of data that you suspect came from a normal distribution. In order to assess normality, you construct a normal probability plot. Which of
Chapter Standardization and Derivation of Scores
 19 3 Chapter Standardization and Derivation of Scores This chapter presents the sampling and standardization procedures used to create the normative scores for the UNIT. The demographic characteristics
The 1995 Stanford Diagnostic Reading Test (Karlsen & Gardner, 1996) is the fourth
 is the fourth") Stanford Diagnostic Reading Test 4 The 1995 Stanford Diagnostic Reading Test (Karlsen & Gardner, 1996) is the fourth edition of a test originally published in 1966. The SDRT4 is a group-administered diagnostic
Stanford Diagnostic Reading Test 4 The 1995 Stanford Diagnostic Reading Test (Karlsen & Gardner, 1996) is the fourth edition of a test originally published in 1966. The SDRT4 is a group-administered diagnostic
PARENT REPORT. Tables and Graphs Report for WNV and WIAT-II. Copyright 2008 by Pearson Education, Inc. or its affiliate(s). All rights reserved.
. All rights reserved.") PARENT REPORT Tables and Graphs Report for WNV and WIAT-II EXAMINEE: WNV Age REPORT DATE: 10/5/2006 AGE: 6 years GRADE: Not Specified DATE OF BIRTH: 10/5/2000 ETHNICITY: Not Specified EXAMINEE ID: Not
PARENT REPORT Tables and Graphs Report for WNV and WIAT-II EXAMINEE: WNV Age REPORT DATE: 10/5/2006 AGE: 6 years GRADE: Not Specified DATE OF BIRTH: 10/5/2000 ETHNICITY: Not Specified EXAMINEE ID: Not
Chapter 5. Statistical Reasoning
 Chapter 5 Statistical Reasoning Measures of Central Tendency Back in Grade 7, data was described using the measures of central tendency and range. Central tendency refers to the middle value, or perhaps
RIST-2 Score Report. by Cecil R. Reynolds, PhD, and Randy W. Kamphaus, PhD
 RIST-2 Score Report by Cecil R. Reynolds, PhD, and Randy W. Kamphaus, PhD Client name: Sample Client Client ID: SC Gender: Female Age: 23 : 0 Ethnicity: Asian/Pacific Islander Test date: 02/29/2016 Date
GLOSSARY OF COMPENSATION TERMS
 GLOSSARY OF COMPENSATION TERMS This compilation of terms is intended as a guide to the common words and phrases used in compensation administration. Most of these are courtesy of the American Compensation
educationhubnepal.wordpress.com Course Title: Measurement and Evaluation in Education Level: M. Ed. Credit Hours: 3 Semester: Third Teaching Hours: 48
 Course Title: Measurement and Evaluation in Education Course No.: Ed. 531 Nature of course: Theoretical Level: M. Ed. Credit Hours: 3 Semester: Third Teaching Hours: 48 1. Course Description This is a
Audit - The process of conducting an evaluation of an entity's compliance with published standards. This is also referred to as a program audit.
 Glossary 1 Accreditation - Accreditation is a voluntary process that an entity, such as a certification program, may elect to undergo. In accreditation a non-governmental agency grants recognition to the
7 Statistical characteristics of the test
 7 Statistical characteristics of the test Two key qualities of an exam are validity and reliability. Validity relates to the usefulness of a test for a purpose: does it enable well-founded inferences about
TDWI strives to provide course books that are contentrich and that serve as useful reference documents after a class has ended.
 Previews of TDWI course books offer an opportunity to see the quality of our material and help you to select the courses that best fit your needs. The previews cannot be printed. TDWI strives to provide
Analyzing Language & Literacy using the WMLS-R
 Analyzing Language & Literacy using the WMLS-R CRISTINA HUNTER ERIC WILLIAMSON TWIN Academy 2017 Part 1: What the assessment tells us about language acquisition? How can it be used to inform teaching and
The uses of the WISC-III and the WAIS-III with people with a learning disability: Three concerns
 The uses of the WISC-III and the WAIS-III with people with a learning disability: Three concerns By Simon Whitaker Published in Clinical Psychology, 50 July 2005, 37-40 Summary From information in the
ISO 13528:2015 Statistical methods for use in proficiency testing by interlaboratory comparison
 ISO 13528:2015 Statistical methods for use in proficiency testing by interlaboratory comparison ema training workshop August 8-9, 2016 Mexico City Class Schedule Monday, 8 August Types of PT of interest
Multidimensional Aptitude Battery-II (MAB-II) Clinical Report
 Clinical Report") Multidimensional Aptitude Battery-II (MAB-II) Clinical Report Name: Sam Sample ID Number: 1000 A g e : 14 (Age Group 16-17) G e n d e r : Male Years of Education: 15 Report Date: August 19, 2010 Summary
Multidimensional Aptitude Battery-II (MAB-II) Clinical Report Name: Sam Sample ID Number: 1000 A g e : 14 (Age Group 16-17) G e n d e r : Male Years of Education: 15 Report Date: August 19, 2010 Summary
Standardised Scores Have A Mean Of Answer And Standard Deviation Of Answer
 Standardised Scores Have A Mean Of Answer And Standard Deviation Of Answer The SAT is a standardized test widely used for college admissions in the An example of a "grid in" mathematics question in which
TEW. L 3: Test of Early Written Language Third Edition, Complete Kit OUR PRICE-$ Revision of the TEWL-2 Test! Ages: 4-0 through years
 TEW L 3: Test of Early Written Language Third Edition, Complete Kit OUR PRICE-$350.00 Revision of the TEWL-2 Test! Ages: 4-0 through 11-11 years Testing Time: 30-50 minutes Administration: Individual Qualification
Webinar 3: Interpreting Assessment Results to Establish a Connection
 Webinar 3: Interpreting Assessment Results to Establish a Connection January 2017 Objectives Increase your confidence in: Identifying the appropriate achievement assessments; Administering, scoring, and
Evaluating the Technical Adequacy and Usability of Early Reading Measures
 This is a chapter excerpt from Guilford Publications. Early Reading Assessment: A Practitioner's Handbook, Natalie Rathvon. Copyright 2004. chapter 2 Evaluating the Technical Adequacy and Usability of
AP Statistics Test #1 (Chapter 1)
") AP Statistics Test #1 (Chapter 1) Name Part I - Multiple Choice (Questions 1-20) - Circle the answer of your choice. 1. You measure the age, marital status and earned income of an SRS of 1463 women. The
AP Statistics Test #1 (Chapter 1) Name Part I - Multiple Choice (Questions 1-20) - Circle the answer of your choice. 1. You measure the age, marital status and earned income of an SRS of 1463 women. The
Statistics is the area of Math that is all about 1: collecting, 2: analysing and 3: reporting about data.
 Unit 2 Statistical Analysis Statistics is the area of Math that is all about 1: collecting, 2: analysing and 3: reporting about data. 1: Collecting data Collecting data is done by performing Surveys, either
Draft Poof - Do not copy, post, or distribute
 Chapter Learning Objectives 1. Explain the importance and use of the normal distribution in statistics 2. Describe the properties of the normal distribution 3. Transform a raw score into standard (Z) score
Super-marketing. A Data Investigation. A note to teachers:
 Super-marketing A Data Investigation A note to teachers: This is a simple data investigation requiring interpretation of data, completion of stem and leaf plots, generation of box plots and analysis of
1. Contingency Table (Cross Tabulation Table)
") II. Descriptive Statistics C. Bivariate Data In this section Contingency Table (Cross Tabulation Table) Box and Whisker Plot Line Graph Scatter Plot 1. Contingency Table (Cross Tabulation Table) Bivariate
II. Descriptive Statistics C. Bivariate Data In this section Contingency Table (Cross Tabulation Table) Box and Whisker Plot Line Graph Scatter Plot 1. Contingency Table (Cross Tabulation Table) Bivariate
Introduction to Research
 Introduction to Research Arun K. Tangirala Arun K. Tangirala, IIT Madras Introduction to Research 1 Objectives To learn the following: I What is data analysis? I Types of analyses I Different types of
Frequently Asked Questions (FAQs)
") I N T E G R A T E D WECHSLER INTELLIGENCE SCALE FOR CHILDREN FIFTH EDITION INTEGRATED Frequently Asked Questions (FAQs) Related sets of FAQs: For general WISC V CDN FAQs, please visit: https://www.pearsonclinical.ca/content/dam/school/global/clinical/canada/programs/wisc5/wisc-v-cdn-faqs.pdf
I N T E G R A T E D WECHSLER INTELLIGENCE SCALE FOR CHILDREN FIFTH EDITION INTEGRATED Frequently Asked Questions (FAQs) Related sets of FAQs: For general WISC V CDN FAQs, please visit: https://www.pearsonclinical.ca/content/dam/school/global/clinical/canada/programs/wisc5/wisc-v-cdn-faqs.pdf
Joe Sample. Total Administration Time: C6wPgCYJK. Candidate ID: Sample Distributor. Organization:
 Joe Sample Date and Time Started: Date and Time Completed: Total Administration Time: 9/28/2016 10:28 AM 9/28/2016 10:36 AM 7 minutes Candidate ID: Email: C6wPgCYJK sample@psymetricsworld.com Organization:
CREDIT RISK MODELLING Using SAS
 Basic Modelling Concepts Advance Credit Risk Model Development Scorecard Model Development Credit Risk Regulatory Guidelines 70 HOURS Practical Learning Live Online Classroom Weekends DexLab Certified
Equivalence of Q-interactive and Paper Administrations of Cognitive Tasks: Selected NEPSY II and CMS Subtests
 Equivalence of Q-interactive and Paper Administrations of Cognitive Tasks: Selected NEPSY II and CMS Subtests Q-interactive Technical Report 4 Mark H. Daniel, PhD Senior Scientist for Research Innovation
ALTE Quality Assurance Checklists. Unit 4. Test analysis and Post-examination Review
 s Unit 4 Test analysis and Post-examination Review Name(s) of people completing this checklist: Which examination are the checklists being completed for? At which ALTE Level is the examination at? Date
Special Education. Understanding Standardized Tests. The same quantity (or test score) can be expressed using different units of measure.
 can be expressed using different units of measure.") Special Education A monthly webinar series on all aspects of Massachusetts special education law brought to you by Understanding Standardized Tests The same quantity (or test score) can be expressed using
Special Education A monthly webinar series on all aspects of Massachusetts special education law brought to you by Understanding Standardized Tests The same quantity (or test score) can be expressed using
Reliability & Validity
 Request for Proposal Reliability & Validity Nathan A. Thompson Ph.D. Whitepaper-September, 2013 6053 Hudson Road, Suite 345 St. Paul, MN 55125 USA P a g e 1 To begin a discussion of reliability and validity,
THE LEAD PROFILE AND OTHER NON-PARAMETRIC TOOLS TO EVALUATE SURVEY SERIES AS LEADING INDICATORS
 THE LEAD PROFILE AND OTHER NON-PARAMETRIC TOOLS TO EVALUATE SURVEY SERIES AS LEADING INDICATORS Anirvan Banerji New York 24th CIRET Conference Wellington, New Zealand March 17-20, 1999 Geoffrey H. Moore,
Answer vital questions about your students language and literacy skills with TILLS TM
 Answer vital questions about your students language and literacy skills with TILLS TM Does my student have a language/literacy disorder? What are my student s strengths and weaknesses? How is my student
of a student s grades for the period is a better method than using the mean. Suppose the table at the right shows your test grades.
 Math Applications The applications that follow are like the ones you will encounter in many workplaces. Use the mathematics you have learned in this chapter to solve the problems. Wherever possible, use
Module 1: Fundamentals of Data Analysis
 Using Statistical Data to Make Decisions Module 1: Fundamentals of Data Analysis Dr. Tom Ilvento Dr. Mugdim Pašiƒ University of Delaware Sarajevo Graduate School of Business S tatistics are an important
Mathematics in Contemporary Society - Chapter 5 (Spring 2018)
") City University of New York (CUNY) CUNY Academic Works Open Educational Resources Queensborough Community College Spring 218 Mathematics in Contemporary Society - Chapter (Spring 218) Patrick J. Wallach
City University of New York (CUNY) CUNY Academic Works Open Educational Resources Queensborough Community College Spring 218 Mathematics in Contemporary Society - Chapter (Spring 218) Patrick J. Wallach
ANALYSING QUANTITATIVE DATA
 9 ANALYSING QUANTITATIVE DATA Although, of course, there are other software packages that can be used for quantitative data analysis, including Microsoft Excel, SPSS is perhaps the one most commonly subscribed
Day 1: Confidence Intervals, Center and Spread (CLT, Variability of Sample Mean) Day 2: Regression, Regression Inference, Classification
 Day 2: Regression, Regression Inference, Classification") Data 8, Final Review Review schedule: - Day 1: Confidence Intervals, Center and Spread (CLT, Variability of Sample Mean) Day 2: Regression, Regression Inference, Classification Your friendly reviewers
Data 8, Final Review Review schedule: - Day 1: Confidence Intervals, Center and Spread (CLT, Variability of Sample Mean) Day 2: Regression, Regression Inference, Classification Your friendly reviewers
Topic 1: Descriptive Statistics
 Topic 1: Descriptive Statistics Econ 245_Topic 1 page1 Reference: N.C &T.: Chapter 1 Objectives: Basic Statistical Definitions Methods of Displaying Data Definitions: S : a numerical piece of information
Setting Standards. John Norcini, Ph.D.
 Setting Standards John Norcini, Ph.D. jnorcini@faimer.org Overview Scores and standards Definitions and types Characteristics of a credible standard Who sets the standards, what are the characteristics
Online Student Guide Types of Control Charts
 Online Student Guide Types of Control Charts OpusWorks 2016, All Rights Reserved 1 Table of Contents LEARNING OBJECTIVES... 4 INTRODUCTION... 4 DETECTION VS. PREVENTION... 5 CONTROL CHART UTILIZATION...
Biostat Exam 10/7/03 Coverage: StatPrimer 1 4
 Biostat Exam 10/7/03 Coverage: StatPrimer 1 4 Part A (Closed Book) INSTRUCTIONS Write your name in the usual location (back of last page, near the staple), and nowhere else. Turn in your Lab Workbook at
Core vs NYS Standards
 Core vs NYS Standards Grade 5 Core NYS Operations and Algebraic Thinking -------------------------------------------------------------------------- 5.OA Write / Interpret Numerical Expressions Use ( ),
Course on Data Analysis and Interpretation P Presented by B. Unmar. Sponsored by GGSU PART 1
 Course on Data Analysis and Interpretation P Presented by B. Unmar Sponsored by GGSU PART 1 1 Data Collection Methods Data collection is an important aspect of any type of research study. Inaccurate data
Review Materials for Test 1 (4/26/04) (answers will be posted 4/20/04)
 (answers will be posted 4/20/04)") Review Materials for Test 1 (4/26/04) (answers will be posted 4/20/04) Prof. Lew Extra Office Hours: Friday 4/23/04 10am-10:50am; Saturday 12:30pm-2:00pm. E- mail will be answered if you can send it before
Review Materials for Test 1 (4/26/04) (answers will be posted 4/20/04) Prof. Lew Extra Office Hours: Friday 4/23/04 10am-10:50am; Saturday 12:30pm-2:00pm. E- mail will be answered if you can send it before