Leisure, Hospitality & Retail Industry Cluster
|
|
|
- Aron Logan
- 6 years ago
- Views:
Transcription


1 New Jersey s Leisure, Hospitality & Retail Industry Cluster Prepared by: New Jersey Department of Labor & Workforce Development Office of Research & Information Bureau of Labor Market Information Fall 2017
2 THE GOAL OF THIS REPORT IS TO GET AN IDEA OF WHAT LHR MEANS TO NEW JERSEY Identify the types of industries and establishments that make up the leisure, hospitality and retail cluster based on a standard industry classification system Describe any similarities and differences among its components with regard to such variables as employment, wage, occupation type, education, and demographic characteristics Examine any present distinctions within the cluster and its components that give New Jersey a competitive advantage compared to neighboring states, regions or the nation, or show areas where New Jersey could improve to add to the state s economy Analyze the current state of the leisure, hospitality and retail cluster and provide an outlook for employment into the future
3 LEISURE, HOSPITALITY & RETAIL: Background Whether you are out for a meal, buying jeans or down the shore at a New Jersey casino or boardwalk, jobs in the Leisure, Hospitality & Retail (LHR) industry are all around you. While there are many entry-level jobs with entry-level hourly wages, many of those jobs can lead workers to a variety of long-term career paths to better paying jobs. In some LHR occupations, workers are paid mainly through tips, allowing workers in those occupations opportunities to earn well above the minimum wage. Hard work, people skills and the right attitude can take an employee a long way in LHR and advanced education is rarely required. New Jersey has a well-earned reputation as a place for great entertainment, vacations and shopping which is why the LHR industry continues to thrive throughout the state. The northern part of the state has a higher concentration of retail and hospitality jobs with its higher density of shopping malls and hotels in close proximity to New York City and large corporate centers. The southern part of the state has fewer large malls, although it does have shopping outlets, and tourism is strongly represented in its shore towns including Atlantic City.
4 LEISURE, HOSPITALITY & RETAIL Industry Cluster: Description and Overview
5 What is the Leisure, Hospitality and Retail (LHR) Industry Cluster? Composition of NAICS Codes Retail Trade 441 Motor Vehicle and Parts Dealers 442 Furniture and Home Furnishings Stores 443 Electronics and Appliance Stores 444 Building Material & Garden Supply Stores 445 Food and Beverage Stores 446 Health and Personal Care Stores 447 Gasoline Stations 448 Clothing and Clothing Accessories Stores 451 Sporting Goods/Hobby/Book/Music Stores 452 General Merchandise Stores 453 Miscellaneous Store Retailers 454 Non-store Retailers 71 Arts, Entertainment & Recreation 711 Performing Arts and Spectator Sports 712 Museums, Parks and Historical Sites 713 Amusement, Gambling & Recreation Industries 72 Accommodations and Food Services 721 Accommodations 722 Food Services and Drinking Places
 of all private sector workers in the state. In comparison, the cluster represented 26.0 percent of the nation s private sector employment in 2016. LHR represented $45.8 billion or 9.")

6 Highlights of the LHR Industry Cluster The latest data shows that: Leisure, hospitality and retail trade (LHR) employment totaled 826,776 in 2016, or nearly one-quarter (24.4%) of all private sector workers in the state. In comparison, the cluster represented 26.0 percent of the nation s private sector employment in LHR represented $45.8 billion or 9.0 percent of the state s real Gross Domestic Product in New Jersey LHR employers paid over $24.3 billion in total wages during 2016, or 11.5 percent of the state total. In addition, LHR businesses accounted for 20.8 percent of all units in the statewide total private sector in Many of the businesses within LHR are involved in New Jersey s travel and tourism and directly support 321,231 jobs in Source: NJLWD, Quarterly Census of Employment and Wages, Bureau of Economic Analysis, NJ Division of Travel and Tourism Prepared by: New Jersey Department of Labor and Workforce Development, September 2017
7 Leisure, Hospitality & Retail Real GDP: (millions of chained 2009 dollars): NJ vs. US $48,000 The real gross domestic product (GDP) in the US has returned to its prerecession levels of 2006 while NJ is gradually improving since its 2009 low but still is below its 2006 level. $47,000 $46,000 $45,000 $44,000 $43,000 $42,000 $41,000 $40,000 $39,000 $38, NJ $1,800,000 $1,600,000 $1,400,000 $1,200,000 $1,000,000 $800,000 US Source: Bureau of Economic Analysis Prepared by: New Jersey Department of Labor and Workforce Development, September 2017 $600,000 $400,000 $200,000 $


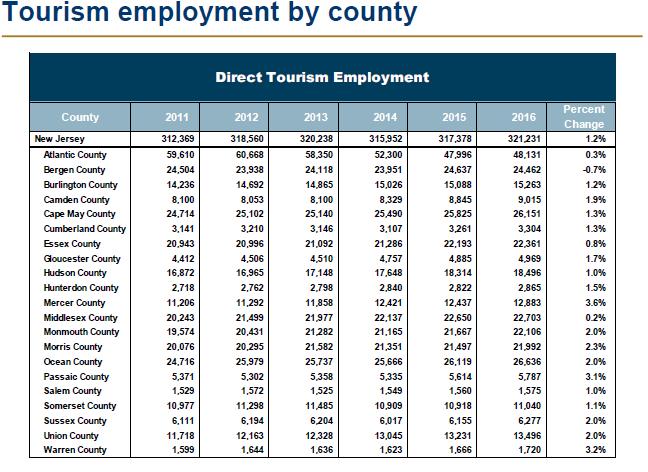
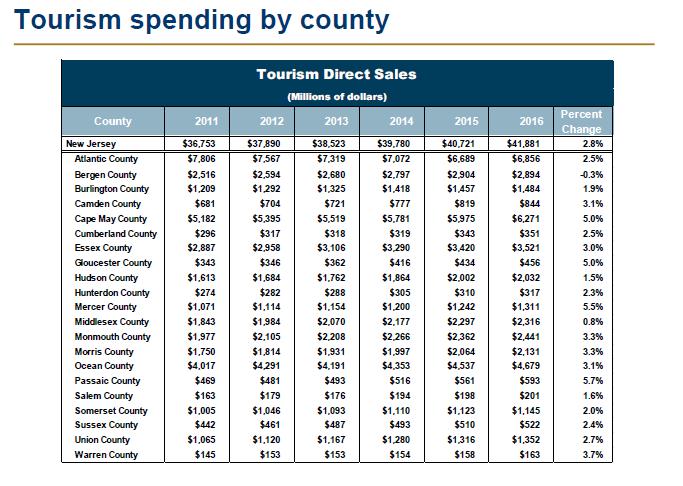
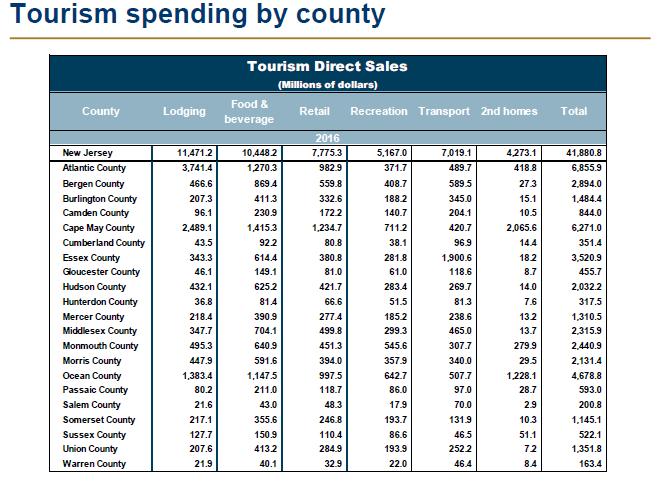
8 Tourism New Jersey again set a record in 2016, with the tourism industry accounting for $44.1 billion in economic impact an increase of more than 2.9 percent over the previous year. This was in part due to an increase in visitation to New Jersey, which increased for the seventh straight year. The number of visitors to New Jersey increased by 3.3 percent last year to 98 million. According to The Economic Impact of Tourism in New Jersey Report released by the Department of State s Division of Travel and Tourism, New Jersey s travel and tourism industry directly supported 321,231 jobs in New Jersey and sustained more than 517,559 jobs including indirect and induced impacts in The industry accounts for 9.8% of total employment or nearly 1-in-10 jobs in New Jersey. The tourism sector generated $38.2 billion of state GDP in 2016, representing 6.5% of the entire state economy. Without the tourism industry, New Jersey households would each pay $1,525 more in order to maintain the current level of state and local government services. Including indirect and induced impacts, tourism in New Jersey generated $4.9 billion in state and local tax revenues last year. Source: NJ Division of Travel & Tourism; Tourism Economics, An Oxford Economics Company
 of the national average for all private sector workers ($53,515).")
9 LHR By Industry The 2016 average annual wage for New Jersey s LHR cluster was $29,348 or less than half the state average for all private sector workers ($62,424). In comparison, the annual average wage in the nation s LHR cluster was $26,405 in 2016 or nearly 50 percent (49.3%) of the national average for all private sector workers ($53,515). New Jersey s Leisure, Hospitality & Retail Trade Cluster (2016) Industry Components Employment Establishments Average Annual Wage ($) LHR Cluster Retail Trade Arts/Entertainment/Recreation Accommodations Food Services & Drinking Places Private Sector Employment, NJ Total 826, ,116 63,948 49, ,665 3,382,841 53,716 30,395 3,674 1,373 18, ,569 29,348 33,241 34,434 36,353 19,703 62,424 Source: NJ Department of Labor and Workforce Development, Quarterly Census of Employment and Wages, 2016 Annual Average Total wages paid in New Jersey s LHR industry cluster during 2016 accounted for just 11.5 percent of the private sector wages paid in the state. The LHR cluster s much lower average annual wage reflects the entry level, lower skill, seasonal and part-time nature of many of the occupations found within it.
10 LEISURE, HOSPITALITY & RETAIL Detailed Industry Employment: Current and Trend Analysis
11 Current Employment Statistics (CES): Description Preliminary monthly estimates are based on reports submitted by a sample of New Jersey employers The estimates are benchmarked each year based on more complete and accurate counts of data, which are obtained primarily from employer reports required by the State s unemployment insurance system The employment data are grouped by industry according to the 2012 North American Industry Classification System (NAICS)
12 NJ s LHR employment performed slightly below the private sector as a whole and excluding LHR from Since then, the cluster has performed slightly better Leisure, Hospitality & Retail Employment Index: Annual Averages 1990 to 2016 Current Employment Statistics (CES) July 1990 March 1991 March 2001 November 2001 December 2007 June 2009 From 1990 to 2016, LHR has added 122,800 new jobs in New Jersey or about 27.9 percent of the state s employment gain. However, its share of total employment increased only slightly during this period, from 19.5 percent in 1990 to 20.4 percent in Employment in Arts, Entertainment and Recreation has grown 74.7 percent over the last 26 years The recession, consumer spending and online shopping has led Retail employment to be the laggard among LHR s major components Retail Trade Arts, Entertainment, and Recreation Accommodation and Food Services All Industries, except LHR LHR Total All industries (For illustrative purposes: NAICS 721 & 722 combined) Source: NJLWD, Current Employment Statistics Prepared by: New Jersey Department of Labor and Workforce Development, June 2017


13 THE LANDSCAPE OF LEISURE, HOSPITALITY & RETAIL HAS CHANGED DRAMATICALLY OVER THE PAST 26 YEARS 1990 Employment of Components as a Percentage of Leisure, Hospitality & Retail New Jersey, 1990 & Accommodations 11% A/E/R 5% Food Services/Drinking Places 22% Accommodations 6% Food Services/Drinking Places 31% A/E/R 8% Retail Trade 62% Retail Trade 56% Source: NJLWD, Current Employment Statistics, Annual Averages Prepared by: New Jersey Department of Labor and Workforce Development, September 2017
14 From about 2002 to late 2005, employment growth in NJ s LHR industry cluster generally outperformed the nation NJ and US Leisure, Hospitality & Retail Industry Cluster Employment Index January July 2017 Seasonally Adjusted Current Employment Statistics (CES) US NJ Since 2005, growth in the state s LHR cluster has lagged that of the nation. The worst national recession since the Great Depression deserves credit for most of the job losses in the LHR cluster. Businesses that were surviving in a growing economy with liberal credit for both consumers and businesses found the going tough when consumers severely cut back on discretionary spending and banks tightened lending standards. Source: NJLWD, Current Employment Statistics Prepared by: New Jersey Department of Labor and Workforce Development, August 2017
15 Jan-02 Jul-02 Jan-03 Jul-03 Jan-04 Jul-04 Jan-05 Jul-05 Jan-06 Jul-06 Jan-07 Jul-07 Jan-08 Jul-08 Jan-09 Jul-09 Jan-10 Jul-10 Jan-11 Jul-11 Jan-12 Jul-12 Jan-13 Jul-13 Jan-14 Jul-14 Jan-15 Jul-15 Jan-16 Jul-16 Jan-17 Jul-17 NJ and US Employment Index Leisure & Hospitality January 2002 July 2017 Seasonally Adjusted Current Employment Statistics (CES) US NJ From January 2002 until the fall of 2006, employment in leisure and hospitality fared better in the state than the U.S From the end of 2006 to the end of 2010, LHR job growth in NJ and the U.S. occurred at about the same pace Since then, leisure and hospitality employment in the U.S. has taken off separating itself from NJ s lackluster inconsistent performance which is mainly due to the downsizing and closing of several casino hotels in Atlantic City in recent years. Source: NJLWD, Current Employment Statistics Prepared by: New Jersey Department of Labor and Workforce Development, September 2017
16 Jan-02 Jul-02 NJ and US Employment Index Retail Trade January 2002 July 2017 Seasonally Adjusted Current Employment Statistics (CES) Jan-03 Jul-03 Jan-04 Jul-04 Jan-05 Jul-05 Jan-06 Jul-06 Jan-07 Jul-07 Jan-08 Jul-08 Jan-09 Jul-09 Jan-10 Jul-10 Jan-11 Jul-11 Jan-12 Jul-12 Jan-13 Jul-13 Jan-14 Jul-14 Jan-15 Jul-15 Jan-16 Jul-16 Jan-17 Jul US NJ From January 2002 until around September 2005, retail employment fared better in the state than the U.S Since then, the two have followed a similar trend. However, NJ s retail employment has remained below that of the nation. Source: NJLWD, Current Employment Statistics Prepared by: New Jersey Department of Labor and Workforce Development, September 2017
17 Quarterly Census of Employment and Wages (QCEW): Description Tabulations of employment and wage data for employers covered under the New Jersey Unemployment Compensation Law. QCEW is a program of the Bureau of Labor Statistics, U.S. Department of Labor Beginning with the release of 2001 annual and 2002 quarterly data, the program has switched to the North American Industry Classification System (NAICS) as the basis for the assignment and tabulation of economic data by industry NAICS uses a production-oriented approach to categorize economic units. Units with similar production processes are classified in the same industry. NAICS focuses on how products and services are created, as opposed to the SIC focus on what is produced. This approach yields significantly different industry groupings than those produced by the SIC approach
18 Leisure, Hospitality & Retail Quarterly Census of Employment & Wages Statewide Employment: Annual Averages , , , , , , , , , , , , , , , , , , , , , , , , , As illustrated above, New Jersey s LHR employment has shown steady improvement after being down in two consecutive years: and as a result of the recession. Source: NJLWD, Quarterly Census of Employment and Wages, Annual Averages Prepared by: New Jersey Department of Labor and Workforce Development, September 2017
19 Leisure, Hospitality & Retail Quarterly Census of Employment & Wages Establishments & Wages: Annual Averages, Establishments/Units Annual Wages 56,000 55,500. $30,000 $29,000 55,000 54,500 54,000 53,500 $28,000 $27,000 $26,000 53,000 $25,000 52,500 $24,000 52,000 $23,000 51, $22, $30,000,000,000 $25,000,000,000 $20,000,000,000 $15,000,000,000 $10,000,000,000 $5,000,000,000 $0 Total Wages Source: NJLWD, Quarterly Census of Employment and Wages, Annual Averages Prepared by: New Jersey Department of Labor and Workforce Development, September 2017
20 More Recent Analysis: ,000 35,000 30,000 25,000 20,000 15,000 10,000 5, ,000-10,000-15,000 NJ LHR Employment Change: 2010 to ,214 Retail trade 11,563 Arts, entertainment, and recreation -9,683 33,169 Accommodation Food services and drinking places Retail trade job levels added over 24,200 while employment in Accommodations fell over 9,600. For retail in particular, NJ is an inviting marketplace given its population density (highest in the nation) and per capita income (second highest). In Accommodations, 12,478 of the losses occurred within Atlantic City s casino hotels due to neighboring competition resulting in a rash of casino closings. The other two of the cluster s four primary components (Food Services/Drinking Places and Arts/Entertainment/Recreation) also added jobs during this six-year period. Full-service restaurants accounted for almost half (47.8%) of Food Services/Drinking Places employment, while Fitness & Recreational Sports Centers created more than four in 10 new jobs (43.4%) in the A/E/R industry subsector. Source: NJLWD, Quarterly Census of Employment and Wages Prepared by: New Jersey Department of Labor and Workforce Development, October 2017
21 Breaking the four primary components into their 17, three-digit NAICS industries and comparing the state s percent change in employment to the nation s from 2010-to-2016 yields the table below: Percent Change NAICS Industry NJ US 447 Gasoline stations Non-store retailers Performing arts and spectator sports General merchandise stores Amusements, gambling, and recreation Health and personal care stores Motor vehicle and parts dealers Food and beverage stores Building material and garden supply stores Furniture and home furnishings stores Food services and drinking places Clothing and clothing accessories stores Sporting goods, hobby, book and music stores Electronics and appliance stores Miscellaneous store retailers Museums, historical sites, zoos, and parks Accommodation Four NJ LHR industries posted losses while the nation s rose from 2010 to 2016: NAICS 443; 451; 453 and 721. The state LHR industry that posted the largest difference in employment gain, percentagewise, than the nation was Gasoline Stations (+26.2% vs %) due to Wawa s ongoing expansion. NJ is one of two states (Oregon is the other) without self-service thus creating extra jobs. The most significant loss (-9,683 jobs) in NJ occurred in accommodations due to the number of Atlantic City casino closings. Nationally, this industry added 7,911 jobs. The fastest-growing industry within LHR in the US was non-store retailers. The significant gain could be partly attributed to an increase in online shopping. Source: NJLWD, Quarterly Census of Employment and Wages Prepared by: New Jersey Department of Labor and Workforce Development, October 2017
22 2016 Percentage of employment: Four primary components Food services and drinking places, 30.8% NJ LHR Employment by Major Industry Components 2016 Annual Averages Retail trade, 55.5% In terms of employment, the Retail Trade and Food Services/Drinking Places components combined accounted for more than four of every five jobs (86.3%) in the LHR cluster in Most of the businesses in the LHR cluster are familiar to even the most casual observer. Retail Trade, which represented 55.5 percent of the cluster s employment in 2016, has one of every four jobs (24.4%) in Food and Beverage Stores. Accommodation, 5.9% Arts, entertainment, and recreation, 7.7% Food Services/Drinking Places, which accounted for 30.8 percent of the cluster s employment in 2016, is dominated by restaurants and other eating places, which represent over three quarters (84.3%) of its employment. Accommodations, which represents just 5.9 percent of the cluster s employment, would be an even smaller portion were it not for the existence of legalized gambling in Atlantic City. The city s hotel casinos employed an average of 21,158 in Source: NJLWD, Quarterly Census of Employment and Wages Prepared by: New Jersey Department of Labor and Workforce Development, October 2017

23 Food plays a significant role in the LHR industry cluster NJ LHR 2016 Employment by 3-digit NAICS 722 Food services and drinking places 445 Food and beverage stores 452 General merchandise stores 713 Amusements, gambling, and recreation 448 Clothing and clothing accessories stores 111,971 76,054 51,339 50, ,665 Restaurants are the primary component of the top-ranked Food Services/Drinking Places and Food Stores is a distant but still significant second place. 721 Accommodation 49, Motor vehicle and parts dealers 446 Health and personal care stores 444 Building material and garden supply stores 453 Miscellaneous store retailers 48,938 36,731 32,087 19,390 Of the 17 three-digit industries within the LHR cluster, these two accounted for over 44 percent of all the jobs. 447 Gasoline stations 454 Nonstore retailers 451 Sporting goods, hobby, book & music stores 443 Electronics and appliance stores 442 Furniture and home furnishings stores 18,476 16,816 16,567 15,939 15,151 Food Services/Drinking Places accounted for 30.8 percent of the cluster s total employment in 2016 with another 13.5 percent in Food Stores. 711 Performing arts and spectator sports 712 Museums, historical sites, zoos, and parks 10,807 1, , , ,000 Source: NJLWD, Quarterly Census of Employment and Wages Prepared by: New Jersey Department of Labor and Workforce Development, October 2017
 restaurants and other eating places dominates with 85.1 percent of the establishments, 84.")
 from 2010 to 2016, staffing levels increased by 373 (or")

24 Digestion of Food data Within the Food Services/Drinking Places industry, the new group (NAICS 7225, which now combines full- and limited-service) restaurants and other eating places dominates with 85.1 percent of the establishments, 84.3 percent of the employment and 81.3 percent of the total wages paid in Despite a decrease in the number of drinking places (NAICS 7224, -223 units) from 2010 to 2016, staffing levels increased by 373 (or 4.1%) accounting for 6.0 percent of establishments, 3.7 percent of employment and 3.4 percent of total wages in The 2016 annual average wage of those employed in Food Services/Drinking Places was $19,703, which was just 31.6 percent of the state s private sector average wage ($62,424) and 67.1 percent of the LHR cluster s average wage ($29,348).
 accounted for over seven of every ten (70.9%) jobs, 73.")


.")
25 Inside Food and Beverage Stores In the Food and Beverage Stores industry, supermarkets and other grocery stores (except convenience stores) accounted for over seven of every ten (70.9%) jobs, 73.3 percent of the total wages paid and more than one third (35.6%) of the establishments. Convenience Stores and Beer, Wine & Liquor Stores round out the top three accounting for about 11.3 and 9.4 percent of the Food & Beverage Stores employment total, respectively. The 2016 average annual wage of those employed in the Food and Beverage Stores industry was $25,945, which was 88.4 percent of the LHR cluster s average wage ($29,348) but just 41.6 percent of the state s private sector average wage ($62,424). Supermarkets and Other Grocery Stores, the largest segment of Food and Beverage Stores, posted a 2016 annual average wage of $26,812.
26 LOCAL EMPLOYMENT DYNAMICS (LED) The LED Program at the Census Bureau, together with its state partners (including the New Jersey Department of Labor and Workforce Development), provides new information - the Quarterly Workforce Indicators (QWI) - on Local Employment Dynamics that is: local at the county and sub county level - so that decisions can be made in the right context. Information on Employment for workers in different industries and different age and sex groups - so that you know where the jobs are - together with earnings - so you know what people are getting paid. Also provides dynamic information on the rapidly changing economy - with information on where jobs are being created and destroyed, how much turnover there is in each industry together with long-term trends.

27 Greatest average monthly earnings for new hires: (Two-Digit NAICS: 2014Q4 to 2015Q3, averaged) 55 Management of Companies and Enterprises 52 Finance and Insurance 21 Mining, Quarrying, and Oil and Gas 22 Utilities 54 Professional, Scientific, and Technical 51 Information 42 Wholesale Trade 23 Construction Manufacturing 53 Real Estate and Rental and Leasing All NAICS Transportation and Warehousing 62 Health Care and Social Assistance 56 Administrative and Support and Waste 61 Educational Services 11 Agriculture, Forestry, Fishing and Hunting 81 Other Services (except Public 71 Arts, Entertainment, and Recreation Retail Trade 72 Accommodation and Food Services $1,846 $1,840 $1,341 $2,462 $2,353 $1,989 $1,927 $3,381 $3,186 $2,837 $2,773 $4,338 $5,029 $4,484 $6,245 $6,132 $6,082 $5,799 $7,330 $6,711 Source: QWI Explorer application, U.S. Census Bureau, Local Employment Dynamics September 2016 Due to the lower-paying nature of the jobs within the industry cluster, the bottom-ranked (17 th, 18 th and last) of all 19 industries are leisure, hospitality and retailrelated. The annual wage for Accommodations may actually be lower were it not for the hotel casino industry s greater proportion of higher paying jobs compared to similar non-gaming establishments. Per LED Extraction tool: Average monthly earnings of newly stable employees in statewide private firms (i.e., full-quarter employees who were new hires with a firm in the previous quarter).
28 All NAICS subsectors $5, Food Services and Drinking Places $1, General Merchandise Stores $1, Amusement, Gambling, and Recreation Industries $1, Personal and Laundry Services $2, Gasoline Stations $2, Funds, Trusts, and Other Financial Vehicles $2, Food and Beverage Stores $2, Transit and Ground Passenger Transportation $2, Forestry and Logging $2, Support Activities for Agriculture and Forestry $2, Social Assistance $2, Postal Service $2, Museums, Historical Sites, and Similar Institutions $2, Clothing and Clothing Accessories Stores $2, Private Households $2, Miscellaneous Store Retailers $2, Sporting Goods, Hobby, Musical Instrument, and Book Stores $2, Justice, Public Order, and Safety Activities $2, Animal Production and Aquaculture $2, Crop Production $2, Nursing and Residential Care Facilities $2, Scenic and Sightseeing Transportation $2, Accommodation $3,001 Lowest Average Monthly Earnings (3-digit NAICS): Based on three-digit Local Employment Dynamics (LED) data from the US Census Bureau, ten of the 23 lowest (red) of all industries by average monthly wages fall within the Leisure, Hospitality and Retail industry cluster. Two other industries (purple) are considered tourism-related. Additionally, the lowest paid of these LHR industry subsectors, Food Services & Drinking Places, is the one that has been growing the most and is projected to grow the most. Per LED extraction tool: 2014Q4 to 2015Q3 ($) averaged, Average monthly earnings of employees with stable jobs (i.e., worked with the same firm throughout the quarter). NJ Private Firms Only Source: QWI Explorer application, U.S. Census Bureau, Local Employment Dynamics, September 2016
29 County-wide LHR data: A view at a more local level SUSSEX PASSAIC BERGEN WARREN MORRIS ESSEX HUDSON UNION HUNTERDON SOMERSET MIDDLESEX MERCER MONMOUTH BURLINGTON OCEAN CAMDEN GLOUCESTER SALEM ATLANTIC CUMBERLAND CAPE MAY
30 100,000 93, Annual Average QCEW (LHR) Employment by County 90,000 80,000 70,000 72,992 69,185 Over one-quarter (28.4%) of all employment in the LHR Industry cluster is concentrated in three counties: Bergen, Monmouth & Middlesex 60,000 55,033 53,232 52,941 50,000 40,000 47,944 47,421 43,098 42,715 41,672 35,966 35,684 35,028 30,000 28,731 20,000 17,936 10, ,927 11,173 11,087 9,458 3,398 Source: NJLWD, Quarterly Census of Employment & Wages, Annual Averages Prepared by: New Jersey Department of Labor and Workforce Development, September 2017
31 2016 Quarterly Census of Employment & Wages (QCEW) Leisure, Hospitality & Retail (LHR) by Percentage of Total Employment County Units Average Annual Employment Wages Total Wages LHR % of Total Units Employment Cape May 1,619 17,936 $24,620 $441,591, % 55.2% Atlantic 1,937 52,941 29,058 1,538,361, Sussex ,173 24, ,930, Ocean 3,042 47,944 24,474 1,173,376, Warren 641 9,458 23, ,261, Gloucester 1,451 28,731 26, ,876, Monmouth 4,655 72,992 25,339 1,849,563, Hunterdon ,927 27, ,446, Passaic 2,872 35,684 27, ,473, Camden 2,710 42,715 27,004 1,153,468, Statewide 53, ,776 29,348 24,264,253, Burlington 2,358 41,672 26,946 1,122,889, Bergen 6,178 93,024 32,597 3,032,321, Cumberland ,087 22, ,053, Union 3,128 43,098 27,795 1,197,920, Hudson 3,517 47,421 31,657 1,501,224, Morris 3,239 55,033 39,110 2,152,364, Somerset 1,918 35,028 33,053 1,157,765, Mercer 2,183 35,966 25, ,232, Salem 268 3,398 20,834 70,794, Essex 4,279 53,232 29,704 1,581,200, Middlesex 4,257 69,185 28,692 1,985,062, Due primarily to their tourism-based economies, over one-half of Cape May (55.2%) and Atlantic (50.6%) counties 2016 total private employment is concentrated in the LHR cluster while the state s is almost one-quarter (24.4%). Four counties had annual average wages over $30,000 while the state averaged $29,348 in LHR: Morris - $39,110 Somerset - $33,053 Bergen - $32,597 Hudson - $31,657 Source: NJLWD, Quarterly Census of Employment & Wages, Annual Averages Prepared by: New Jersey Department of Labor and Workforce Development, October 2017
32 Retail Employment Gains/Losses: by County (Percent) Essex Cumberland Warren Burlington Union Cape May Morris Atlantic Hunterdon Camden Passaic Bergen Monmouth Somerset Mercer Gloucester Ocean Salem Sussex Middlesex Hudson The graph ranks the state s counties by their percent rise/drop in retail trade employment from The primary component, Retail Trade, recorded the LHR cluster s greatest employment increase from 2010-to (24,214) if NAICS 721 and 722 are combined to form NAICS 72 - Leisure and Hospitality. Only two of the state s 21 counties recorded a drop in retail employment over this six-year period Source: NJLWD, Quarterly Census of Employment & Wages, Annual Averages Prepared by: New Jersey Department of Labor and Workforce Development, October 2017
33 Food Service and Drinking Places Employment Gains/Losses: by County (Percent) Salem Cumberland Bergen Sussex Atlantic Passaic Burlington Camden Cape May Union Gloucester Middlesex Ocean Warren Hunterdon Monmouth Mercer Morris Essex Somerset Hudson Food Services/Drinking Places was the LHR component with the greatest employment gain from 2010-to-2016 (24,659). Only two of the state s 21 counties recorded a drop in employment over this six-year period. The last national recession had some impact on consumer discretionary spending which impacted statewide employment in Food Services/Drinking Places. This industry constantly added to its annual payrolls since at least 2004 except for the 2008 to 2009 period. In general, this industry also experiences a high degree of business openings and closings regardless of the economic conditions. Source: NJLWD, Quarterly Census of Employment & Wages, Annual Averages Prepared by: New Jersey Department of Labor and Workforce Development, October 2017
34 Accommodations Employment Gains/Losses: by County (Percent) Atlantic Somerset Mercer Hudson Ocean Bergen Burlington Cumberland Essex Salem Middlesex Cape May Sussex Hunterdon Morris Passaic Camden Gloucester Monmouth Union Warren Accommodations was the LHR component with the only employment loss from 2010-to (-9,683). Four of the state s 21 counties recorded a drop in employment over this six-year period. Due to the rash of hotel/casino closings in Atlantic City, Atlantic County experienced the most job loss during that time. Source: NJLWD, Quarterly Census of Employment & Wages, Annual Averages Prepared by: New Jersey Department of Labor and Workforce Development, October 2017
35 Arts, Entertainment & Recreation (NAICS 71) Employment Gains/Losses: by County (Percent) Hunterdon Ocean Mercer Atlantic Warren Cape May Sussex Somerset Union Essex Due to its smaller employment base, A/E/R was the LHR component with the least job gain from 2010-to-2016 (11,563). However, percentagewise, it grew the fastest at 22.1 percent. Cumberland Passaic Gloucester Bergen Monmouth Burlington Two of the state s 21 counties recorded a drop in employment over this six-year period. Hudson 52.2 Middlesex Note: Camden, Morris & Salem data are suppressed due to employer confidentially issues Source: NJLWD, Quarterly Census of Employment & Wages, Annual Averages Prepared by: New Jersey Department of Labor and Workforce Development, October 2017
36 LHR Employment & Population: 2016 Number of County Residents Per LHR Job While it is generally true that the distribution of Retail Trade employment across the state s 21 counties is likely to correlate to their resident population count, adding Leisure & Hospitality to the mix can in some cases take the distribution of the cluster s employment by county in a different direction. In addition to the distribution of LHR employment by county, it also may be useful to rank the state s counties by number of residents per LHR job. The lower the number, the greater the concentration of LHR jobs per capita. For example, in top-ranked Atlantic County, there was one LHR job for every 5.1 county residents in The most notable examples are the tourism dependent counties of Atlantic and Cape May, which rank one and two in number of LHR jobs on a per capita basis. Source: NJLWD, US Census Bureau, 2016 Population Estimates, Quarterly Census of Employment & Wages, Annual Averages Prepared by: New Jersey Department of Labor & Workforce Development, October 2017 Atlantic Cape May Monmouth Morris Somerset Bergen Gloucester Mercer Hunterdon Burlington New Jersey Warren Camden Middlesex Ocean Sussex Union Cumberland Passaic Hudson Essex Salem
37 NAICS Employment & Population: 2016 Number of County Residents Per RETAIL Job Cape May Gloucester Monmouth Somerset Morris Atlantic Bergen Warren Mercer Hunterdon Burlington New Jersey Middlesex Union Cumberland Passaic Camden Ocean Sussex Hudson Essex Salem Source: NJLWD, US Census Bureau, 2016 Population Estimates, Quarterly Census of Employment & Wages, Annual Averages, Prepared by: New Jersey Department of Labor and Workforce Development, October
38 NAICS 72 Employment & Population: 2016 Number of Residents Per Accommodation & Food Services Job Atlantic Cape May Monmouth Morris Somerset Mercer New Jersey Bergen Burlington Hunterdon Camden Gloucester Essex Middlesex Warren Ocean Hudson Sussex Union Cumberland Passaic Salem Source: NJLWD, US Census Bureau, 2016 Population Estimates, Quarterly Census of Employment & Wages, Annual Averages, Prepared by: New Jersey Department of Labor and Workforce Development, October 2017
39 NAICS 721 Employment & Population: 2016 Number of County Residents Per Accommodations Job Atlantic 11.4 Cape May 35.8 Morris New Jersey Sussex Somerset Middlesex Monmouth Bergen Burlington Essex Mercer Hudson Union Salem Hunterdon Ocean Cumberland Warren Camden Gloucester 1,188.3 Passaic 1, , , , , , ,000.0 Source: NJLWD, US Census Bureau, 2016 Population Estimates, Quarterly Census of Employment & Wages, Annual Averages, Prepared by: New Jersey Department of Labor and Workforce Development, October 2017
40 NAICS 722 Employment & Population: 2016 Number of County Residents Per Food Services & Drinking Places Job Cape May Atlantic Monmouth Morris Mercer Somerset Bergen Gloucester Camden Burlington New Jersey Hunterdon Warren Essex Middlesex Ocean Hudson Union Sussex Cumberland Passaic Salem Source: NJLWD, US Census Bureau, 2016 Population Estimates, Quarterly Census of Employment & Wages, Annual Averages, Prepared by: New Jersey Department of Labor and Workforce Development, October 2017
 40,000 2 Wal-Mart Stores 20,383 5 The Home Depot 13,936 10 ACME Markets 9,465 12 CVS Health 9,000 13 Caesar's Entertainment 8,894 15 Wawa, Inc.")
41 All Employers Rank NJ 2016 Employment Top Employers in LHR 1 Wakefern Food Corp. (Shop-Rite) 40,000 2 Wal-Mart Stores 20,383 5 The Home Depot 13, ACME Markets 9, CVS Health 9, Caesar's Entertainment 8, Wawa, Inc. 8, TD Bank 8, The Stop & Shop Supermarket Co. 8, Target Corp. 7, Macy s 7,400 According to New Jersey Business magazine s Top Employers in 2016, these 20 leisure, hospitality and retail trade employers are among New Jersey s top 50 largest. Quick Chek, 7-Eleven and Best Buy are tied at 46 th with 3,500 jobs while Staples rounds out the top 50 at 50 th with 3,427. Overall, these 20 employers account for about one of every four to five jobs (24.6%) in the state s LHR industry cluster. 23 Lowe s Companies Inc. 6, Bed Bath & Beyond 6, Borgata Hotel Casino & Spa 5, Aramark 5, Rite Aid 5, Costco Wholesale 4, Six Flags Great Adventure, Wild Safari 4, Toys R Us 3, Wegman's 3,719 Source: New Jersey Business magazine, August 2016 edition
42 LEISURE, HOSPITALITY & RETAIL Tourism Data
43 TOURISM DATA FROM OXFORD ECONOMICS Key results In 2016, the tourism industry directly supported 321,231 jobs in New Jersey and sustained 517,559 jobs including indirect and induced impacts. Including all impacts, the industry accounts for 9.8% of total employment or nearly 1- in-10 jobs in New Jersey. The tourism sector generated $38.2 billion of state GDP in 2016, representing 6.5% of the entire state economy. Including indirect and induced impacts, tourism in New Jersey generated $4.9 billion in state and local tax revenues. Without the tourism industry, New Jersey households would each need pay $1,525 in order to maintain the current level of state and local government services.
44
45
46
47 LEISURE, HOSPITALITY & RETAIL Detailed Industry Occupational Analysis
48 New Jersey Resident 2015 Workforce Characteristics: Occupations All Industries in NJ vs. LHR The cluster had a higher proportion in only four out of 18 occupational categories due to the defined nature of the industry components type of work. For example, Food preparation & service is mainly in Food Services/Drinking Places (component of Leisure & Hospitality) while Sales/Marketing has a significant job presence in Retail Trade. Source: U.S. Census Bureau, 2015 American Community Survey, Public Use Micro-data Sample (5% Sample) All LHR Characteristic By Occupation Percent Percent Management/Business/Financial 16.7% 8.8% Scientist/Engineer 6.1% 1.0% Community/Social services 1.7% 0.1% Legal services 1.3% 0.0% Education/Training/Library worker 6.6% 0.5% Arts/Entertainment 2.1% 2.6% Health care 7.9% 2.0% Protective 2.4% 1.2% Food preparation & service 5.0% 23.2% Cleaning/Maintenance 3.4% 2.6% Personal Care 3.6% 3.6% Sales/Marketing 11.1% 32.0% Administrative support 13.0% 11.9% Farming/Fishing/Forestry 0.2% 0.0% Construction/Extraction 4.6% 0.3% Installation/Repair 2.4% 1.8% Production 3.7% 1.6% Transportation/Material moving 6.7% 6.9% Military/Never worked 1.5% N/A
49 LHR Occupations 2016 Employment Share of Industry Total ALL Occupations in LHR 828, % Top 20 Occupations in LHR 596, Minimum Education Requirements Retail Salespersons 125, Less than high school Cashiers 90, Less than high school Waiters and Waitresses 59, Less than high school Stock Clerks and Order Fillers 50, Less than high school Combined Food Preparation and Serving Workers, Including Fast Food 47, Less than high school First-Line Supervisors of Retail Sales Workers 29, High school diploma or equivalent Food Preparation Workers 28, Less than high school Counter Attendants, Cafeteria, Food Concession, and Coffee Shop 28, Less than high school Cooks, Restaurant 20, High school diploma or equivalent First-Line Supervisors of Food Preparation and Serving Workers 16, Less than high school Bartenders 14, Less than high school Customer Service Representatives 11, High school diploma or equivalent Laborers and Freight, Stock, and Material Movers, Hand 10, Less than high school Dining Room and Cafeteria Attendants and Bartender Helpers 10, Less than high school Dishwashers 9, Less than high school Hosts and Hostesses, Restaurant, Lounge, and Coffee Shop 9, Less than high school Cooks, Fast Food 9, Less than high school Maids and Housekeeping Cleaners 9, Less than high school Light Truck or Delivery Services Drivers 8, Less than high school Fitness Trainers and Aerobics Instructors 8, High school diploma or equivalent Sixteen of the top 20 occupations within LHR require the minimum education of less than high school Source: NJLWD, Occupational Employment Statistics Survey, May 2016 Prepared by: New Jersey Department of Labor and Workforce Development, September 2017
50 Wages by Occupation As might be expected, the cluster s largest occupational category, retail salesperson, pays wages that vary by type of industry sector. Retail salespersons within the arts, entertainment and recreation segment had the highest annual wage in 2016 ($28,038) followed closely by retail trade ($27,468). Retail salespersons tended to receive the lowest wages in establishments involved with accommodations and food services ($25,894). Wages paid to cashiers, the cluster s second largest group, tended to fall within a range between the three industry sectors (NAICS 44-45, 71 & 72) that for a full-time, year-round employee would usually amount to, $21,555 - $24,051, annually. To the extent that tip income is reported accurately, waiters/waitresses (3rd largest occupation) do somewhat better with a full-time, year-round worker earning wages in the $25,082 (NAICS 72) - $26,065 (NAICS 71) range. Source: NJLWD, Occupational Employment Statistics Survey, May 2016 Prepared by: New Jersey Department of Labor and Workforce Development September 2017
51 Wages by Occupation An occupation with a significant presence in LHR is stock clerks/order fillers, the fourth largest. The pay varied narrowly between two of its segments: Retail Trade ($12.07/hr. and $25,106/yr.) and 72 Accommodation and Food Services ($12.41/hr. and $25,803/yr.). Wages paid to combined food preparation and serving workers, the cluster s fifth largest, generally paid in the $10.04 to $11.54 per hour range ($20,890 - $24,009, annual). The lower wages were similar to cashiers mainly due to entry-level, part-time, lower skill and education requirements. On the upper end of the pay scale, LHR occupations that pay an average of $100,000 or more per year mostly include managers of all types as well as chief executives, pharmacists, and software developers. Source: NJLWD, Occupational Employment Statistics Survey, May 2016 Prepared by: New Jersey Department of Labor and Workforce Development September 2017
52 LEISURE, HOSPITALITY & RETAIL Demographic Characteristics of the Industry Cluster Workforce
53 New Jersey Resident Workforce Demographic Characteristics All Industries in NJ vs. LHR: 2015 Age, Sex, Race & Hispanic Origin The LHR industry cluster is characterized by a large number of seasonal and part-time jobs and by workers who are younger than the average for all industries. Nearly one-half (48.9%) of all workers in the cluster are under 35 years old compared with nearly one-third (31.9%) for all industries. Many businesses in the cluster increase hiring during the summer, often employing high schoolage and college-age workers. Some segments of the industry cluster are heavily reliant on immigrant and guest workers such as boardwalk and amusement establishments percent of the cluster s workforce is female (47.5%, all industries) and 22.3 percent Hispanic vs percent for all industries. Source: 2015 American Community Survey Public Use Micro-data Sample (5% Sample) By Age All LHR Less than % 26.5% % 22.4% % 17.3% % 17.0% % 12.1% 65 & over 5.8% 4.7% By Sex Male 52.5% 51.9% Female 47.5% 48.1% By Race White 68.4% 68.0% Black 13.2% 12.1% American Indian/Alaska Native 0.1% 0.2% Asian 9.6% 9.4% Native Hawaiian/Pacific Islander 0.0% 0.0% Some Other Races 6.6% 8.0% Two or more races 2.0% 2.4% By Hispanic origin Non-Hispanic 80.7% 77.7% Hispanic 19.3% 22.3%
54 New Jersey Resident Workforce Characteristics All Industries in NJ vs. LHR: 2015 Earnings The LHR cluster had a significantly higher proportion than All industries in the lowest dollar range in Personal Earnings: Less than $25,000. By Personal Earnings All LHR Less than $25, % 59.0% $25,000-$50, % 22.6% $50,000-$75, % 9.3% This is the result of the low paying nature of the occupations in leisure, hospitality and retail industries. $75,000-$100, % 3.9% $100,000-$150, % 3.0% $150,000-$200, % 1.2% Source: 2015 American Community Survey Public Use Micro-data Sample (5% Sample) $200,000 & more 3.6% 1.0%


55 New Jersey Resident Workforce Characteristics All Industries vs. LHR: 2015 Educational Attainment 35.0% 30.0% 25.0% 20.0% 15.0% 10.0% 5.0% 0.0% 8.2% 12.7% 31.7% 32.7% 25.0% 26.4% 25.8% 19.0% All LHR 10.5% 2.8% 2.6% 0.6% A greater proportion of LHR workers have achieved a lower level of education than workers overall due to its lower skilled, entry-level positions with a higher turnover rate. The 2015 American Community Survey states nearly 1/2 (44.4%) of the workers in this industry cluster do not have any formal education beyond high school compared with about 1/3 (33.2%) for employees in all industries statewide. Source: 2015 American Community Survey Public Use Micro-data Sample (5% Sample)
56 LEISURE, HOSPITALITY & RETAIL Outlook and Projections
57 As for the outlook by occupation, the top four, and overall, 11 (in red) of the top 14 occupations in the state with the greatest number of projected average annual job openings are LHR-related. The typical minimum requirements for these occupations are no work experience, short-term on-the-job training and no college degree. The eleven occupations account for 24.3% (or 31,752) of all average annual job openings that New Jersey is expected to add through (25,675 replacements & 6,077 through growth) Occupation Employment Change Average Annual Job Openings Actual Projected Number Percent Total Growth Replacement Total, All Occupations 4,214,086 4,489, , ,621 31,712 98,909 Retail Salespersons 139, ,415 8, , ,826 Cashiers 96, ,914 3, , ,125 Laborers and Freight, Stock, and Material Movers, Hand 83,850 95,354 11, ,646 1,150 2,496 Waiters and Waitresses 57,824 62,467 4, , ,782 Registered Nurses 81,371 92,129 10, ,996 1,076 1,920 Combined Food Preparation and Serving Workers, Including Fast Food 58,367 67,856 9, , ,886 Stock Clerks and Order Fillers 63,743 68,221 4, , ,023 Home Health Aides 35,180 51,000 15, ,377 1, Customer Service Representatives 66,032 71,549 5, , ,626 Nursing Assistants 54,555 62,835 8, , ,232 Receptionists and Information Clerks 52,083 58,100 6, , ,404 Janitors and Cleaners, Except Maids and Housekeeping Cleaners 72,269 75,845 3, , ,435 Office Clerks, General 79,074 79, , ,705 Counter Attendants, Cafeteria, Food Concession, and Coffee Shop 22,734 25,339 2, , ,367 Source: NJLWD, Current Employment Statistics, Industry & Occupational Employment Projections,
58 New Jersey, Projected Employment Change by Industry Change: Percent Industry Title (Two-Digit NAICS) Jobs Jobs Number Annual Total Total Nonfarm 3,967,500 4,228, , Healthcare and Social Assistance 547, ,700 95, Professional, Scientific & Technical Services 290, ,300 39, Administrative and Support and Waste Management and Remediation Services 267, ,550 32, Retail Trade 455, ,300 26, Accommodation and Food Services 297, ,750 26, Construction 141, ,900 21, Transportation and Warehousing 155, ,700 16, Educational Services 97, ,650 13, Arts, Entertainment, and Recreation 59,200 71,450 12, Wholesale Trade 214, ,700 12, Other Services (except Government) 167, ,850 10, Management of Companies & Enterprises 79,700 89,400 9, Real Estate and Rental and Leasing 54,500 57,600 3, Utilities 13,700 14, Finance and Insurance 192, ,350-4, Information 75,100 66,300-8, Manufacturing 238, ,400-21, Government 619, ,550-23, Note: Total nonfarm employment excludes self-employed and unpaid family workers. Based on official employment projections for New Jersey s industries prepared by the Department of Labor and Workforce Development, payrolls in LHR (in blue) are projected to grow by 64,600 from 2014-to The cluster s rate of job growth is faster than that projected for the state overall (8.0%, LHR vs. 6.6%, all industries). Source: NJLWD, Current Employment Statistics, Industry & Occupational Employment Projections, NOTE: Employment data are rounded to the nearest hundred. Percentages and percent changes are based on unrounded data. Prepared by: New Jersey Department of Labor and Workforce Development, Workforce Research & Analytics
59 NAICS Industry Code Industry Title 2014 Estimated Employment 2024 Projected Employment Numeric Change Annual Growth Rate Retail Trade 455, ,300 26, Motor Vehicle and Parts Dealers 46,700 51,200 4, Building Mat. & Garden Equip. & Supp. Dlrs. 31,600 34,850 3, Food and Beverage Stores 113, ,100 7, Health and Personal Care Stores 35,100 36,800 1, Clothing and Clothing Accessories Stores 53,900 51,450-2, Sporting Goods, Hobby, Book & Music Stores 17,500 16,100-1, General Merchandise Stores 75,200 82,650 7, Retail Trade, AO 81,700 87,200 5, Food and Beverage stores are expected to lead Retail Trade through 2024 (+7,800 jobs) with General Merchandise Stores close behind at 7,450. Clothing and Clothing Accessories Stores and Sporting Goods, Hobby, Book & Music Stores are the only industries projected to decline. Source: NJLWD Current Employment Statistics, Industry & Occupational Employment Projections, NOTE: Employment data are rounded to the nearest hundred. Percentages and percent changes are based on unrounded data. Prepared by: New Jersey Department of Labor and Workforce Development, Workforce Research & Analytics
60 NAICS Industry Code Industry Title 2014 Estimated Employment 2024 Projected Employment Numeric Change Annual Growth Rate Leisure and Hospitality 356, ,200 38, Arts, Entertainment and Recreation 59,200 71,450 12, Amusement, Gambling & Recreation Industries 47,600 58,150 10, Arts, Entertainment, and Recreation, AO 11,600 13,300 1, Accommodation and Food Services 297, ,750 26, Accommodation 53,300 48,350-4, Casino Hotels 25,700 20,000-5, Accomodation except Casino Hotels 27,600 28, Food Services and Drinking Places 244, ,400 31, Special Food Services 29,000 31,750 2, Drinking Places (Alcoholic Beverages) 9,600 10, Restaurants 205, ,650 27, Full-Service Restaurants 116, ,550 20, Limited-Service Eating Places 89,200 96,100 6, Continuing the trend, food services & drinking places is projected to increase the most in Leisure & Hospitality through Accommodations is the only industry projected to decline due to continued casino downsizing. Source: NJLWD Current Employment Statistics, Industry & Occupational Employment Projections, NOTE: Employment data are rounded to the nearest hundred. Percentages and percent changes are based on unrounded data. Prepared by: New Jersey Department of Labor and Workforce Development, Workforce Research & Analytics
.")

61 Outlook The Foods Services/Drinking Places component is projected to create the second highest number of new jobs in the state (31,000) from 2014-to This 12.7 percent increase is more than the state s projected rate (6.6%). Ambulatory Health Care Services is projected to grow the most with an estimated 58,200 jobs or a significant 26.6 percent rate. The cluster s largest component, Retail Trade with 56 percent of employment, is projected to grow by 26,300 jobs or 5.8 percent during this 10-year period, while Arts/Entertainment/Recreation is projected to add 12,250 new jobs for a 20.7 percent advance.
62 Southern Region Industry Projections: Retail Trade County 2014 Estimated Employment 2024 Projected Employment Numeric Change Annual Growth Rate (%) Total Percent Change Outlook Atlantic 16,100 16, Stable Burlington 25,050 28,600 3, Growing Camden 23,650 24, Stable Cape May 6,750 7, Growing Cumberland 7,400 8, Growing Gloucester 17,800 18,800 1, Growing Salem 1,950 2, Growing Source: NJLWD, New Jersey Industry and Occupational Projections, Prepared by: New Jersey Department of Labor and Workforce Development, October 2016
63 Southern Region Industry Projections: Accommodations & Food Services County 2014 Estimated Employment 2024 Projected Employment Numeric Change Annual Growth Rate (%) Total Percent Change Outlook Atlantic 40,850 41, Stable Burlington 13,800 14, Growing Camden 14,650 16,150 1, Growing Cape May 9,200 9, Stable Cumberland 3,150 3, Growing Gloucester 8,550 9, Growing Salem 1,350 1, Growing Source: NJLWD, New Jersey Industry and Occupational Projections, Prepared by: New Jersey Department of Labor and Workforce Development, October 2016
64 Central Region Industry Projections: Retail Trade County 2014 Estimated Employment 2024 Projected Employment Numeric Change Annual Growth Rate (%) Total Percent Change Outlook Mercer 19,650 21,450 1, Growing Middlesex 42,100 42, Declining Monmouth 38,900 40,500 1, Stable Ocean 27,450 28,650 1, Stable Source: NJLWD, New Jersey Industry and Occupational Projections, Prepared by: New Jersey Department of Labor and Workforce Development, October 2016
65 Central Region Industry Projections: Accommodations & Food Services County 2014 Estimated Employment 2024 Projected Employment Numeric Change Annual Growth Rate (%) Total Percent Change Outlook Mercer 12,200 14,500 2, Growing Middlesex 22,750 23, Stable Monmouth 24,300 27,600 3, Growing Ocean 14,700 16,950 2, Growing Source: NJLWD, New Jersey Industry and Occupational Projections, Prepared by: New Jersey Department of Labor and Workforce Development, October 2016
66 Northern Region Industry Projections: Retail Trade County 2014 Estimated Employment 2024 Projected Employment Numeric Change Annual Growth Rate (%) Total Percent Change Outlook Bergen 54,650 54, Stable Essex 27,650 28,700 1, Stable Hudson 24,550 26,450 1, Growing Hunterdon 6,900 7, Stable Morris 29,650 31,700 2, Growing Passaic 25,050 24, Declining Somerset 20,650 25,050 4, Growing Sussex 6,150 6, Growing Union 26,750 30,600 3, Growing Warren 6,150 6, Stable Source: NJLWD, New Jersey Industry and Occupational Projections, Prepared by: New Jersey Department of Labor and Workforce Development, October 2016
67 Northern Region Industry Projections: Accommodations & Food Services Trade County 2014 Estimated Employment 2024 Projected Employment Numeric Change Annual Growth Rate (%) Total Percent Change Outlook Bergen 31,250 33,450 2, Growing Essex 21,800 22,900 1, Stable Hudson 15,600 17,500 1, Growing Hunterdon 3,600 4, Growing Morris 19,650 21,850 2, Growing Passaic 9,850 11,350 1, Growing Somerset 11,000 13,050 2, Growing Sussex 3,600 3, Growing Union 13,150 14,200 1, Growing Warren 2,700 2, Growing Source: NJLWD, New Jersey Industry and Occupational Projections, Prepared by: New Jersey Department of Labor and Workforce Development, October 2016


68 Outlook Along with other service sectors such as the hospitality industry, retail is a critical point of entry, or gateway, into the labor force and provides workers with foundational skills in customer service, punctuality, and responsibility. The retail industry offers substantial employment opportunities. Part-time and temporary work is plentiful across a range of employers, from small, independent retailers to national and multinational retail chains. Solid store experience can lead to an array of retail management and store support career ladders. A college degree can afford direct entry into management training programs and regional/corporate level career paths.
New Jersey s Leisure, Hospitality and Retail Cluster
 New Jersey s Leisure, Hospitality and Retail Cluster Prepared by: New Jersey Department of Labor & Workforce Development Office of Research and Information Bureau of Labor Market Information January 2013
Private Sector Employment, New Jersey
 Data for Decision Making Series October 2017 Private Sector Employment, New Jersey Hiring Needs by Sectors The sectors that experienced the most hiring in the 3rd quarter 2016 were professional and business
TECHNOLOGY Industry Cluster
 New Jersey s TECHNOLOGY Industry Cluster Prepared by: New Jersey Department of Labor & Workforce Development Office of Research & Information Bureau of Labor Market Information Fall 2017 THE GOAL OF THIS
Business-Facts Summary Dublin city, CA ( )
") 3 Digit NAICS Top Ten Summary Healthcare and Social Assistance Ambulatory Health Care Retail Trade Professional, Scientific, and Technical Other (except Public Administration) Retail Trade Retail Trade
3 Digit NAICS Top Ten Summary Healthcare and Social Assistance Ambulatory Health Care Retail Trade Professional, Scientific, and Technical Other (except Public Administration) Retail Trade Retail Trade
STATE OF HAWAI'I. No. of. Total Average Rep. Units Average Quarterly Quarterly Industry March Employment Wages Wages January February March
 STATE OF HAWAI'I TOTAL, including government 37,439 598,205 6,028,316,620 10,077 596,822 598,744 599,049 TOTAL GOVERNMENT 6 123,628 1,526,182,323 12,345 121,692 123,988 125,205 Federal 1 32,650 483,102,256
STATE OF HAWAI'I. No. of. Total Average Rep. Units Average Quarterly Quarterly Industry September Employment Wages Wages July August September
 STATE OF HAWAI'I TOTAL, including government 37,044 581,957 6,080,565,857 10,448 581,677 578,368 585,826 TOTAL GOVERNMENT 6 118,031 1,532,738,257 12,986 118,907 114,660 120,525 Federal 1 34,864 560,380,978
Business-Facts: 3 Digit NAICS Summary 2015
 Business-Facts: 3 Digit NAICS Summary 25 McLean CRD 25 Polygon : MCLEAN, NAICS Code Business Description Establishment Employees Sales (in Millions) Agriculture, Forestry, Fishing and Hunting Crop Production
Business-Facts Summary - 3 Digit NAICS Summary
 - 3 Digit NAICS Summary Title Page Title Page Data Version: 2018 Feb (Internal) Report Generation Method: Single Analysis Area: 1789 STATE ST, SAN DIEGO, CA, 92101-2530 Reporting Detail: As Selected Include
Vermont Short Term Employment Projections
 Short Term Employment Projections 2016-2018 Background Every year, the Department of Labor produces the state s short term employment projections. These projections use historical and current industry
11-Years From 2000 to 2011: Despite 30 Million Population Growth, First 11-Yr Job Loss Since 1927-'38
 40% 11-Years From 2000 to 2011: Despite 30 Million Population Growth, First 11-Yr Job Loss Since 1927-'38 % Total US Job Growth/Loss: Eleven Years Ending October Each Year 30% 20% 10% 0% October 2000 to
Business-Facts: 3 Digit NAICS Summary 2015
 Business-Facts: 3 Digit Summary 215 Lake Anne 215 Polygon 1: LAKE ANNE 2, 11 Agriculture, Forestry, Fishing and Hunting 111 Crop Production 112 Animal Production and Aquaculture 113 Forestry and Logging
See footnotes at end of table. Table 4. Incidence rates 1 and numbers of nonfatal occupational injuries by selected industries, Louisiana, 2016
 All industries including state and local government 4 2.1 34.0 Private industry 4 1.8 24.2 Goods-producing 4 1.3 4.4 Natural resources and mining 4,5 1.0 0.5 Mining, quarrying, and oil and gas extraction
"Check Out Our Web Site:
 AND PAYROLLS "Check Out Our Web Site: www.dllr.state.md.us/lmi/index.htm" MARYLAND DEPARTMENT LABOR, LICENSING AND REGULATION Office of Labor Market Analysis and Information 1100 North Eutaw Street Baltimore,
"Check Out Our Web Site:
 AND PAYROLLS "Check Out Our Web Site: www.dllr.state.md.us/lmi/index.htm" MARYLAND DEPARTMENT LABOR, LICENSING AND REGULATION Office of Labor Market Analysis and Information 1100 North Eutaw Street Baltimore,
COMMUNITY WORKPLACE POPULATION McHenry, Illinois
 COMMUNITY WORKPLACE POPULATION Prepared for City of McHenry September 2018 LOCATION CONTACT DOROTHY M. WOLF, ECONOMIC DEVELOPMENT COORDINATOR City of McHenry 333 S Green Street 60050 815.363.2175 dwolf@ci.mchenry.il.us
Media contact: (202) Thursday, August 21, 2008
 Thursday, August 21, 2008") Internet: http://www.bls.gov/lpc/home.htm USDL 08-1184 Technical information: (202) 691-5618 For release: 10:00 a.m. EDT Media contact: (202) 691-5902 Thursday, August 21, 2008 PRODUCTIVITY AND COSTS BY
Internet: http://www.bls.gov/lpc/home.htm USDL 08-1184 Technical information: (202) 691-5618 For release: 10:00 a.m. EDT Media contact: (202) 691-5902 Thursday, August 21, 2008 PRODUCTIVITY AND COSTS BY
The Bush Record: Jobs -1,634,000 Net Private Sector Jobs Lost In First 3 Years and Eight Months
 Total nonfarm jobs... 131,567 132,388 (821) -0.6% Total private jobs... 109,926 111,560 (1,634) -1.5% Total private production jobs... 89,169 90,716 (1,547) -1.7% Goods-producing... 21,908 24,511 (2,603)
New Jersey s Transportation, Logistics, and Distribution Workforce
 Governor Chris Christie Lt. Governor Kim Guadagno New Jersey s Transportation, Logistics, and Distribution Workforce The Division of Labor Market & Demographic Research New Jersey Department of Labor and
6.1 Economic Impact Analysis... 1
 Table of Contents 6.1... 1 Introduction... 1 Economic Multiplier Effect Definitions... 1 Regional Context... 2 Economic Multiplier Findings... 3 6.2 Methodology... 7... 7 Airport Operational Impacts...
2018 REGIONAL ECONOMIC LABOR OUTLOOK ALIGNMENT
 2018 Western New York Prepared by the CTE Technical Assistance Center of NY www.nyctecenter.org Agriculture, Food and National Resources Council Focus 1 FOCUS AREA: Agriculture Agriculture is WNY s fastest
Regional Prosperity Initiative: Labor Market Information Supplement
 Regional Prosperity Initiative: Labor Market Information Supplement Prepared For: (Region 1) (Alger, Baraga, Chippewa, Delta, Dickinson, Gogebic, Houghton, Iron, Keweenaw, Luce, Mackinac, Marquette, Menominee,
6.1 Economic Impact Analysis... 1
 Table of Contents 6.1... 1 Introduction... 1 Economic Multiplier Effect Definitions... 1 Regional Context... 2 Economic Multiplier Findings... 3 6.2 Methodology... 7... 7 Airport Operational Impacts...
Business-Facts: 3 Digit NAICS Summary 2015
 Business-Facts: 3 Digit NAICS Summary 215 Polygon 1:, Total NAICS Code Business Description Total Establishment Total Employees Sales (in Millions) 11 Agriculture, Forestry, Fishing and Hunting 111 Crop
Yolo County Workforce Innovation Board Industry Clusters of Opportunity
 This report was prepared by the Labor Market Information Division (LMID) of the California Development Department to provide the Workforce Innovation Board () a resource for workforce development and planning.
NH LAKES REGION INDUSTRY CLUSTER ANALYSIS
 NH LAKES REGION INDUSTRY CLUSTER ANALYSIS Prepared for the Lakes Region CEDS Strategy Committee and the Lakes Region Planning Commission MAY 2007 PO Box 3367 Saratoga Springs, NY 12866 (518) 899-2608 www.camoinassociates.com
BusinessCounts Methodology 2015A Release June 2015
 Introduction BusinessCounts is a geographic summary database of business establishments and employees for nearly ten million businesses and one hundred and thirty million employees. The database is available
Business-Facts: 3 Digit NAICS Summary 2015
 Business-Facts: 3 Digit NAICS Summary 215 Polygon 1:, Total NAICS Code Business Description Total Establishment Total Employees Sales (in Millions) 11 Agriculture, Forestry, Fishing and Hunting 111 Crop
Appendix A NAICS Codes and Titles
 Appendix A NAICS Codes and Titles The current analysis of the US economy uses a classification system that is based on the 6-digit North American Industry Classification System (NAICS) introduced in year
APPLIED GEOGRAPHIC SOLUTIONS
 Version Release 2018 Introduction BusinessCounts is a geographic summary database of business establishments and employees for nearly ten million businesses and one hundred and thirty million employees.
EMPLOYMENT AND PAYROLLS 2006 ANNUAL AVERAGES. "Check Out Our Web Site:
 AN PAYROLLS 2006 S "Check Out Our Web Site: www.dllr.state.md.us/lmi/index.htm" MARYLAN EPARTMENT OF LABOR, LICENSING AN REGULATION Office of Workforce Information and Performance 1100 North Eutaw Street
2019 TNCPE Board of Examiners New Examiner Application
 2019 TNCPE Board of Examiners New Examiner Application This form should be completed by applicants who have not served on the TNCPE Board of Examiners within the last two years. Our Mission To drive organizational
ECONOMIC PROFILE NESA
 ECONOMIC PROFILE NESA S.C. Department of Employment & Workforce Labor Market Information 1550 Gadsden Street, PO Box 995 Columbia, SC 29202 803-737-2660 www.scworkforceinfo.com http://www.nesasc.org/ Updated:
2019 TNCPE Board of Examiners Return Examiner Application
 2019 TNCPE Board of Examiners Return Examiner Application This form should be completed by applicants who have served on the TNCPE Board of Examiners within the last two years. Our Mission To drive organizational
Colorado Central Planning Region's Regional Plan for Execution of Workforce Development Activities
 Colorado Central Planning Region's Regional Plan for Execution of Workforce Development Activities Developed in accordance with the Workforce Innovation and Opportunity Act May 2, 2016 Modified April 11,
2018 TNCPE Board of Examiners Return Examiner Application
 2018 TNCPE Board of Examiners Return Examiner Application This form should be completed by applicants who have served on the TNCPE Board of Examiners within the last two years. Our Mission To drive organizational
Workforce Development Financial Literacy Entrepreneurship. Student Guide
 Workforce Development Financial Literacy Entrepreneurship Student Guide STUDENT GUIDEv WELCOME TO JA INSPIRE Your education and skills will enable you to succeed in whatever career you choose. Once you
Louisiana. NAICS code 1. Total recordable cases
 Table A-1. Percent relative standard errors for incidence rates of nonfatal occupational injuries and illnesses by industry and case types, 2012 recordable away from work, job transfer, or All industries
Arts, Entertainment, and Recreation Industry
 Peter Meade, Director John F. Palmieri, Director Arts, Entertainment, and The arts, entertainment, and recreation industry is one of the smaller industries in Boston, making up 2.2% of total employment
Regional Competitive Industry Analysis
 Regional Competitive Industry Analysis Jackson and Josephine Counties October 2016 Josephine Jackson Michael Meyers, Economist (503) 229-6179 michael.meyers@oregon.gov Jill Cuyler, Research Analyst (503)
Total fatal injuries (number) Total. Total Private industry Goods producing
 Total. Total Private industry Goods producing") TABLE A-2. Fatal occupational resulting from transportation and homicides, South Carolina, 2015 Transportation 2 Homicides 2 fatal 117 54 37 4 9 13 13 Private industry 105 47 33 4 6 11 11 Goods producing
TABLE A-2. Fatal occupational resulting from transportation and homicides, South Carolina, 2015 Transportation 2 Homicides 2 fatal 117 54 37 4 9 13 13 Private industry 105 47 33 4 6 11 11 Goods producing
Oklahoma Department of Career and Technology Education
 Oklahoma Department of Career and Technology Education Information Commons September 2016 Oklahoma Food Preparation and Serving Related Occupations Parameters Occupations Code Description 35-0000 Food
INDUSTRY REPORT RETAIL INDUSTRY NOVEMBER 2016
 INDUSTRY REPORT S A N D I E G O C O U N T Y L A B O R M A R K E T A N A LY S I S RETAIL INDUSTRY NOVEMBER 2016 The retail industry sector employs approximately 286,100 workers, making up 19.2% of all jobs
A Year of Unbalanced Growth:
 National Employment Law Project A Year of Unbalanced Growth: Industries, Wages, and the First 12 Months of Job Growth After the Great Recession DATA BRIEF February 2011 In this data brief, we draw on recent
Fatal injuries. Total Goods producing
 Total 120 100.0 82 100.0 12 100.0 26 100.0 Goods producing 51 42.5 39 47.6 -- -- 9 34.6 Natural resources and mining 22 18.3 18 22.0 -- -- 4 15.4 Agriculture, forestry, fishing and hunting 14 11.7 10 12.2
Counts and Density of All Jobs in Work Selection Area in All Workers
 OnTheMap Work Area Profile Report All Jobs for All Workers in. Created by the U.S. Census Bureau s OnTheMap http://onthemap.ces.census.gov on 02/18/2014 s and Density of All Jobs in Work Selection Area
Region One Workforce Investment Board Partnership. Region One Priority Industry Sectors
 Region One Priority Industry Sectors Executive Summary The four priority target sectors selected by Region one includes: Construction (NAICS 236 238, excluding Residential) Manufacturing (NAICS 324-333),
Counts and Density of All Jobs in Work Selection Area in All Workers
 OnTheMap Work Area Profile Report All Jobs for All Workers in. Created by the U.S. Census Bureau s OnTheMap http://onthemap.ces.census.gov on 02/18/2014 s and Density of All Jobs in Work Selection Area
Life Sciences Industry Cluster
 New Jersey s Life Sciences Industry Cluster Prepared by: New Jersey Department of Labor & Workforce Development Office of Research & Information Bureau of Labor Market Information Fall 2017 THE GOAL OF
Transportation, Logistics & Distribution
 New Jersey s Transportation, Logistics & Distribution Industry Cluster Prepared by: New Jersey Department of Labor & Workforce Development Office of Research & Information Bureau of Labor Market Information
Alberta Ministry of Labour 2015 Alberta Wage and Salary Survey
 Alberta Ministry of Labour 2015 Alberta Wage and Salary Survey The Alberta Wage and Salary Survey is undertaken by the Alberta Ministry of Labour to provide current wage rates and skill shortage information
Massachusetts Employment Projections Through 2014
 Massachusetts Employment Projections Through 2014 Massachusetts Department of Workforce Development Table of contents Overview 3 Job Growth by Major Industry Sector 6 Impact on workers 18 Impact on Education
COMMUNITY WORKPLACE POPULATION Cuero, Texas
 COMMUNITY WORKPLACE POPULATION Prepared for Cuero Development Corporation December 2016 LOCATION FortMorganCO_RTA_Map_2016 CUERO CONTACT PATRICK J. KENNEDY, EDFP, EXECUTIVE DIRECTOR 0 mi Cuero Development
Napa Hospitality! A Workforce Needs and Characteristics Study of the Napa County Hospitality and Tourism Industry
 Napa Hospitality! A Workforce Needs and Characteristics Study of the Napa County Hospitality and Tourism Industry 2007-2008 Napa Hospitality! A Workforce Needs and Characteristics Study of the Napa County
Kentuckiana Occupational Outlook Projected Occupational Growth,
 Kentuckiana Occupational Outlook Occupational, 2008-2018 by Barry Kornstein Research Manager College of Business University of Louisville June 2010 Researchers at the University of Louisville have produced
Alberta Ministry of Labour 2017 Alberta Wage and Salary Survey
 Alberta Ministry of Labour 2017 Alberta Wage and Salary Survey The Alberta Wage and Salary Survey is undertaken by the Alberta Ministry of Labour to provide current wage rates and skill shortage information
Nevada County Labor Market Profile and Industry/Sector Analysis. Northern Rural Training and Employment Consortium (NoRTEC) November 2016
 November 2016") Northern Rural Training and Employment Consortium (NoRTEC) Nevada County Labor Market Profile and Industry/Sector Analysis November 2016 Prepared for: NoRTEC Workforce Development Board Michael Cross,
Northern Rural Training and Employment Consortium (NoRTEC) Nevada County Labor Market Profile and Industry/Sector Analysis November 2016 Prepared for: NoRTEC Workforce Development Board Michael Cross,
COMMUNITY WORKPLACE POPULATION Manvel, Texas
 COMMUNITY WORKPLACE POPULATION Prepared for Manvel Economic Development Corporation August 2016 LOCATION MANVEL CONTACT KYLE J. JUNG, CITY MANAGER City of Manvel 20025 Highway 6 77578 281.489.0630 281.489.0634
Occupational Insights Report Hartford County. Third Quarter, 2016
 Occupational Insights Report Hartford County Third Quarter, 2016 Occupational Insights Report Contents Jobs Growth and Online Postings in Hartford County... 3 U.S. Help Wanted Online Trend... 3 Highlights
EMPLOYMENT PROJECTIONS
 For release 10:00 a.m. (EST) Thursday, December 10, 2009 USDL-09-1503 Technical information: (202) 691-5700 ep-info@bls.gov www.bls.gov/emp Media contact: (202) 691-5902 PressOffice@bls.gov NOTE: This
Lassen County Labor Market Profile and Industry/Sector Analysis. Northern Rural Training and Employment Consortium (NoRTEC) November 2016
 November 2016") Northern Rural Training and Employment Consortium (NoRTEC) Lassen County Labor Market Profile and November 2016 Prepared for: NoRTEC Workforce Development Board Michael Cross, Executive Director Acknowledgements
Northern Rural Training and Employment Consortium (NoRTEC) Lassen County Labor Market Profile and November 2016 Prepared for: NoRTEC Workforce Development Board Michael Cross, Executive Director Acknowledgements
Modoc County Labor Market Profile and Industry/Sector Analysis. Northern Rural Training and Employment Consortium (NoRTEC) November 2016
 November 2016") Northern Rural Training and Employment Consortium (NoRTEC) Modoc County Labor Market Profile and November 2016 Prepared for: NoRTEC Workforce Development Board Michael Cross, Executive Director Acknowledgements
Northern Rural Training and Employment Consortium (NoRTEC) Modoc County Labor Market Profile and November 2016 Prepared for: NoRTEC Workforce Development Board Michael Cross, Executive Director Acknowledgements
Hospitality Management Occupation Overview
 Hospitality Management Occupation Overview Emsi Q1 2018 Data Set March 2018 Western Technical College 400 Seventh Street La Crosse, Wisconsin 54601 608.785.9200 Emsi Q1 2018 Data Set www.economicmodeling.com
Tehama County Labor Market Profile and Industry/Sector Analysis. Northern Rural Training and Employment Consortium (NoRTEC) October 2016
 October 2016") Northern Rural Training and Employment Consortium (NoRTEC) Tehama County Labor Market Profile and Industry/Sector Analysis October 2016 Prepared for: NoRTEC Workforce Development Board Michael Cross, Executive
Northern Rural Training and Employment Consortium (NoRTEC) Tehama County Labor Market Profile and Industry/Sector Analysis October 2016 Prepared for: NoRTEC Workforce Development Board Michael Cross, Executive
5-MILE RADIAL WORKPLACE POPULATION Mansfield, Texas
 5-MILE RADIAL WORKPLACE POPULATION Prepared for Mansfield Economic Development Corporation June 2016 5-MILE RADIAL Grand Prairie, Texas, United States MANSFIELD CONTACT RICHARD NEVINS, ASSISTANT DIRECTOR
Economic Impact of the US Gaming Industry. American Gaming Association
 Economic Impact of the US Gaming Industry American Gaming Association June 2018 Table of contents Overview 3 Section 1: Gaming industry direct spending 5 Section 2: Gaming industry economic impact 11 Section
Employment and Wage Trends 3 rd Quarter 2015 for the Construction Sector by Parish
 Construction Sector Profile for New Orleans RLMA The Labor Market information (LMI) division of Research and Statistics helps provide information on various sectors in the regional economy. Reports and
Regional Prosperity Initiative: Labor Market Information Supplement
 Regional Prosperity Initiative: Labor Market Information Supplement Prepared For: (Region 8) (Berrien, Branch, Calhoun, Cass, Kalamazoo, St. Joseph, and Van Buren) Prepared By: State of Michigan Department
Appetite for Analytics
 Appetite for Analytics Basic LMI Training November 27, 2018 Connect to internet Connect to the internet Open data files 2 Welcome & Introductions 1. Your name and your role 2. How do you use labor market
Regional Competitive Industry Analysis
 Regional Competitive Industry Analysis Clackamas, Multnomah, and Washington Counties July 2017 Washington Multnomah Clackamas Michael Meyers, Economist (503) 229-6179 michael.meyers@oregon.gov Jill Cuyler,
Fatal injuries. Total Goods producing
 Total 96 100.0 65 100.0 10 100.0 21 100.0 Goods producing 35 36.5 29 44.6 -- -- 6 28.6 Natural resources and mining 6 6.3 4 6.2 -- -- -- -- Agriculture, forestry, fishing and hunting 6 6.3 4 6.2 -- --
Professional, Scientific, and Technical Services Sector Profile for the Monroe Region
 Professional, Scientific, and Technical Services Sector Profile for the Monroe Region The Labor Market information (LMI) division of Research and Statistics helps provide information on various sectors
REGIONAL WORKFORCE PROFILE
 REGIONAL WORKFORCE PROFILE Lake of the Ozarks Regional Economic Development Council Camden County Miller County Morgan County NOVEMBER 2016 Table of Contents Topic Page Purpose 2 Executive Summary 3 Overview
MIDDLE-INCOME JOB DECLINE IN PENNSYLVANIA
 MIDDLE-INCOME JOB DECLINE IN PENNSYLVANIA Update 2001-13: Business-Cycle, Great Recession and Recovery Prepared at the Center for Economic and Community Development by: Theodore R. Alter, Regional Economist
Fact Sheet Information about job types and industries
 www.workingforeveryone.com Fact Sheet Information about job types and industries Use this fact sheet to help you: Identify different jobs you have worked in or are interested in Identify different industries
JUNE Methodology Statement: Esri Retail MarketPlace
 JUNE 2018 2017 Methodology Statement: Esri Retail MarketPlace Copyright 2018 Esri All rights reserved. Printed in the United States of America. The information contained in this document is the exclusive
San Diego Economy Drought-Resistant, With Exceptions KEY FINDINGS
 San Diego Economy Drought-Resistant, With Exceptions KEY FINDINGS On average, non-agricultural private sector businesses in San Diego County annually use 6,887 cubic feet (54,341 gallons) of water for
Kentuckiana Occupational Outlook Projected Occupational Growth,
 Kentuckiana Occupational Outlook Occupational Growth, 2010-2020 by Barry Kornstein Research Manager Urban Studies Institute University of Louisville January 2013 R esearchers at the University of Louisville
2017 Methodology Statement: Esri Retail MarketPlace. An Esri White Paper June 2017
 2017 Methodology Statement: Esri Retail MarketPlace An Esri White Paper June 2017 Copyright 2017 Esri All rights reserved. Printed in the United States of America. The information contained in this document
Industry Overview. 45-Minute Drive Time from Athens-Clarke County City Hall Source: EMSI, 2017.Q % Avg. Earnings
 Industry Overview 45-Minute Drive Time from Athens-Clarke County City Hall Source: EMSI,.Q4 NAICS Description Jobs 2027 Jobs - 2027 % Avg. Earnings Change Per Job 111 Crop Production 299 315 5% $30,827
Workforce Innovation and Opportunity Act (WIOA) Regional Plan
 Regional Plan") ! Workforce Innovation and Opportunity Act (WIOA) Regional Plan Kansas Local Area I and IV! 1 PY16 Regional Plan Signature Page Local Area I and V Four Year Regional Plan Agreement July 1, 2017 Pursuant
! Workforce Innovation and Opportunity Act (WIOA) Regional Plan Kansas Local Area I and IV! 1 PY16 Regional Plan Signature Page Local Area I and V Four Year Regional Plan Agreement July 1, 2017 Pursuant
Workforce Oklahoma Employment Outlook 2010
 Workforce Oklahoma Oklahoma Security Commission Economic Research and Analysis Division Will Rogers Memorial Office Building Labor Market Information Unit, 4 th Floor N P.O. Box 52003 Oklahoma City, OK
THE ECONOMIC IMPACT OF INFORMATION TECHNOLOGIES AFTER THE FINANCIAL CRISIS
 THE ECONOMIC IMPACT OF INFORMATION TECHNOLOGIES AFTER THE FINANCIAL CRISIS Dale W. Jorgenson, Harvard University http://economics.harvard.edu/faculty/jorgenson/ Keynote Lecture to the Annual Conference
Labor and Business Statistics For Fidalgo Island (Zip code 98221)
") Labor and Business Statistics For Fidalgo Island (Zip code 98221) May 27, 2016 Prepared for Anacortes Chamber of Commerce Prepared by Table of Contents Notes About This Report... 3 About the Authors...
Labor and Business Statistics For Fidalgo Island (Zip code 98221) May 27, 2016 Prepared for Anacortes Chamber of Commerce Prepared by Table of Contents Notes About This Report... 3 About the Authors...
Occupational Insights Report Hartford County. First Quarter, 2017
 Occupational Insights Report Hartford County First Quarter, 2017 Occupational Insights Report Contents Jobs Growth and Online Postings in Hartford County... 3 U.S. Help Wanted Online Trend... 3 Highlights
DATA BRIEF: RETAIL JOBS TODAY. January 2016 FAIR WORKWEEK INITIATIVE
 DATA BRIEF: RETAIL JOBS TODAY January 216 FAIR WORKWEEK INITIATIVE EXECUTIVE SUMMARY Retail salesperson is now the most common occupation in the country. 1 One in ten workers over 16 million people are
TOURISM WORKFORCE STUDY
 TOURISM WORKFORCE STUDY REGIONAL TOURISM ORGANIZATION 7 Between August 14 and October 8, 2012, a total of 274 tourism sector employers (RTO 7 together with RTO 4) provided responses to an on-line survey.
RETAIL TRADE Workforce Demographics
 RETAIL TRADE Workforce Demographics Maryland Department of Labor, Licensing and Regulation Division of Workforce Development Office of Workforce Information and Performance 1100 N. Eutaw Street, Room 316
Regional Competitive Industry Analysis
 Regional Competitive Industry Analysis Baker, Union, and Wallowa Counties October 2017 Union Wallowa Baker Michael Meyers, Economist (503) 229-6179 michael.meyers@oregon.gov Jill Cuyler, Research Analyst
Occupation Overview. EMSI Q Data Set. Sales Management October Western Technical College
 Occupation Overview EMSI Q2 2015 Data Set Sales Management October 2015 Western Technical College 400 Seventh Street La Crosse, Wisconsin 54601 608.785.9200 EMSI Q2 2015 Data Set www.economicmodeling.com
Economic and Workforce Information Analysis
 Economic and Workforce Information Analysis April 2013 2725 JEFFERSON STREET, SUITE 13, CARLSBAD CA 92008 50 MILL POND DRIVE, WRENTHAM, MA 02093 T (760) 730-9325 F (888) 457-9598 bwresearch.com twitter.com/bw_research
BENEFITS OF ADVERTISING ON NJ.COM
 Media Kit 2008 Benefits of Advertising...2 About Us...3 Advertising Opportunities...5 Jobs Advertising...6 Real Estate Advertising...8 Automobile Advertising...9 BENEFITS OF ADVERTISING ON NJ.COM NJ.com
The Pittsburgh Region s Economy: Stronger Than It May Seem
 The s Economy: Stronger Than It May Seem March 2006 EXECUTIVE SUMMARY Although the overall rate of job growth in the was much slower than in the U.S. over the past six years, the gap was caused by two
WORLD KLEMS AND ASIA KLEMS
 WORLD KLEMS AND ASIA KLEMS By Dale W. Jorgenson Harvard University First Asia KLEMS Conference Asian Development Bank Institute Tokyo, Japan July 27, 2011 http://economics.harvard.edu/faculty/jorgenson/
4701 Sangamore Road Suite S240 Bethesda, MD
 4701 Sangamore Road Suite S240 Bethesda, MD 20816 301.320.6900 www.tischlerbise.com To: Emily Crow, AICP, Senior Planner McBride Dale Clarion From: Julie Herlands, AICP, Vice President, TischlerBise Date:
Capitol Region Industry Clusters of Opportunity
 This report was prepared by the Labor Market Information Division (LMID) of the California Development Department to provide the Golden Sierra, North Central Counties Consortium, Sacramento and Training
Freight Transportation Challenge More Trucks, More Fuel, More GHGs?
 Freight Transportation Challenge More Trucks, More Fuel, More GHGs? presented to Thirteenth Biennial Conference on Transportation Energy and Policy Asilomar Conference Center Pacific Grove, California
Workforce Now A Regional Research Initiative Workforce Overview Study 2013
 Workforce Now A Regional Research Initiative Workforce Overview Study 2013 PREPARED BY: WORKFORCE NOW STUDY TEAM School of Business & Technology Regional Economic Research Institute Lutgert College of
Regional Competitive Industry Analysis
 Regional Competitive Industry Analysis Marion, Polk, and Yamhill Counties June 2017 Yamhill Polk Marion Michael Meyers, Economist (503) 229-6179 michael.meyers@oregon.gov Jill Cuyler, Research Analyst
Butte County Labor Market Profile and Industry/Sector Analysis. Northern Rural Training and Employment Consortium (NoRTEC) November 2016
 November 2016") Northern Rural Training and Employment Consortium (NoRTEC) Butte County Labor Market Profile and November 2016 Prepared for: NoRTEC Workforce Development Board Michael Cross, Executive Director Acknowledgements
Northern Rural Training and Employment Consortium (NoRTEC) Butte County Labor Market Profile and November 2016 Prepared for: NoRTEC Workforce Development Board Michael Cross, Executive Director Acknowledgements
Alberta Ministry of Labour 2015 Alberta Wage and Salary Survey
 Alberta Ministry of Labour 2015 Alberta Wage and Salary Survey The Alberta Wage and Salary Survey is undertaken by the Alberta Ministry of Labour to provide current wage rates and skill shortage information