Master Thesis A Study of Relationship between Patents and Nascent Entrepreneurial Activity
|
|
|
- Neal Hoover
- 6 years ago
- Views:
Transcription
1 Master Thesis A Study of Relationship between Patents and Nascent Entrepreneurial Activity Program: Entrepreneurship and Strategy Economics Thesis author: Alexandr Basso Thesis supervisor: Dr Philipp Koellinger 1
2 Table of content Thesis abstract 3 Thesis introduction 4 Research question 5 Theory and Literature 5 Data 9 Research methodology 11 Analysis and Results 14 Test 1 14 Test 2 16 Test 3 19 Test 4 24 Test 5 26 Discussion and Conclusion 27 Used Literature 29 Appendix 31 2
3 THESIS ABSTRACT Entrepreneurship has gained an important role in eyes of both policy makes, as well as researchers around the world. The effects of that can be felt through the increasing support provided by the governments toward entrepreneurial activity. To date, several links have already been made between entrepreneurial activity and economic growth, but what about patents? Can patents be used to represent the knowledge factor in the economic growth? This paper performs regressions on nascent entrepreneurial activity and patent application for eleven OECD countries in order find what kind of relationship exists between the two. The product of this research provides indication to a possible relationship and further study of this topic could help explain entrepreneurship as a knowledge filter. Keywords: nascent entrepreneurial activity, patents, knowledge, innovation 3
4 THESIS INTRODUCTION In recent years, entrepreneurship has been recognized to have a significant role in innovation and economic growth, as well as its contribution to the prosperity and economic welfare (Schramm, 2006, Acs & Armington 2006, Hoenig 2005, Audretsch 2006, Acs et al 2012). Following the economic crises (dot-com bubble , US housing bubble , global financial crisis ) that happened in that last decade, a lot of problems have risen: high unemployment rates, drop in market revenues and demand. One of the measures taken by the policy makers to deal with those problems is the promotion of entrepreneurship. There are two types of entrepreneurship (Louis Jacques Filion, 1998) and out of the two it is the innovative, not the replicative entrepreneurship that brings new wealth to the economy. What policy makers aim to promote is entrepreneurship, however nascent entrepreneurship is what leads to future start-ups, as such many of policies have been aimed at assisting and encouraging those that are in the process of making a business. Furthermore, in current day and age, to a certain degree, with enough funding it is rather easy to copy someone s product or idea, as such individuals and companies aim to protect themselves through patenting of those ideas. It can be seen that patents represent new ideas and those ideas in consequence create innovation and fuel entrepreneurship. Even though it is in the stage of emergence, it can be said that patents are a market of their own (Mark A. Lemley, 2007). Some research has already been done on the topics related of patents and entrepreneurship (Scott Shane, 2002), however most of the papers only touch on the subject, but do not try to find the actual relationship between the two. To make the study narrower, this paper observes the relationship between patents applied and nascent entrepreneurial activity. In earlier studies, the relationship between the two has been overlooked to a point of being taken for granted, be that for lack of data, or taking a positive relationship as something that is a given. This study aims to clarify and bring some light to the matter of the whether there is strong correlation between the two, or if there is any relationship at all. 4
5 RESEARCH QUESTION The aim of the research is to bring increasing attention to the importance of the relationship between patents and entrepreneurship. As already mentioned, this relationship is not provided with enough attention and further consideration on patents polices can change entrepreneurial activity for the better. Thus, in order to bring more attention to the subject, this thesis is aimed answering this following specific research questions: Research Question: "What kind of relationship do patents and nascent entrepreneurship activity have within OECD countries? Can high correlation be confirmed, or is there any relationship at all? Is it possible to relate one to the other with causation, not simply correlation?" THEORY AND LITERATURE In order to achieve a coherent theory as to why would patents have an effect on entrepreneurship, lets us take a look back on the first time that knowledge was recognized as not the same, as an economically relevant knowledge. In 1956 Solow s article triggered a large literature linking the traditional factors of production, capital and labor to economic growth. He observed that contribution of additional labor and capital could not explain increases in growth over time. Arrow (1962) was the first one to suggest that spillovers may not occur automatically, recognizing that knowledge is not the same thing as economical relevant knowledge. The endogenous growth proponents at a later time picked up that idea in order to incorporate knowledge in to the growth model - this is where history truly starts for the aggregate knowledge. Endogenous growth theory core point is that economic growth is primarily the result of endogenous and not exogenous factors. Under this theory, investments into innovation, human capital and knowledge are the big contributors to economic growth. There are many factors that are considered under endogenous growth theory; some of them are positive externalities and spillover effects, which are also part of the main focus of this theory. Other 5
6 effects are also considered in some models, for example policy measures can have an impact on the long run growth rate of an economy. The simplest representation of endogenous model would be the AK model: Y = A K α L 1-α This is a Cobb-Douglas function where Y represents the total product in an economy. A represents the total factor productivity, K is capital, L is labor and α measures the output elasticity of capital. As already mentioned this is the simplest representation, but this should be enough to give an idea, of how the models look. The main intellectual achievement by the endogenous growth theory is the recognition that an investment in the knowledge and human capital endogenously generates economic growth by means of spillover of knowledge. In history there have been several steps in the evolution of the endogenous growth theory. The first one is a natural response to the presence of market opportunities, which is the formation of knowledge and human capital. The first to provide endogenous growth models, with knowledge incorporated in to the model, where Romer (1986), Luca (1988), Rebelo (1991) and many others. One thing in common for all proposed models was that they focused mainly on the influence of knowledge spillovers on growth without providing any explanation as to how the knowledge actually spills over. Nevertheless, even without explaining how the knowledge spills over, the important issue of spillover of knowledge has been addressed, with aggregate knowledge capital being defined as a composition of R&D and human capital. To a degree the lack of explanation as to how did the knowledge spillover remained in the second step of evolution of the endogenous growth theory proposed by Schmitz (1989), Aghion and Howitt (1992), Chend and Dinopoulos 1993, Segerstrom (1995) and others. In this step, the neo-schumpeterian models proposed where defining entry as an R&D race where only a small part of that R&D will bring about successful innovations. Even though compared to the first step it was an improvement, the problem with proposed models was that the Schumpeterian entrepreneur is not present in any of them. Schumpeter (1947) said: the inventor produces ideas, the entrepreneur gets things done.. an idea or scientific principle is not, by itself, of any importance for economic practice., therefor simple interpretation of R&D races, that mostly involve incumbents and focus on quality improvements of existing goods, is not enough to describe innovation process. 6
7 Later on, in paper of Acs et al. (2004) an attempt is made in extending the endogenous growth model and resulted in model that suggest how knowledge is converted into economic knowledge, as well as how economic knowledge influences growth. Building on Romer (1990) a model is elaborated in which there are two methods of developing new products. Same as in the original, incumbents undertake R&D by employing research labor, which generates new knowledge. Even though knowledge is generated, it does not constitute economic growth. By making use of entrepreneurship, economic growth can be distributed in countries that do not have high R&D spending through firm startups. In that paper entrepreneurship is taken as one type of mechanisms that reduces the knowledge filter. The process of starting a new firm commercializes knowledge that might not be commercialized under different circumstances. Those results are consistent with at that time existing empirical evidence, linking measure of entrepreneurship to economic growth. The end conclusion for that paper is that growth is enhanced through individual entrepreneurs exploiting knowledge, without producing any knowledge themselves. This conclusion reflects well on how entrepreneurship promotion has been targeted in the policies in most OECD countries. Further work is done on the same subject in Growth and Entrepreneurship by Acs et al (2012), where authors suggest that spillover knowledge does not occur automatically as normally assumed in endogenous growth model. Entrepreneurship is considered as one of those mechanisms facilitating the spillover of knowledge, thereby contributing to economic growth. By using panel data of 18 countries, authors provide empirical evidence that besides R&D and human capital, entrepreneurial activity, also serves to promote economic growth, more specifically that it has a positive and systematic impact on economic growth. The model that is used by authors makes use of several testable predictions. Starting with growth being influenced by R&D spending and entrepreneurship at the country level, followed by assumption that countries with relatively low R&D spending may still be able to have high growth because of larger share of entrepreneurship. With that trend of thought R&D and entrepreneurship to a degree could be considered either substitutes, or complements to each other. To further point at the importance of knowledge spillover conduits, it is important to notice that the empirical results suggest that regardless of R&D spending, those countries that generate a greater degree of entrepreneurial activity exhibit systematically higher rates of 7
8 economic growth. These findings are consistent with the idea that nascent entrepreneurship is related to patents, which represent non-economical relevant knowledge. Another paper that is of interest for this thesis is a survey and statically analysis done by Bo Carlsson and Ann-Charlotte Fridh (2002), where authors attempt to better understand the role of office of technology transfer. Those offices exist in order to better facilitate commercialization of research results in universities and similar institutions. The results of their study showed that technology transfer from universities to commercial sector needs to be understood in a broader context, hinting at the need of finding the proper balance between the basic function of teaching and researching within the universities on the one side and providing service to the larger community on the other. Several stages in the technology transfer process can be observed, each associated with its own outcome: invention disclosure, patent application, patent issued, license sold, license income and/or business start-ups. Interesting results come out from their statistics, only about a half of the invention disclosures result in patent applications; out of those a half of the applications result in patents; only a third of patents are licensed, and only a handful (ten to twenty percent) of licenses yield substantial income. That lead to median gross license income in 1996 of 2.2 million dollars and the median income per license was 80,000 dollars. This shows how little knowledge is actually made in to economically relevant knowledge. Following the evolution of endogenous growth model to the latest development where knowledge spillovers are accounted for, as well as empirical results for the relationship between patents and commercialized knowledge, it is safe to assume that patent applications can serve well as an indicator for economical knowledge and nascent entrepreneurship as the knowledge filter. This assumption provides sufficient grounds to search for the relationship between nascent entrepreneurial activity and patents. From this the main hypothesis can be derived. Main Hypothesis: Nascent entrepreneurial activity has positive relationship to the number of patent applied. 8
9 DATA This study makes use of GEM data in order to formulate the nascent entrepreneurial activity and OECD data to account for patents growth through the years. Control variables will be taken from those datasets: such as real GDP-growth, TEA, employment rates. The GEM is a worldwide research project, thus it allows for comparison across large number of countries. This database is designed to analyze and describe entrepreneurial activity, as well as institutional conditions. The GEM dataset has individual data, as such in order to make it useful, aggregate data has been computed by combining specific variables, using the right filters and computing the means in Stata. The OECD data is already aggregated; as such there should be no need for aggregation of values for those variables. All the countries considered in this study participated each year from 2002 till 2008 in GEM and OECD surveys. The data has filtered people by age and limit them to the age of 18 to 64 years old, because this is considered to be the working population in most countries. Countries used in this dataset are: USA, Netherlands, Belgium, France, Spain, UK, Denmark, Norway, Japan, Ireland, Finland. The main use of GEM is to formulate the nascent entrepreneurial activity; however we take another important variable from them: TEA - an index to measure early-stage and new entrepreneurial activity. This index comprises nascent entrepreneurs and young business owners (business that existed for less than 42 months). Total Entrepreneurial Activity is used in order to derive the nascent entrepreneurial activity, as such it can be used in the model as a control variable. The OECD data is mainly used to provide the information about the amount of patents generated for the selected countries and as a reference point the amount generated in the world for the relevant years. Four variables are made to represent patents: 1) Patents applied under European Patent Office worldwide, 2) Patents applied under Patent Cooperation Treaty worldwide, 3) Patents applied under European Patent Office in individual countries and 4) Patents applied under Patent Cooperation Treaty in individual countries. The first two represent worldwide level of applied patents under two means (EPO and PCT) and the second two represent patents applied in individual countries (11 OECD countries) under the same 9
10 two means. The main differences between the EPO and PCT, is that under the first one patents are applied for the euro zone meaning that patents are grated for all members of European Patent Office, while the second one is called the international application for country members around the world this application form reaches a lot more countries. To present date, there is no data available or known way to formulate how relevant each patent is, as such we will consider all patents equality important. Two of the variables to be used from this data are the unemployment rate and real GDP-growth. Those control variables are necessary to see the relationship between patents and nascent entrepreneurship. Table 1. Description of all variables - partial. Full Description of all used variables can be found in the Appendix Table 1.1 Dependent variables, GEM Variable notation Nascent entrepreneurship Entrep (suboanw) Independent variables, OECD data European Patent Office PA_EPO_world (PA_EPO) Patent Cooperation Treaty PA_ PCT_world (PA_PCT) European Patent Office in individual country PA_EPO_country (PA_EPO_ind) Patent Cooperation Treaty in individual country PA_PCT_country (PA_PCT_ind) Other variables, GEM, OECD TEA GDP Harmonized unemployment rate (unempl) Unempl1-Unempl6 Notes: Definition = the rate of individuals who claim to be engaged in starting a business they will at least partially own and that has paid wages or profits for no more than 6 months. Patents applied under European Patent Office worldwide Patents applied under Patent Cooperation Treaty worldwide Patents applied under European Patent Office in individual country Patents applied under Patent Cooperation Treaty in individual country = Total early-stage entrepreneurial activity = Billion US dollars, current prices and PPPs, real GDP = comparable unemployment rates = time lags of unemployment rate For better understanding of the reader, variables mentioned in the paper are called differently from what they are called in the dataset. Names in the brackets is how variables are named in the dataset - ( ) 10
11 RESEARCH METHODOLOGY In this section the methodology to find the relationship between patents and nascent entrepreneurial activity will be discussed. Five tests will be performed in order to find out the relationship between nascent entrepreneurship activity and patents. In the First Test, linear correlation is to be checked, to see if there is any correlation between the variables at all. This is done with the help of "pwcorr" function in Stata, it displays all the pairwise correlation coefficients between the variables specified. For this test all control variables are included, independent variables and dependent variables ( Entrep, unempl, PA_EPO_country, PA_PCT_country, PA_EPO_world, PA_PCT_world, PA_EPO_country2, PA_PCT_country2, PA_EPO_world2, PA_PCT_world2, GDP), no lags or dummies are included. After running the test found correlations will be evaluated based on strength (None-Strong) and sign (Positive-Negative). This should give a general idea of the relationship between the variables in the dataset. In the Second Test, tests will be performed in order to check for the possible multicollinearity issues. It is necessary to test for multicollinearity in all eleven OECD countries individually and on worldwide scale, for both patents applied under European Patent office and Patent Cooperation Treaty. This is done by the normal "collin" function in Stata. It is possible to establish, if there are multicollinearity problems by looking at the VIF (variance inflation factor) and the R-squared. Furthermore, since the purpose is to test the main hypothesis, it is best to establish, if normality is present. Normality assumption provides greater certainty that p-values for the t- tests and F-test will be valid. This is done by examining the plot of a standardized normal probability ("pnorm" in Stata) and the plot of the quantiles of a variable against the quantiles of a normal distribution ("qnorm" in Stata). "pnorm" is sensitive to non-normality in the middle range of data and "qnorm" is sensitive to non-normality near the tails. In addition Shapiro-Wilk W test is performed to further check for normality, this test assumes that the p- value is based on the assumption that the distribution is normal, by examine the p-value we can see, if the residuals are normally distributed. 11
12 Third Test runs fixed and random effects linear models on the dataset, while applying Hausman test on both of them. In simplest terms, random effects model stands from the point where the independent variables have a random nature, while the fixed effect model considers the independent variables to have no random nature. It is fair to assume that more important test here is the fixed effects model, because within fixed effects model there is a consideration that exogenous effects can play a role in the model, however random effects model can provide better results, if the model is described well (more complete). However, since we perform Hausman test, we can see which of the two is more suited to be interpreted. Following Nickell (1981) and Diggle (2002), it can be concluded that the fixed effects model eliminates unobserved time-invariant of individual effects with use of the within transformation. As for the random effects model, it is assumed that all errors are already counted in the model - no exogenous effects exist, thus no outside effects are considered. (Christensen, 2002 and Baltagi& Chang, 1994). It is rather impossible for all possible error reasons to be included in to the model; as such random effect model seems to be of a lesser use. This does not meant that random effects model will be ignored, RE model will be considered as much as fixed effects model and in the end, the two will be compared. Normally control variables should not be used in random and fixed effects models; however time dummies will be introduced, as well as unemployment rate and GDP as a control variable in order to at least to a degree account for necessity entrepreneurial activity. Afterwards, the Hausman specification test will be used in Stata to test the difference between the random and fixed effect model. This test is mostly to see how great of the effect do the exogenous factors make in our model and help decide which of the two tests is best suited to be considered for interpretation. The tests will be performed in two steps: for country level data and for worldwide level data. This is necessary to see if there is a difference between the local and global effects of patents on entrepreneurship. The tests will also be performed first without control variables and then with control variables in order see the difference in effects. The effect of patents on nascent entrepreneurship regardless, if it is positive or negative is very small. The reason for that is because only about half of all inventions disclosures in U.S. universities result in patent applications and half of those applications result in patents. About one third of patents are licensed and only ten to twenty percent of 12
13 licenses yield significant income (Carlsson and Fridh 2002, page 231). Meaning that only about two percent of inventions are successful in reaching the market and providing income and not all of those are used by nascent entrepreneurism, some are integrated in already established businesses. As already mentioned before, patent applications do not relate in a one to one ratio to successful new startups, existence of entrepreneurship is what slightly increases conversion of general knowledge in to economically relevant knowledge. This statistic forces us to expect very minuscule betas, as such for evaluation elasticity ( d(lny)/d(lnx) ) will be provided instead. Elasticity s are used to show the ration of the percentage change in nascent entrepreneurship to the percentage change in the patents applied under two policies (EPO and PCT). In the Forth Test, tests are performed in order to check, if there is a non-linear relationship between the nascent entrepreneurship and patents. Compared to the third test, the squared value of the independent variable are added to the model, this should help ascertain, if there are hints to the relationship being non-linear. Same as in the previous test, this will be done without control variables and with control variables, however only for the individual countries. The Fifth Test is more of a robustness check then an actual test. Same as in the fourth test an additional variable is added, however this time one year lag are used instead of squares of the main independent variable. The same random and fixed effects models will be used for country level and worldwide level for both types of patent application. This test is performed to see, if the coefficients change much compared to the original regressions. In case of not a significant change, it can be considered that coefficients are robust, also if signs and magnitudes of the estimated regression are also plausible, this is usually taken as evidence that regression coefficients can be reliable interpreted as the true causal effects Halbert White and Xun Lu (2010). Note: World level tests they are not expected to yield any significant results and they are to be compared to the country level regressions for comparison. The tests that are performed on the world level are performed only for the referential purposes. 13
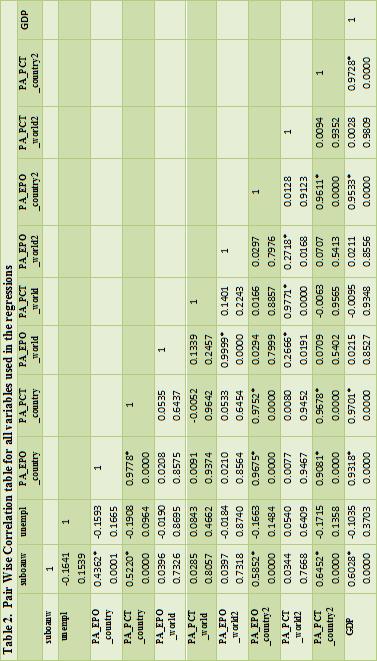
14 Analysis and Results First Test - Testing for Linear correlation First, testing for the correlation between the variables is performed, in order to see the measure of the strength and direction of the linear relationship between two variables. This is done with "pwcorr" command in Stata, which tests the pair wise correlation. Pearson product-moment correlation coefficient, also known as r, R, or Pearson's r, a measure of the strength and direction of the linear relationship between two variables that is defined in terms of the covariance of the variables divided by their standard deviations. The strength of the relationship is in accordance to Cohen, J. (1988) and is defined as such: Correlation Negative Positive None 0.09 to to 0.09 Small 0.3 to to 0.3 Medium 0.5 to to 0.5 Strong 1.0 to to
15 15
16 Results for first test: From table above we can see that Patents applied under European Patent Office and Patent Cooperation Treaty in individual countries have a positive medium level of relationship with Nascent Entrepreneurship of and 5220, with both of those results being statistically significant on 95% confidence interval. It is interesting to note that the relationship between the nascent entrepreneurship and Patents applied around the world is not statistically significant. This should indicate that there are some effects on the world scale that are not present when observing the relationship in the individual countries. It should be also interesting to point out that on average an increase in patent application both in individual countries and around the world is correlated to a decrease in unemployment. Control variables GDP have a strong positive linear relationship with nascent entrepreneurship, while the unemployment rate has a small negative not statistically significant relationship. This strong correlation of GDP is expected, as there is strong relationship between growth and entrepreneurship Acs et al (2012). GDP has a strong positive linear relationship with the Patents applied under both patent EOP and PCT, which indicates strong multicollinearity problems. Even though this problem is present, excluding GDP from regressions is not advised; as such GDP will still be used as a control variable. On a further note, GDP having a strong relationship patents applied seems intuitively correct, as wealthier countries generally do have a higher invest in Research and Development Second Test - Testing for Multicollinearity Since in our models we are going to use several variables, it is best to test for multicollinearity, in addition to the pair wise correlation test. The main problem is that the more variables are used in models the more the degree of multicollinearit increases, as such the regression model estimates of the coefficients become unstable and the standard errors for the coefficients can get significantly inflated. This test will be done with "VIF" command 16
17 in Stata. VIF stands for Variance Inflation Factor, generally VIF greater than 10 is a problem, however VIF below 10 can be tolerated, even though it does not indicate a good degree of inflation. R-squared will also be a good indication of how well the variables fit together. Results for the VIF test can be seen below in the Table 3. Table 3 Multicollinearity Test - VIF (variance inflation factor) Table 3.1 Multicollinearity Test - for Patents applied under European Patent Office in individual country s Variable VIF SQRT VIF Tolerance R-squared PA_EPO_country GDP unempl Mean VIF 5.52 Table 3.2 Multicollinearity Test - for Patents applied under Patent Cooperation Treaty in individual country s Variable VIF SQRT VIF Tolerance R-squared PA_PCT_country GDP unempl Mean VIF 5.52 Table 3.3 Multicollinearity Test - for Patents applied under European Patent Office worldwide Variable VIF SQRT VIF Tolerance R-squared PA_EPO_world GDP unempl Mean VIF 1.01 Table 3.4 Multicollinearity Test - for Patents applied under Patent Cooperation Treaty worldwide Variable VIF SQRT VIF Tolerance R-squared PA_PCT_world GDP unempl Mean VIF 1.01 After the VIF test, with Stata commands "pnorm" and "qnorm" tests are performed, to draw the graphs that will help check for non-normality in the middle range of data and near the tails range of data. With this we will see whether, the residuals have normal distribution or not, check for Table 4 in the Appendix. 17
18 To further test for normality, Shapiro-Wilk W-test is performed in order to test the null hypothesis that sample came from a normally distributed population. If the p-value is less than the alpha level of 0.05, then data is not from a normally distributed population and the other way around in case it is greater than five percent. Results for the second test: With the results of the VIF test we can see a clear multicollinearity problem, for the patents applied under Patent Cooperation Treaty on the country level, VIF of and R- squared of It is clear that the results for the regressions with this combination of variables will have problems. The other VIF test for patents applied under European Patent Office individual countries is borderline clear. VIF of 7.82 and R-squared of , are not good results, however still acceptable, which means this combination of variables should be used with care. The problems arising in these two tests stem from the high correlation between GDP and Patents applied in the individual countries, nothing can be done about that, this can be observed in Table 2. On the other hand since GDP has less of a correlation on the world level it means that VIF and R-squared are rather low, hinting at little possibility of multicollinearity problems. This low effect of GDP on the world level is due to GDP referring to each individual country for specific years, not GDP around the world; as such the good results are not anything unexpected. From Table 4 we can see that the residuals have small deviation from normal distribution, which indicates that non-normal distribution is possible both in the middle and near the tail end of the data. In addition the p-value of Shapiro-Wilk W test is 0.039, which tells us to reject the null hypothesis, meaning that the used data is not from a normally distributed population. This is rather troublesome, as this indicates that the data sample is not normally distributed, in addition to the multicollinearity problem. Over all such results tell us that hypothesis testing might have additional problems. 18
19 Third Test - FE & RE, Hausman Test In the third step, Housman specification test is being used in order to find out, if H 0 is supported or not. The test will be performed in two stages, once without any control variables and then once again with control variables: Country level - NE & PA_EPO_country NE & PA_PCT_country World level - NE & PA_EPO_world NE & PA_PCT_world From the test we observe R-Squared, Rho and Hausman values, which should tell us if the model is fully complete and determine, if there is a positive or a negative association between the dependent and independent variables. Also we perform this test to see whether fixed effect or random effect is efficient for our scenario or not. Unemployment rate is included in this mode in order to see how much of nascent entrepreneurship is being driven by unemployment. This is a significant factor as we assume that those that are forced in entrepreneurship by unemployment are not greatly affected by patents, since they are mostly not innovative. Even though it has high correlation with the independent variables, GDP is included as control variable as well. 19
20 Results for the third test: Table 5.1 FE & RE, Hausman Test regression results of nascent entrepreneurial activity across 11 countries on patents applied on a Country level dataset, Step 1: Regressions on Country level dataset (N=77) (11 countries) (with OUT control variables) Fixed effects Random effects Fixed effects Random effects PA_EPO_country.380 (.15) [.000].166 (0.04**) [.000] PA_PCT_country.155 (.28) [.000].151 (.01**) [.000] Constant 2.168( 0.01**) [.826] 2.815(.00**) [.527] (.0**) [.544] (.0**) [.486 ] Model diagnostics Hausman Test (Prob> Chi2) R Rho Step 2: Regressions on Country level dataset (N=77) (11 countries) (WITH control variables) PA_EPO_country.165 (0.6) [.000] (.68) [.000] PA_PCT_country.289 (.08*) [.000].075 (.60) [.000] GDP ( 0.37)[.000].181 (.05*)[.000] (.03) [.000].070 (.62)[.000] Unemploymentrate (.13) [.145] (0.16) [.097] (.23) [.143] (.24 ) [.106] Constant (.01**) [1.845] (.0**) [.702] (.0**) [ 1.105] (.0**) [.746 ] Model diagnostics Hausman Test (Prob> Chi2) R Rho Explanatory notes: Instead of beta's, elasticity is displayed - d(lny)/d(lnx) Significance level in first parentheses. = () Standard errors in second parentheses. = [] All models include time dummies. ** significant at > 95% confidence * significant at > 90% confidence The R 2 of the random effects model is the overall R 2 and the R 2 of the fixed effects models is the within R 2 The first stage of this test demonstrates the relationship between the number of patents applied under the two patent options (EPO and PCT) on country level against nascent entrepreneurship, with and without control variables (Table 5.1). From the results of Hausman test we can see that for the models without control variables Random effects specification fits better. The Hausman test value fluctuates slightly, but basically stays at approximately value "1.0" in all three steps. Value of 1.0 is obviously greater then 0.05, which is an insignificant result for the Hausman test, meaning that H 0 is supported and random effect model is safe to be used, since it is more efficient one out of the two. This means that Hausman test high value indicates that the unobserved heterogeneity is highly 20
21 significant, thus supporting random effects specification. On the other hand, the results of Hausman test for the model with control variables has fluctuates around "0", making the fixed effects specification test more appropriate. As such analysis will be done based on Random effects for the model without control variables (step 1) and fixed effects for the model with control variables (step 2). For the model without control variables (step 1, table 5.1), R-squared in the regressions varies from to , which is not all that high. Meaning that our model does not predict the future outcomes too well and is not complete in terms of explaining the relationship between the variables, however R-squared is at best a descriptive measure and should not impact the interpretation of results too much. It should be noted that the greater values of to , are present for the random effects model. This goes in support of results of the Hausman test. As already mentioned the Rho value, reflects the positive or negative association between the dependent and independent variables. The regression results show Rho fluctuation between 0.69 and 0.725, which suggests a strong positive association, meaning that nascent entrepreneurial activity tends to increase when independent variables increase, our Rho shows a positive coefficient. The elasticity's show positive rations for dependent and independent variables and for both patents under EPO, and PCT policies are statistically significant on 95% confidence interval, the same relationship can be observed for the constants. This is the first indication to a clear relationship between nascent entrepreneurial activity and patents applied, which supports the main hypothesis. For the model with control variables (step 2, table 5.1), R-squared in the regressions varies from to 0.14, which is too low. Meaning that our model does not predict the future outcomes well and is not complete in terms of explaining the relationship between the variables, however same as before R-squared is at best a descriptive measure and should not impact the interpretation of results too much. The regression results show Rho be around.832 and 0.88, which suggests a strong positive association, which means that nascent entrepreneurial activity, tend to increase when independent variables increase, this Rho shows a positive coefficient. The elasticity's for the second step for the independent variable and the constants are similar to the step one, however only the PCT variable is significant on 90% confidence interval, while EPO is not significant at all. This can be explained by the fact that control variables that are highly correlated with the independent variables cause multicollinearity issues, in addition to the already observed issues with R-squared. The 21
22 control variables seem to have a negative relationship with nascent entrepreneurship, which is counter intuitive (Acs et al 2007). It would be interesting to notice that for the random effects of step 2, the elasticity has a negative relationship; this is rather strange and hints at further problems in the model. This however could be dismissed, as the random model should not be used according to the Hausman test for that case. Table 5.2 FE & RE, Hausman Test regression results of nascent entrepreneurial activity across 11 countries on patents applied on a World level dataset, Step 1: Regressions on World level dataset (N=77) (11 countries) (with OUT control variables) Fixed effects Random effects Fixed effects Random effects PA_EPO_world.556 (.63) [.000] (.83) [.000] PA_PCT_world.019 (.83) [.000].019 (.83) [.000] Constant (.69)[3.891] (.50) [7.293] (.0**) [.277] (.0**) (.513) Model diagnostics Hausman Test (Prob> Does not fit Hausman test Chi2) R Rho Step 2: Regressions on World level dataset (N=77) (11 countries) (WITH control variables) PA_EPO_world.560 (0.6) [.000] (.72) [.000] PA_PCT_world.046 (.61) [.000].033 (.72) [.000] GDP ( 0.37)[.000].115 (.06*)[.000] (.15)[.000].115 (.06*)[.000] Unemploymentrate (.13) [.145] (0.12) [.111] (.10) [.141] (.12) [.111] Constant (.01**) [ ] (.39) [ ] (.0**) [ 1.002] (.0**) [.792] Model diagnostics Hausman Test (Prob> Chi2) R Rho Explanatory notes: Instead of beta's, elasticity is displayed - d(lny)/d(lnx) Significance level in first parentheses. = () Standard errors in second parentheses. = [] All models include time dummies. ** significant at > 95% confidence * significant at > 90% confidence The R 2 of the random effects model is the overall R 2 and the R 2 of the fixed effects models is the within R 2 The second stage of this test demonstrates the relationship between the number of patents applied under the two patent options on worldwide level against nascent entrepreneurship, with and without control variables (Table 5.2). From the results of Hausman test we can see that for the models without control variables Random effects specification fits better, however there arises a problem in model for the Patents applied 22
23 under Patent Cooperation Treaty, as the regression of Fixed and Random effects no longer fits the Hausman test, which means that independent variable have no significant effect on nascent entrepreneurship. As for EPO, Hausman test has a high value that indicates that the unobserved heterogeneity is highly significant, thus supporting random effects specification. The results of Hausman test for the model with control variables has fluctuates between and 0.525, making the it hard to choose from fixed effects and random effects specification tests, as such in this study both of them will be used in the interpretation, with emphasis on Fixed Effect. As such analysis will be done based on Random Effects for the model without control variables (step 1) and both fixed effect & random effects specification test for the model with control variables (step 2). For the model without control variables (step 1, table 5.2), R-squared in the regressions is 0.018, which is very poor, same as the results based on country level data. This meaning that this model does not predict the future outcomes well and is not complete in terms of explaining the relationship between the variables. As already mentioned the Rho value, reflects the positive or negative association between the dependent and independent variables. The regression results show Rho is 0.754, this suggests a strong positive association, which means that nascent entrepreneurial activity tend to increase when patents applied under European Patent Office for the world increases, our Rho shows a positive coefficient. The elasticity's show a negative ration for dependent and independent variables are not statistically significant. This is rather strange since these results are opposite to what is observed on the country level, which suggests presence other unobserved effects. For the model with control variables (step 2, table 5.2), as both Random and Fixed effects are analyzed here and the values can be observed from the table above, it is best to concentrate on the similarities and differences between the two. Same as in the Step 1, no results are statistically significant and R-squared are rather low, even though random effects seem to provide a little bit better results, 0339 opposed to 0.094, suggesting that Random effects specification test could provide better statistical results, however in the end they are still questionable. For all regressions the Rho shows a positive coefficient. The elasticity for the Random effect of EPO on world level seem to provide a negative relationship, same as in step 1, but different from the results under the same conditions, but on a country level. Overall no conclusions can be drawn from the results of table 5.2, except for hints of greater unobserved factors that are not being accounted for in the model. 23
24 Fourth Test - FE & RE, Hausman Test, Testing for non-linear relationship In the fourth step, the possible non-linear relationship between nascent entrepreneurship and patents applied under two policies on a country level are being checked. The test will be performed with and without the control variables: Country level - NE & PA_EPO_country NE & PA_PCT_country Same as before, in the test we observe R-Squared, Rho and Hausman values. Unemployment and GDP will be included as the control variables, however this time the squared value of the independent variables, will also be included in order to observe the changes that occur in a non-linear relationship model in comparison to a linear relationship model that was tested in Test 3.Adding the squared value of the independent variable to the model should help ascertain, if there are hints to the relationship being non-linear. Same as in the previous test, this will be done without control variables and with control variables, however only for the individual countries. 24
25 Results for the fourth test: Table 5.3 Non-Linear(SQR of the independent variable is included in the model) FE & RE, Hausman Test regression results of nascent entrepreneurial activity across 11 countries on patents applied on a Country level dataset, Step 1: Regressions on Country level dataset (N=77) (11 countries) (with OUT control variables) Fixed effects Random effects Fixed effects Random effects PA_EPO_country (.06*) [.000] (.04**) [.179] PA_PCT_country.541(.15) [.377] (.11)[.135] SQR_independ_var.914 (.02**)[.000].489 (.0**)[.116] (.26)[.155].247 (.0**)[.088] Constant (.0**) [2.474] 3.820(.0**) [.422] 2.046(.02**) [.870] 3.277(.0**) [.392] Model diagnostics Hausman Test (Prob>.6545 Does not fit Hausman test Chi2) R Rho Step 2: Regressions on Country level dataset (N=77) (11 countries) (WITH control variables) PA_EPO_country (.05*) [ 1.146] (.0**) [.189] PA_PCT_country.388 (.29) [.373] -.270(.1) [.167] SQR_independ_var.874 (.03**)[.407].473 (.0**)[.112] (.76)[.166].221 (.01**)[.093] GDP (.46)[.192].148 (.05*)[.085] -.372(.07*) [.205].087 (.53)[.140] Unemploymentrate (.13) [.258] (.23) [.161] (.23) [.267] -.205(.24 ) [.174] Constant (.0**) [2.835] 4.315(.0**) [.648] (.0**) [1.40] 3.851(.0**) [.676] Model diagnostics Hausman Test (Prob> Chi2) R Rho Explanatory notes: Instead of beta's, elasticity is displayed - d(lny)/d(lnx) Significance level in first parentheses. = () Standard errors in second parentheses. = [] All models include time dummies. ** significant at > 95% confidence * significant at > 90% confidence The R 2 of the random effects model is the overall R 2 and the R 2 of the fixed effects models is the within R 2 In the results above table 5.3, patent applied under European Patent Office in individual countries show signs of a non-linear relationship, compared to patents applied under Patent Cooperation Treaty. This can be due to the fact that most of 11 countries selected are from Europe. The data shows statistical significance for independent variable and surprisingly the elasticity s demonstrate a negative relationship for both models with and without control variables based on EPO. In both EPO models random effects test seems to be more appropriate in accordance with Hausman test, compared to fixed effects results R- 25
26 squared indicates that as well. This however is not observed for the PCT model, according to Hausman fixed effects is better suited for the PCT model with control variables and without control variables Hausman cannot be performed. Over all there are strong indications of a non-linear relationship between nascent entrepreneurship and patent applications. Fifth Test - FE & RE, Hausman Test; Robustness check; Testing with one year lags. In the fifth step, test is perform to check for robustness and it is done through the inclusion of one year lags in the models for both country and world level, with and without control variables. This test is performed in order to check how the core regression coefficient estimates behave when the regression specification is modified by adding one year lag regressor. In case of coefficients being plausible and robust, it is permutable to take that as evidence of structural validity. The results can be found in Tables 6.1 and 6.2 in the Appendix. From these tables it is hard to ascertain with certainty that the regressions are robust, due to slight difference when compared to the main regressions in Tables 5.1 and 5.2. According to Halbert White and Xun Lu (2010), robustness checks can give neither necessary nor sufficient evidence for structural validity in case of bad use of additional regressor, as such the results should be handled with care. 26
27 Discussion and Conclusion At the start let us begin with the observed issues to this paper: there are several problems with the data used, starting with dataset being limited to only eleven OECD countries with time period of seven years, which makes it a total of 77 observation for the dataset. This is a rather small sample size to be performing fixed and random effects specification tests on. Other problems appear due to the strong Multicollinearity issues, caused by the strong correlation between main control variables and the independent variables, which cannot be avoided. Continuing with the number of patents applied not being able to represent the patents that got commercialized very well (patents turned in to economically relevant knowledge). This is a rather significant issue, as it causes problems for significance of regressions, decreasing the ability to detect a relationship between patents and nascent entrepreneurship which we assume to exist based on Acs et al (2012). A careful examination of found results provides a blurry picture as to what kind of relationship exists between the nascent entrepreneurial activity and patent applications. However, even if a clear relationship was not confirmed there are indications that the relationship does exist and that the main hypothesis should not be rejected. That evidence can be observed in the regressions without the control variables for the country level under the both patent application policies and for regressions with control variables under the PCT. The relationship seems to indicate a positive relationship between the dependent and independent variables, supporting the main hypothesis. Regressions on the world level where performed only as reference for the country level and by comparing the two some similarities in elasticity s and signs do arise, however as initially expected the world level tests do not provide any significant results, as such no conclusions can be drawn. Thanks to the fourth test, signs of a non-linear relationship between applied patents and nascent entrepreneurial activity can be seen, however the sign of elasticity s and significances cause some doubt to be cast on the results. The one year lag test that was performed as robustness check, further confirms the uncertainty of the obtained results. There are some deviations from the main regressions in both coefficients and I magnitudes, indicating that the found coefficients may not be true casual effects. As was already mentioned, there are several problems observed in the course of the thesis, but some payoff can be drawn. 27
28 To put in a nutshell, there are indication that there is a relationship between nascent entrepreneurial activity and patents applied (under both European Patent Office and Patent Cooperation Treaty in individual countries), however they are not strong enough to draw a clear conclusion, be that to confirm or reject the main hypothesis. What can be said is that there is a positive correlation between the two, yet no causation can be drawn from it. 28
29 Used literature Arrow, K., 1962, The Economic Implication of Learning by Doing, Review of Economics and Statistics, 80, Acs, Z. J. & Szerb, L. (2008). A complex global entrepreneurship context index (CEC). University of Pecs, Faculty of Business and Economics Acs, Z. J. (2007), How is Entrepreneurship Good for Economic Growth? George Mason University, Max-Planck-Institute of Economics, Kauffman Foundation, Progress Foundation The Beauty of Entrepreneurship, Zurich, Switzerland, October Acs, Z. J. & Catherine Armington & Ting Zhang, (2006) "The Determinants of Newfirm Survival across Regional Economies," Papers on Entrepreneurship, Growth and Public Policy , Max Planck Institute of Economics, Entrepreneurship, Growth and Public Policy Group. Acs, Zoltan J., Audretsch, David B., Braunerhjelm, Pontus and Carlsson, Bo, (December 2004). The Missing Link: The Knowledge Filter and Entrepreneurship in Endogenous Growth,CEPR Discussion Paper No Acs, Z. J., David B. Audretsch, Pontus Braunerhjelm and Bo Carlsson, (2012), Growth and entrepreneurship, Small Business Economics, Volume 39, p Aghion, P., and Howitt, P., 1992, A Model of Growth Through Creative Destruction, Econometrica, v60, Baltagi, B. H., & Y.-J. Chang. (1994). Incomplete panels: A comparative study of alternative estimators for the unbalanced one-way error component regression model, Journal of Econometrics, 62 (2), Carlsson, B. and Fridh, A.-C., 2002, Technology Transfer in United States Universities: A Survey and Statistical Analysis, Journal of Evolutionary Economics, 12(1-2), Cohen, J. (1988), Statistical power analysis for the behavioral sciences (2nd ed.) Christensen, R. (2002). Plane Answers to Complex Questions: The Theory of Linear Models. New York: Springer. Cheng, L. and Dinopoulos, E., 1992, Schumpeterian Growth and International Business Cycles, American Economic Review, 82,
30 D. B. Audretsch & Max Keilbach, "Entrepreneurship, Growth and Restructuring," Max Planck Institute of Economics, Entrepreneurship, Growth and Public Policy Group, Growth and Public Policy D.C. Mowery and S. Shane (2002), Special Issue on University Entrepreneurship and Technology Transfer: Introduction to the Special Issue on University Entrepreneurship and Technology Transfer, Management Science, 48:v-9 Halbert White and Xun Lu (June 18, 2010), Robustness Checks and Robustness Tests in Applied Economics, Department of Economics University of California, San Diego Lucas, R., 1988, On the Mechanics of Economic Development, Journal of Monetary Economics, 22, M.A. Lemley, D Lichtman, ( Rethinking Patent Law's Presumption of Validity, ) Mark A.60 Stan. L. Rev. 45 Nickell, S. J., (1981). 'Economic policy and private investment since the oil crisis' by Artus et al, European Economic Review, Elsevier, vol. 16(1), pages Oscar Torres-Reyna (2011), Panel Data Analysis, Fixed & Random Effects (using Stata 10.x) (ver. 4.1) P. J. Diggle, J. A. Tawn, R. A. Moyeed (2002), Model-based geostatistics, Journal of the Royal Statistical Society: Series C (Applied Statistics), Volume 47, Issue 3, pages , 1998 Romer, P., 1986, Increasing Returns and Economic Growth, American Economic Review, 94, Rebelo, S., 1991, Long-Run Policy Analysis and Long-Run Growth, Journal of Political Economy, 99, Schramm, C. J. (2006). The entrepreneurial imperative. (New York: Collins) Schmitz, J., 1989, Imitation, Entrepreneurship, and Long-Run Growth, Journal of Political Economy, 97, Solow, R. (1956). A contribution to theory of economic growth, Quarterly Journal of Economics, 70, Segerstrom, P., 1995, A Quality Ladders Growth Model With Decreasing Returns to R&D, mimeo, Michigan State University. 30
31 Appendix Table 1.1 Description of all variables Dependent variables, GEM Variable notation Nascent entrepreneurship Entrep (suboanw) Independent variables, OECD data European Patent Office PA_EPO_world (PA_EPO) Patent Cooperation Treaty PA_ PCT_world (PA_PCT) European Patent Office in individual country PA_EPO_country (PA_EPO_ind) Patent Cooperation Treaty in individual country PA_PCT_country (PA_PCT_ind) PA_EPO1 PA_PCT1 PA_EPO_country1 (PA_EPO_ind1) PA_PCT_country1 (PA_PCT_ind1) PA_EPO_world2 (PA_EPO2) PA_PCT_world2 (PA_PCT2) PA_EPO_country2 (PA_EPO_ind2) PA_ PCT_country2 (PA_ PCT_ind2) Other variables, GEM, OECD TEA GDP Harmonized unemployment rate (unempl) Unempl1-Unempl6 Notes: Definition = the rate of individuals who claim to be engaged in starting a business they will at least partially own and that has paid wages or profits for no more than 6 months. Patents applied under European Patent Office worldwide Patents applied under Patent Cooperation Treaty worldwide Patents applied under European Patent Office in individual country Patents applied under Patent Cooperation Treaty in individual country Time lag of Patents applied under European Patent Office worldwide Time lag of Patents applied under Patent Cooperation Treaty worldwide Time lag of Patents applied under European Patent Office in individual country Time lag of Patents applied under Patent Cooperation Treaty in individual country Patents applied under European Patent Office SQR Patents applied under Patent Cooperation Treaty SQR Patents applied under European Patent Office on Country level SQR Patents applied under Patent Cooperation Treaty on Country level SQR = Total early-stage entrepreneurial activity = Billion US dollars, current prices and PPPs, real GDP = comparable unemployment rates = time lags of unemployment rate For the better understanding of the reader, variables mentioned in the paper are called differently from what they are called in the dataset. Names in the brackets is how variables are named in the dataset- ( ) 31
32 32
THE FACTORS DETERMINING THE QUANTITY OF TAXIES - AN EMPIRICAL ANALYSIS OF CITIES IN CHINA
 Clemson University TigerPrints All Theses Theses 12-2015 THE FACTORS DETERMINING THE QUANTITY OF TAXIES - AN EMPIRICAL ANALYSIS OF CITIES IN CHINA Yunzi Zhu Clemson University, yunziz@g.clemson.edu Follow
Effects of Human Capital and Openness on Economic Growth of Developed and Developing Countries: A Panel Data Analysis
 Effects of Human Capital and Openness on Economic Growth of Developed and Developing Countries: A Panel Data Analysis Fatma Didin Sonmez, Pinar Sener Abstract Technology transfer by international trade
Chapter 3. Database and Research Methodology
 Chapter 3 Database and Research Methodology In research, the research plan needs to be cautiously designed to yield results that are as objective as realistic. It is the main part of a grant application
Correlation and Simple. Linear Regression. Scenario. Defining Correlation
 Linear Regression Scenario Let s imagine that we work in a real estate business and we re attempting to understand whether there s any association between the square footage of a house and it s final selling
Chapter Six- Selecting the Best Innovation Model by Using Multiple Regression
 Chapter Six- Selecting the Best Innovation Model by Using Multiple Regression 6.1 Introduction In the previous chapter, the detailed results of FA were presented and discussed. As a result, fourteen factors
Digitalization, Skilled labor and the Productivity of Firms 1
 Digitalization, Skilled labor and the Productivity of Firms 1 Jóannes Jacobsen, Jan Rose Skaksen and Anders Sørensen, CEBR, Copenhagen Business School 1. Introduction In the literature on information technology
EFFICACY OF ROBUST REGRESSION APPLIED TO FRACTIONAL FACTORIAL TREATMENT STRUCTURES MICHAEL MCCANTS
 EFFICACY OF ROBUST REGRESSION APPLIED TO FRACTIONAL FACTORIAL TREATMENT STRUCTURES by MICHAEL MCCANTS B.A., WINONA STATE UNIVERSITY, 2007 B.S., WINONA STATE UNIVERSITY, 2008 A THESIS submitted in partial
Assessing the Macroeconomic Effects of Competition Policy - the Impact on Economic Growth
 Economic Insights Trends and Challenges Vol.IV(LXVII) No. 3/2015 81-88 Assessing the Macroeconomic Effects of Competition Policy - the Impact on Economic Growth Oana Romano The Bucharest University of
Empirical Exercise Handout
 Empirical Exercise Handout Ec-970 International Corporate Governance Harvard University March 2, 2004 Due Date The new due date for empirical paper is Wednesday, March 24 at the beginning of class. Description
Mergers and Sequential Innovation: Evidence from Patent Citations
 Mergers and Sequential Innovation: Evidence from Patent Citations Jessica Calfee Stahl Board of Governors of the Federal Reserve System January 2010 Abstract An extensive literature has investigated the
CHAPTER 5 RESULTS AND ANALYSIS
 CHAPTER 5 RESULTS AND ANALYSIS This chapter exhibits an extensive data analysis and the results of the statistical testing. Data analysis is done using factor analysis, regression analysis, reliability
Entrepreneurial Social Capital and Economic growth. An analysis of local entrepreneurial social capital and job creation in Sweden
 Entrepreneurial Social Capital and Economic growth. An analysis of local entrepreneurial social capital and job creation in Sweden BACHELOR Thesis THESIS WITHIN: Economics NUMBER OF CREDITS: 15 PROGRAMME
A rm s-length transfer prices for the remuneration of
 1164 (Vol. 25, No. 20) BNA INSIGHTS Cost Plus Markups for Manufacturing Entities: The Effect of Size on Fully Loaded Versus Variable Costs The authors analyze the statistical and economic significance
MRW model of growth: foundation, developments, and empirical evidence
 MRW model of growth: foundation, developments, and empirical evidence Mariya Neycheva * 1. Introduction The economics of growth is one of the most popular fields of study in both theoretical and empirical
Problem Points Score USE YOUR TIME WISELY SHOW YOUR WORK TO RECEIVE PARTIAL CREDIT
 STAT 512 EXAM I STAT 512 Name (7 pts) Problem Points Score 1 40 2 25 3 28 USE YOUR TIME WISELY SHOW YOUR WORK TO RECEIVE PARTIAL CREDIT WRITE LEGIBLY. ANYTHING UNREADABLE WILL NOT BE GRADED GOOD LUCK!!!!
University of Pretoria Department of Economics Working Paper Series
 University of Pretoria Department of Economics Working Paper Series Social Rate of Return to R&D on Various Energy Technologies: Where Should We Invest More? A Study of G7 Countries Roula Inglesi-Lotz
Commentary: Causes of Changing Earnings Inequality
 Commentary: Causes of Changing Earnings Inequality Robert Z. Lawrence In the first half of this stimulating paper, Dennis Snower gives us a review of the existing academic literature on inequality. His
MONTHLY REVIEW OF ACADEMIC LITERATURE ON RESEARCH AND INNOVATION AS SOURCES OF GROWTH
 Issue 17 /February 2017 MONTHLY REVIEW OF ACADEMIC LITERATURE ON RESEARCH AND INNOVATION AS SOURCES OF GROWTH Contact: DG RTD, Directorate A, A4, Olga Semenova (Blue Book Trainee), olga.semenova@coleurope.be
EVALUATION OF ECONOMIC CONVERGENCE IN ROMANIA. Ec. CUCO PAULA ROXANA,
 EVALUATION OF ECONOMIC CONVERGENCE IN ROMANIA Ec. CUCO PAULA ROXANA, e-mail: paularoxana.cucos@yahoo.com Abstract: This article aims to highlight the process of regional convergence (regarding income wage
APPENDIX I. Data Appendix. B. US Patent Awards Data.
 APPENDIX I. Data Appendix B. US Patent Awards Data. a. Choice of US patent awards as outcome variable over the WIPO patent counts. There are two main patent measures available in the data I gathered. One
Distinguish between different types of numerical data and different data collection processes.
 Level: Diploma in Business Learning Outcomes 1.1 1.3 Distinguish between different types of numerical data and different data collection processes. Introduce the course by defining statistics and explaining
OBSTACLES TO ENTREPRENEURSHIP CAUSE UNEMPLOYMENT. A PANEL DATA ANALYSIS FOR WESTERN EUROPE, JAPAN AND THE UNITED STATES ( ).
.") OBSTACLES TO ENTREPRENEURSHIP CAUSE UNEMPLOYMENT. A PANEL DATA ANALYSIS FOR WESTERN EUROPE, JAPAN AND THE UNITED STATES (1998 003). Miltiades N. Georgiou Ph.D. ABSTRACT In this paper it is shown that barriers
OBSTACLES TO ENTREPRENEURSHIP CAUSE UNEMPLOYMENT. A PANEL DATA ANALYSIS FOR WESTERN EUROPE, JAPAN AND THE UNITED STATES (1998 003). Miltiades N. Georgiou Ph.D. ABSTRACT In this paper it is shown that barriers
COSTEFFECTIVENESS: THE FORGOTTEN DIMENSION OF PUBLIC SECTOR PERFORMANCE. Hans de Groot (Innovation and Governance Studies, University of Twente)
") COSTEFFECTIVENESS: THE FORGOTTEN DIMENSION OF PUBLIC SECTOR PERFORMANCE Hans de Groot (Innovation and Governance Studies, University of Twente) Bart L. van Hulst (Innovation and Public Sector Efficiency
COSTEFFECTIVENESS: THE FORGOTTEN DIMENSION OF PUBLIC SECTOR PERFORMANCE Hans de Groot (Innovation and Governance Studies, University of Twente) Bart L. van Hulst (Innovation and Public Sector Efficiency
Chapter 2--Observing and Explaining the Economy
 Chapter 2--Observing and Explaining the Economy Student: 1. All of the following are what economists commonly do except A. describing economic events. B. explaining why economic events occur. C. making
THE PERMANENT INCOME HYPOthesis: REGARDING THE HOUSING BOOM
 Clemson University TigerPrints All Theses Theses 8-2013 THE PERMANENT INCOME HYPOthesis: REGARDING THE HOUSING BOOM Nick Havers Clemson University, nhavers@g.clemson.edu Follow this and additional works
Do Tobacco Bans Harm the Advertising Industry?
 ` DISCUSSION PAPER SERIES Do Tobacco Bans Harm the Advertising Industry? Tom Coupe (Kyiv School of Economics and Kyiv Economics Institute) Olena Gnezdilova (Kyiv Economics Institute) DP# 4 January 2008
The Impact of Building Energy Codes on the Energy Efficiency of Residential Space Heating in European countries A Stochastic Frontier Approach
 The Impact of Building Energy Codes on the Energy Efficiency of Residential Space Heating in European countries A Stochastic Frontier Approach Aurélien Saussay, International Energy Agency, Paris, France
CHAPTER 4, SECTION 1
 DAILY LECTURE CHAPTER 4, SECTION 1 Understanding Demand What Is Demand? Demand is the willingness and ability of buyers to purchase different quantities of a good, at different prices, during a specific
Business Quantitative Analysis [QU1] Examination Blueprint
![Business Quantitative Analysis [QU1] Examination Blueprint](/thumbs/94/121308410.jpg "Business Quantitative Analysis [QU1] Examination Blueprint") Business Quantitative Analysis [QU1] Examination Blueprint 2014-2015 Purpose The Business Quantitative Analysis [QU1] examination has been constructed using an examination blueprint. The blueprint, also
Business Quantitative Analysis [QU1] Examination Blueprint 2014-2015 Purpose The Business Quantitative Analysis [QU1] examination has been constructed using an examination blueprint. The blueprint, also
EURASIAN JOURNAL OF BUSINESS AND MANAGEMENT
 Eurasian Journal of Business and Management, 5(2), 2017, 11-20 DOI: 10.15604/ejbm.2017.05.02.002 EURASIAN JOURNAL OF BUSINESS AND MANAGEMENT www.eurasianpublications.com THE EFFECTS OF ENTREPRENEURIAL
Multiple Regression. Dr. Tom Pierce Department of Psychology Radford University
 Multiple Regression Dr. Tom Pierce Department of Psychology Radford University In the previous chapter we talked about regression as a technique for using a person s score on one variable to make a best
The US dollar exchange rate and the demand for oil
 The US dollar exchange rate and the demand for oil Selien De Schryder Ghent University Gert Peersman Ghent University BoE, CAMA and MMF Workshop on Understanding Oil and Commodity Prices" 25 May 2012 Motivation
ENDOGENOUS REGIONAL DEVELOPMENT IN ROMANIA. A KNOWLEDGE PRODUCTION FUNCTION MODEL
 ENDOGENOUS REGIONAL DEVELOPMENT IN ROMANIA. A KNOWLEDGE PRODUCTION FUNCTION MODEL Zizi GOSCHIN Professor, Department of Statistics and Econometrics, Bucharest University of Economic Studies, Romania Senior
Daily Optimization Project
 Daily Optimization Project Personalized Facebook Analysis 10/29/15 By Kevin DeLuca ThoughtBurner Kevin DeLuca and ThoughtBurner, 2015. Unauthorized use and/or duplication of this material without express
The Effect of Information and Communication Technology on Energy Consumption in the European Union Countries
 The Effect of Information and Communication Technology on Energy Consumption in the European Union Countries Çiğdem Börke TUNALI Department of Economics, Faculty of Economics, Istanbul University, Merkez
The relationship between innovation and economic growth in emerging economies
 Mladen Vuckovic The relationship between innovation and economic growth in emerging economies 130 - Organizational Response To Globally Driven Institutional Changes Abstract This paper will investigate
Examining a new packing method in order to solve inefficiency in the production process:
 Bachelor Thesis Examining a new packing method in order to solve inefficiency in the production process: The effects and opinions analysed for franchise organisation Tulpen.nl. ERASMUS UNIVERSITY ROTTERDAM
Chapter 3: The Relationship between Economic Freedom and Economic Well-Being
 20 Economic Freedom of North America Chapter 3: The Relationship between Economic Freedom and Economic Well-Being A number of studies have linked levels of economic freedom with higher levels of economic
The Role of Education for the Economic Growth of Bulgaria
 MPRA Munich Personal RePEc Archive The Role of Education for the Economic Growth of Bulgaria Mariya Neycheva Burgas Free University April 2014 Online at http://mpra.ub.uni-muenchen.de/55633/ MPRA Paper
China s Changing Economic Growth Modes in Historical Perspective
 Chapter 1 China s Changing Economic Growth Modes in Historical Perspective Liu Wei and Cai Zhizhou School of Economics, Peking University, Beijing, PRC China has kept a long-term rapid economic growth
FORECASTING LABOUR PRODUCTIVITY IN THE EUROPEAN UNION MEMBER STATES: IS LABOUR PRODUCTIVITY CHANGING AS EXPECTED?
 Interdisciplinary Description of Complex Systems 16(3-B), 504-523, 2018 FORECASTING LABOUR PRODUCTIVITY IN THE EUROPEAN UNION MEMBER STATES: IS LABOUR PRODUCTIVITY CHANGING AS EXPECTED? Berislav Žmuk*,
The Dummy s Guide to Data Analysis Using SPSS
 The Dummy s Guide to Data Analysis Using SPSS Univariate Statistics Scripps College Amy Gamble April, 2001 Amy Gamble 4/30/01 All Rights Rerserved Table of Contents PAGE Creating a Data File...3 1. Creating
Revisiting Energy Consumption and GDP: Evidence from Dynamic Panel Data Analysis
 MPRA Munich Personal RePEc Archive Revisiting Energy Consumption and GDP: Evidence from Dynamic Panel Data Analysis Sabri Nayan and Norsiah Kadir and Mahyudin Ahmad and Mat Saad Abdullah Universiti Teknologi
Lecture 12. The paper by Ward, Greenhill and Bakke (WGB) is one of my favourite papers in the course. It is very readable and useful for you.
 is one of my favourite papers in the course. It is very readable and useful for you.") EC3320 2016-2017 Michael Spagat Lecture 12 The paper by Ward, Greenhill and Bakke (WGB) is one of my favourite papers in the course. It is very readable and useful for you. So far we have focused on statistical
EC3320 2016-2017 Michael Spagat Lecture 12 The paper by Ward, Greenhill and Bakke (WGB) is one of my favourite papers in the course. It is very readable and useful for you. So far we have focused on statistical
Economics 314 Spring 2006 Final Exam May 10, 2006
 Economics 314 Spring 2006 Final Exam May 10, 2006 Instructions This exam is closed-book; no outside materials may be consulted. You may write your answers wherever you wish, but if any errors or ambiguities
Appendix to Gerlagh, Mathys and Michielsen, Energy Abundance, Trade and Specialization (ej371_02)
") Appendix to Gerlagh, Mathys and Michielsen, Energy Abundance, Trade and Specialization (ej371_02) Appendix 1. Data Description Table A. Countries in the sample. Abbreviation Country AUS* Australia BEL
Appendix to Gerlagh, Mathys and Michielsen, Energy Abundance, Trade and Specialization (ej371_02) Appendix 1. Data Description Table A. Countries in the sample. Abbreviation Country AUS* Australia BEL
Technical Appendix. Resolution of the canonical RBC Model. Master EPP, 2010
 Technical Appendix Resolution of the canonical RBC Model Master EPP, 2010 Questions What are the causes of macroeconomic fluctuations? To what extent optimal intertemporal behavior of households in a walrasssian
Temperature impacts on economic growth warrant stringent mitigation policy
 Temperature impacts on economic growth warrant stringent mitigation policy Figure SI.1: Diagrammatic illustration of different long-term effects of a one-period temperature shock depending on whether climate
The Effects of Land Conservation on Productivity
 Journal of Environmental and Resource Economics at Colby Volume 2 Issue 1 Spring 2015 Article 5 2015 The Effects of Land Conservation on Productivity Robert McCormick rmccormi@colby.edu Carolyn Fuwa Colby
A note on power comparison of panel tests of cointegration An application on. health expenditure and GDP
 A note on power comparison of panel tests of cointegration An application on health expenditure and GDP Giorgia Marini * This version, 2007 July * Centre for Health Economics, University of York, YORK,
Path Dependence in Clean Versus Dirty Innovation. College de France 29 October 2015
 Path Dependence in Clean Versus Dirty Innovation College de France 29 October 2015 MOTIVATION Climate change Policies Main climate change models (e.g. Nordhaus, Stern) assume exogenous technology Then
The Great Synchronisation: what do high-frequency statistics tell us about the trade collapse?
 The Great Synchronisation: what do high-frequency statistics tell us about the trade collapse? WPTGS, 16-18 November 2009 Sónia Araújo and Eric Gonnard OECD Statistics Directorate Objectives: Analysis
This is an important debate
 1 of 5 8/3/2009 2:46 PM Create account Login Research-based policy analysis and commentary from leading economists Andrew K. Rose 1 August 2009 Less synchronised business cycles would be good news for
What is Economics? / Define Economics / Introduction to Economics
 What is Economics? / Define Economics / Introduction to Economics Economics is a social science that studies how individuals, governments, firms, and nations make choices on allocating limited resources
BUS105 Statistics. Tutor Marked Assignment. Total Marks: 45; Weightage: 15%
 BUS105 Statistics Tutor Marked Assignment Total Marks: 45; Weightage: 15% Objectives a) Reinforcing your learning, at home and in class b) Identifying the topics that you have problems with so that your
Research Article. Competitiveness of national pharmaceutical industry: The Russian case
 Available online www.jocpr.com Journal of Chemical and Pharmaceutical Research, 2015, 7(5):710-715 Research Article ISSN : 0975-7384 CODEN(USA) : JCPRC5 Competitiveness of national pharmaceutical industry:
Experimental economics
 Workshop II: Economic Methods Experimental economics Building Competence. Crossing Borders. Dr. Regina Betz, Dr Jenny Riesz, Peiyao Shen betz@zhaw.ch, j.riesz@unsw.edu.au, pei.y.shen@unsw.edu.au Experimental
Effects of Openness and Trade in Pollutive Industries on Stringency of Environmental Regulation
 Effects of Openness and Trade in Pollutive Industries on Stringency of Environmental Regulation Matthias Busse and Magdalene Silberberger* Ruhr-University of Bochum Preliminary version Abstract This paper
Econometric Forecasting in a Lost Profits Case
 Econometric Forecasting in a Lost Profits Case I read with interest the recent article by A. Frank Adams, III, Ph.D., in the May /June 2008 issue of The Value Examiner1. I applaud Dr. Adams for his attempt
US climate change impacts from the PAGE2002 integrated assessment model used in the Stern report
 Page 1 of 54 16 November 27 US climate change impacts from the PAGE22 integrated assessment model used in the Stern report Chris Hope & Stephan Alberth Judge Business School, University of Cambridge, UK
Higher Education and Economic Development in the Balkan Countries: A Panel Data Analysis
 1 Further Education in the Balkan Countries Aristotle University of Thessaloniki Faculty of Philosophy and Education Department of Education 23-25 October 2008, Konya Turkey Higher Education and Economic
Urban Transportation Planning Prof Dr. V. Thamizh Arasan Department of Civil Engineering Indian Institute Of Technology, Madras
 Urban Transportation Planning Prof Dr. V. Thamizh Arasan Department of Civil Engineering Indian Institute Of Technology, Madras Lecture No. # 14 Modal Split Analysis Contd. This is lecture 14 on urban
ECONOMIC GROWTH AT REGIONAL LEVEL AND INNOVATION: IS THERE ANY LINK?
 Annals of the University of Petroşani, Economics, 13(1), 2013, 149-156 149 ECONOMIC GROWTH AT REGIONAL LEVEL AND INNOVATION: IS THERE ANY LINK? GEORGETA GRIGORE NAE, CRISTIANA SIMA * ABSTRACT: The role
Prof. Bryan Caplan Econ 812
 Prof. Bryan Caplan bcaplan@gmu.edu http://www.bcaplan.com Econ 812 Week 8: Symmetric Information I. Expected Utility Theory A. How do people choose between gambles? In particular, what is the relationship
Determinants of Money Demand Function in Ethiopia. Amerti Merga. Adama Science and Technology University
 Determinants of Money Demand Function in Ethiopia Amerti Merga Adama Science and Technology University Abstract In Least developed countries (LDCs) like Ethiopia, one of the major macroeconomic problems
Accounting for Innovation and Measuring Innovativeness: An Illustrative Framework and an Application
 Accounting for Innovation and Measuring Innovativeness: An Illustrative Framework and an Application By JACQUES MAIRESSE AND PIERRE MOHNEN* The purpose of this paper is to propose and illustrate an accounting
CHAPTER 4 EMPIRICAL ANALYSIS AND DISCUSSION
 79 CHAPTER 4 EMPIRICAL ANALYSIS AND DISCUSSION 4.1 SAMPLE SELECTION AND DESCRIPTIVE STATISTICS The study begins by identifying industrial sectors heavily reliant on intellectual capital. The data covers
Revision confidence limits for recent data on trend levels, trend growth rates and seasonally adjusted levels
 W O R K I N G P A P E R S A N D S T U D I E S ISSN 1725-4825 Revision confidence limits for recent data on trend levels, trend growth rates and seasonally adjusted levels Conference on seasonality, seasonal
Applied Econometrics and International Development Vol. 8-1 (2008)
") PATENTS, INNOVATIONS AND ECONOMIC GROWTH IN JAPAN AND SOUTH KOREA: EVIDENCE FROM INDIVIDUAL COUNTRY AND PANEL DATA SINHA, Dipendra * Abstract : This paper looks at the relationship between patents and
PATENTS, INNOVATIONS AND ECONOMIC GROWTH IN JAPAN AND SOUTH KOREA: EVIDENCE FROM INDIVIDUAL COUNTRY AND PANEL DATA SINHA, Dipendra * Abstract : This paper looks at the relationship between patents and
TOTAL FACTOR PRODUCTIVITY DETERMINANTS IN DEVELOPED EUROPEAN COUNTRIES
 TOTAL FACTOR PRODUCTIVITY DETERMINANTS IN DEVELOPED EUROPEAN COUNTRIES Bogdan Florin FILIP Alexandru Ioan Cuza University of Iaşi, Faculty of Economics and Business Administration Iaşi, Romania bogdan.filip@feaa.uaic.ro
ENTREPRENEURIAL NETWORK DEVELOPMENT AS A SIGN OF BUSINESS EMERGENCE
 ENTREPRENEURIAL NETWORK DEVELOPMENT AS A SIGN OF BUSINESS EMERGENCE Shim J 1 1 Australian Centre for Entrepreneurship Research Submitting Author Contact Information Jaehu Shim Australian Centre for Entrepreneurship
The Effect of Occupational Danger on Individuals Wage Rates. A fundamental problem confronting the implementation of many healthcare
 The Effect of Occupational Danger on Individuals Wage Rates Jonathan Lee Econ 170-001 Spring 2003 PID: 703969503 A fundamental problem confronting the implementation of many healthcare policies is the
5 CHAPTER: DATA COLLECTION AND ANALYSIS
 5 CHAPTER: DATA COLLECTION AND ANALYSIS 5.1 INTRODUCTION This chapter will have a discussion on the data collection for this study and detail analysis of the collected data from the sample out of target
Sociology 7704: Regression Models for Categorical Data Instructor: Natasha Sarkisian. Preliminary Data Screening
 r's age when 1st child born 2 4 6 Density.2.4.6.8 Density.5.1 Sociology 774: Regression Models for Categorical Data Instructor: Natasha Sarkisian Preliminary Data Screening A. Examining Univariate Normality
Chapter 3. Table of Contents. Introduction. Empirical Methods for Demand Analysis
 Chapter 3 Empirical Methods for Demand Analysis Table of Contents 3.1 Elasticity 3.2 Regression Analysis 3.3 Properties & Significance of Coefficients 3.4 Regression Specification 3.5 Forecasting 3-2 Introduction
EUROPEAN ECONOMY EUROPEAN COMMISSION DIRECTORATE-GENERAL FOR ECONOMIC AND FINANCIAL AFFAIRS
 EUROPEAN ECONOMY EUROPEAN COMMISSION DIRECTORATE-GENERAL FOR ECONOMIC AND FINANCIAL AFFAIRS ECONOMIC PAPERS ISSN 1725-3187 http://europa.eu.int/comm/economy_finance Number 243 February 2006 The link between
The Jack-of-All-Trades Entrepreneur: Innate Talent or Acquired Skill?
 DISCUSSION PAPER SERIES IZA DP No. 2264 The Jack-of-All-Trades Entrepreneur: Innate Talent or Acquired Skill? Olmo Silva August 2006 Forschungsinstitut zur Zukunft der Arbeit Institute for the Study of
The cyclicality of mark-ups and profit margins: some evidence for manufacturing and services
 The cyclicality of mark-ups and profit margins: some evidence for manufacturing and services By Ian Small of the Bank s Structural Economic Analysis Division. This article (1) reviews how price-cost mark-ups
Week 1 Tuesday Hr 2 (Review 1) - Samples and Populations - Descriptive and Inferential Statistics - Normal and T distributions
 - Samples and Populations - Descriptive and Inferential Statistics - Normal and T distributions") Week 1 Tuesday Hr 2 (Review 1) - Samples and Populations - Descriptive and Inferential Statistics - Normal and T distributions One of the primary goals of statistics is to make statistical inferences on
Week 1 Tuesday Hr 2 (Review 1) - Samples and Populations - Descriptive and Inferential Statistics - Normal and T distributions One of the primary goals of statistics is to make statistical inferences on
ENTREPRENEURIAL ACTIVITY IN THE CZECH REGIONS: ARE BUSINESS COMPANIES AND SELF-EMPLOYED INDIVIDUALS AFFECTED BY THE SAME FACTORS?
 ENTREPRENEURIAL ACTIVITY IN THE CZECH REGIONS: ARE BUSINESS COMPANIES AND SELF-EMPLOYED INDIVIDUALS AFFECTED BY THE SAME FACTORS? Ondřej Dvouletý Jan Mareš Abstract Previous research found a positive relationship
Rice or riots: On food production and conflict severity across India
 Supplementary material for Rice or riots: On food production and conflict severity across India Gerdis Wischnath a & Halvard Buhaug a,b* a Peace Research Institute Oslo, PRIO PO Box 9229 Grønland, 0134
Practical Regression: Fixed Effects Models
 DAVID DRANOVE 7-112-005 Practical Regression: Fixed Effects Models This is one in a series of notes entitled Practical Regression. These notes supplement the theoretical content of most statistics texts
Research, innovation and economic growth. Executive summary
 Research, innovation and economic growth Executive summary Research, innovation and economic growth: Executive summary European Commission Directorate-General for Research and Innovation Directorate A
Structural Change and Growth in India. Orcan Cortuk + Nirvikar Singh *
 Structural Change and Growth in India Orcan Cortuk + Nirvikar Singh * February 10, 2010 Abstract This paper examines the link between structural change and growth in India. It constructs indices of structural
Formation 1 / Certificate in Business and Accounting.
 Formation 1 / Certificate in Business and Accounting. Economics and Business Planning: MCQ Self - Assessment Questions 2 1. In a Command economy, consumption and investment decisions: a) Are controlled
Kristin Gustavson * and Ingrid Borren
 Gustavson and Borren BMC Medical Research Methodology 2014, 14:133 RESEARCH ARTICLE Open Access Bias in the study of prediction of change: a Monte Carlo simulation study of the effects of selective attrition
Real Business Cycle Models Chapter 10
 Real Business Cycle Models Chapter 10 1. Fundamental assumption 2. Causes of business cycles 3. Calibration and data confrontation 4. Successes of RBC models 5. Failures of RBC models 1 Fundamental assumption
Regression diagnostics
 Regression diagnostics Biometry 755 Spring 2009 Regression diagnostics p. 1/48 Introduction Every statistical method is developed based on assumptions. The validity of results derived from a given method
CHAPTER 3 RESEARCH METHODOLOGY
 CHAPTER 3 RESEARCH METHODOLOGY 3.1 MEANING OF RESEARCH Research in common parlance refers to a search for knowledge. Once can also define research as a scientific and systematic search for pertinent information
The Long-Term Effect of State Renewable Energy Incentive Programs
 Journal of Environmental and Resource Economics at Colby Volume 4 Issue 1 Article 9 2017 The Long-Term Effect of State Renewable Energy Incentive Programs Fred Bower Colby College, fmbower@colby.edu Follow
Master 2 Economic Analysis
 UFR d économie et gestion Master 2 Economic Analysis Content of courses Academic year 2019-2020 1 st term, September to December Choice and Decision Theory Microeconomic theory of individual decision making
Statistics and Business Decision Making TEKS/LINKS Student Objectives One Credit
 First Six Weeks Defining and Collecting of Data SBDM 8(A) The student will define the types of variables and the measurement scales of variables. SBDM 8(B) The student will understand the collecting of
Wages and Recruitment: Evidence from External Wage Changes
 Wages and Recruitment: Evidence from External Wage Changes Torberg Falch CESIFO WORKING PAPER NO. 4078 CATEGORY 4: LABOUR MARKETS JANUARY 2013 An electronic version of the paper may be downloaded from
Productivity and Competitiveness as determinants of Growth: Empirical Evidence from a Small Island Economy Mauritius
 Bank of Mauritius Productivity and Competitiveness as determinants of Growth: Empirical Evidence from a Small Island Economy Mauritius Dr. Ashwin Madhou Chief- Economic Analysis Division Bank of Mauritius
AP Statistics Scope & Sequence
 AP Statistics Scope & Sequence Grading Period Unit Title Learning Targets Throughout the School Year First Grading Period *Apply mathematics to problems in everyday life *Use a problem-solving model that
Unemployment and Growth Aspiratons: The Moderating Role of Education
 Unemployment and Growth Aspiratons: The Moderating Role of Education Joan-Lluís Capelleras (Universitat Autònoma de Barcelona) Ignacio Contín-Pilart (Universidad Pública de Navarra) Martin Larraza-Kintana
Rebound effects in GB road transport. Steve Sorrell and Lee Stapleton November 2015
 Rebound effects in GB road transport Steve Sorrell and Lee Stapleton November 2015 Topics Project outline Methodological challenges Estimating direct rebound effects in GB personal automotive transport
Does Local Firm Ownership Matter?
 Does Local Firm Ownership Matter? by David Fleming and Stephan J. Goetz December 3, 2010 Rural Development Paper no. 48 2010 The Northeast Regional Center for Rural Development Located at: The Pennsylvania
PricewaterhouseCoopers CEO Survey Executive Summary Introduction
 PricewaterhouseCoopers CEO Survey Executive Summary Introduction PricewaterhouseCoopers 7 th Annual Global CEO Survey, Managing Risk: An Assessment of CEO Preparedness, represents input from nearly 1,400
Stylized Facts about Growth
 Stylized Facts about Growth What is Economic Growth? Based on how we have measured GDP, GNP, and NI, we can safely say that growth is the increase in the value of final goods, and services an economy produced