Copyright 2013 Accenture All Rights Reserved. Accenture, its logo, and High Performance Delivered are trademarks of Accenture.
|
|
|
- Luke Williamson
- 6 years ago
- Views:
Transcription

1 Copyright 2013 Accenture All Rights Reserved. Accenture, its logo, and High Performance Delivered are trademarks of Accenture.
2 Objective of the Talent Demand-Supply Analysis The Talent Demand-Supply Analysis contributes to the larger vision of the National Skills Mission 2022 to make 567 million Indians employable. The Talent Demand-Supply Analysis highlights qualitative and quantitative trends and insights to bridge the talent demand-supply requirements and impact policy, operational and decision making. In this report, we analyse the trends and analyses on Supply and Demand within the IT-BPM industry. IT- BPM industry will have a downstream impact on all other sectors as it touches upon all realms in the Indian economy. Objectives of the Talent Demand-Supply Analysis Scope and analyse the demand-supply ecosystem for the IT-BPM Industry w.r.t. talent requirementspresent and future Highlight trends and analytics on the demand side w.r.t. market trends, employment growth patterns and necessary quality indicators Provide analysis of the supply side w.r.t. academic outcomes Highlight issues and recommend necessary steps to bridge the talent demand-supply situation Outcome: The Talent Demand-Supply analysis will impact policy, operational and decision making 2
3 Approach and Methodology for Data Gathering A combination of Primary and Secondary sources was used for capturing qualitative and quantitative data for the Talent Demand-Supply report. Identify the type of data required for the analysis Scan primary and secondary sources of information to gather the relevant data Triangulate data and conduct consistency checks to validate the gathered data Refresh data periodically to ensure data relevance and accuracy Primary sources On-line survey Subject Matter Experts(SME) Interviews Company websites Secondary sources Research reports from: MHRD UGC AICTE NASSCOM Research Team Governance Refresh secondary data annually / bi-annually as desired in coordination with Talent Demand and Supply side Companies should refresh OS every 2-3 years 3
 The dynamic nature of")

4 Approach and Methodology for Data Maintenance on WorkForce Market Information System (WFMIS) The dynamic nature of the IT-BPM Industry necessitates that this analysis be refreshed every year to track progress and ensure data relevance 4


 may stunt Industry growth?")


5 Structure of the Talent Demand-Supply Analysis report Snapshot of Talent Demand-Supply Analysis report What must happen to drive growth? How will it propel the Industry s growth? What are the policy changes required? Who needs to make it happen? Recommenmen dations Executive Summary IT-BPM Industry Dashboard What is the IT-BPM Industry? Where does the IT-BPM Industry currently stand? Where is it headed to? Current and future skills base What is the current Talent Demand-Supply mismatch? How many of the annual graduate supply are actually employable? How Talent Supply (or the lack of it) may stunt Industry growth? Talent Demand Supply Analysis What is the available Talent supply in the IT-BPM Industry Where is the Supply for Talent come from? What are the learning outcomes achieved by the Talent What is the talent demand in the IT-BPM Industry? Current and Projected Requirement of Talent for Industry to support revenue growth Talent Base Where is the Demand for Talent coming from? 5 supply Chain? Talent Supply Ecosystem Talent Demand Ecosystem


6 Table of Contents 1. Executive Summary 2. IT-BPM Industry Dashboard 3. Employment and Talent Demand in IT-BPM Industry 4. Talent Demand Ecosystem Objective and anticipated outcomes of the Study/Report Growth Trends for revenue, headcount and hiring Global Future Outlook Growth trends for Talent Supply Talent Demand-Supply Gap Situation Key Issues Identified Key Recommendations 6. Analysis of Supply Chain w.r.t. Academic outcomes 7.Talent Demand-Supply Analysis 8. Recommendations 9. Appendix 5. Talent Supply Ecosystem Appendix A: State Profiles Appendix B: Qualitative skill gaps by subsector Appendix C:Analysis of Talent Demand- Supply gaps by Regions Appendix D: Definitions used in the report Copyright 2013 Accenture. All rights reserved. Source: Accenture Research 6
7 Detailed Table of Contents (1/3) 1. Executive Summary- Slide 10 Growth Trends for revenue, headcount and hiring Global Future Outlook Growth trends for Talent Supply Talent Demand-Supply Gap Situation Key Issues Identified Key Recommendations 2. IT-BPM Industry Dashboard- Slide 32 World IT-BPM Spend (2012) and Share of Indian IT Industry Indian IT Industry Trends and Future Outlook Occupations in Demand Present and Future Skills in Demand Present and Future Generic Skill Gaps in IT Industry 3. Employment and Talent Demand in IT-BPM Industry- Slide 42 Growth in Revenue and Employment Forecasting For Employee Growth Growth of Direct and Indirect Employment Hiring in IT-BPM Industry Part, Present and Future Talent Demand and Preferred Courses 7
8 Detailed Table of Contents (2/3) 4. Talent Demand Ecosystem- Slide 50 NASSCOM and Non-NASSCOM members Types of companies and their contribution to revenue and people employed Distribution of Employment among Companies Employment by Customer/Market segment and Sub-sector Hiring by Sub-sector Gender Diversity Demand Ecosystem 5. Talent Supply Ecosystem- Slide 59 Where is the supply coming from Types of Institutions Enrolments at various level Growth in GER in the Past Growth in Talent Pool for the IT-BPM Industry Talent Supply Trends Levels, Streams, Gender and States 6. Analysis of Supply Chain w.r.t. Academic outcomes- Slide 84 Summary of Academic Outcomes Assessment Insights Summary of analysis of curricula Curricula Evaluation 8
9 Detailed Table of Contents (3/3) 6. Analysis of Supply Chain w.r.t. Academic outcomes(contd..) Analysis of curricula w.r.t. academic outcomes using Bloom s Taxonomy Critical competencies for the IT-BPM Industry Learning outcomes identified by NBA Detailed note on Bloom s Taxonomy of Learning Outcomes 7. Talent Demand-Supply Analysis- Slide 99 Hiring and Talent Supply in IT-BPM Industry Employable Talent Supply Talent Demand-Supply Analysis- Entry level (0-2 yrs) Talent Demand-Supply Analysis- Experienced level (>2 yrs) Talent Demand-Supply Analysis by Region and State 8. Recommendations- Slide Appendix- Slide 129 Appendix A: State Profiles Appendix B: Qualitative skill gaps by sub-sector Appendix C:Analysis of Talent Demand-Supply gaps by Regions Appendix D: Definitions used in the report 9
10 Contents Executive Summary Growth Trends for revenue, headcount and hiring Executive Summary Global Future Outlook Demand-Supply Ecosystem Average age of the IT-BPM workforce in India Analysis of Current and Future Demand and Supply of Talent Growth trends for Talent Supply Region-wise Talent Demand-Supply Gap Situation Sub-sector/Occupation wise Employability Rates Diversity Key Issues Identified Skill Gaps and Challenges Key Recommendations Recommendations 10
11 Global Future Outlook (2020) New Geographies and Verticals Core markets will continue to remain strong; New markets like BRIC will add untapped revenue sources and some markets/business will see a stagnation/decline + New Core Markets + Declining Markets - Markets Type of Companies (customer) Large Enterprises Small & Medium Enterprises (SMEs) Automation of jobs leading to job reduction(e.g. basic data entry, basic voice) Geographies America, APAC & Europe Domestic, BRICs Industry consolidation Industry Verticals Mature Verticals (BFSI, Manufacturing, Telecom) Emerging Verticals (public sector, healthcare, const. utilities) Productivity gains ; McKinsey, Gartner, IDC 11
12 Emerging Occupations and Verticals A detailed Occupational Analysis of the IT-BPM Industry shows the emergence of high-end specialised occupations and entry into newer verticals beyond BFSI and Retail (Ref: NASSCOM Occupational Analysis report) Government Healthcare Construction & Heavy Engg. Education Energy & Utilities Media Emerging Verticals Infrastructure Management Services(IMS) Data Scientist Web-services, e-commerce, e-business Knowledge Services KPO - Research, LPO, Health BPO F&A - Complex R&D Product Marketing and Packaging ITS BPM ERD and SPD Emerging Occupations/Area s of specialization 12


13 IT-BPM Industry Talent Employment Trends More and more organizations are looking to hire Non-Engineers, for technical areas like Infrastructure Services as well. A lot of this is attributed to the rising employment costs and improved process maturity Specialists for driving innovation Alternative Talent Pool Copyright 2013 Accenture. All rights reserved. Source: Accenture Research 13
14 Indian IT-BPM Industry growth and future outlook The Industry is expected to grow at 13% to reach to 225 billion USD total revenues 1 and employ 5.3 million people by 2020 creating an additional employment for 2.3 million people in the next 7 years Industry Outlook 2020 Employment (in million) Employment (million) Revenue (USD Billion) 3.0 CAGR of ~13% Revenue (USD Billion) The revenues reported are for Export + Domestic where they are defined as: Exports = IT Services + BPM + Software Products (comprising Sale of own or resale of Software products + Packaged software + Offshore Product Development) + Engineering services Domestic = IT Services + BPM + Sale of own or resale of Software products + Packaged software; Engineering Services ; NASSCOM STR ; NASSCOM Perspective
15 Average age of the Indian IT-BPM workforce There has been a gradual increase in the average workforce in the IT-BPM Industry. It still however remains one of the youngest employed workforce in the Indian economy with an estimated average age of 26.5 years. Average age of the IT-BPM workforce in India Years E 11E 12E 13E Average age-fresher hires Average age-lateral hires Average Experience of professionals Source: NASSCOM, CLSA Asia-Pacific Markets 15
16 Talent Supply to the IT-BPM Industry An estimated 0.77 millions technically qualified graduates are expected to pass-out of the formal education space in Overall, ~5 millions graduates (across all streams) are expected to pass-out in ; Educational Statistics At A Glance , MHRD 16

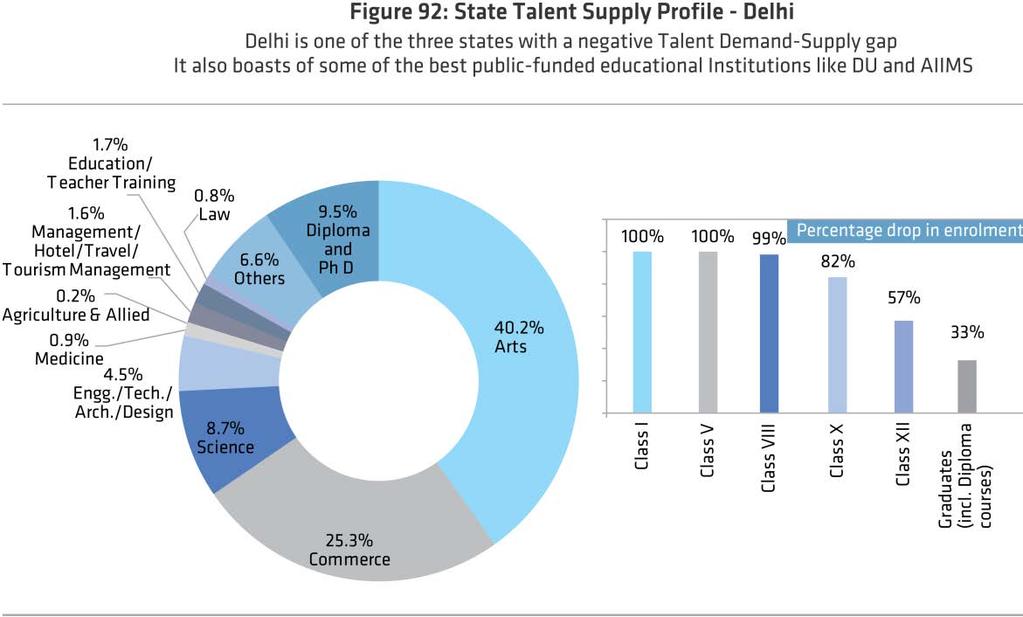
17 Talent Demand-Supply Gap 2013 and 2020* Mismatch in Demand-Supply situation in various states Karnataka, Delhi(NCR) and Tamil Nadu have a negative gap, meaning there is dearth of quality talent vis-à-vis the employment opportunities available in the state. This gap is expected to increase further by 2020 Talent Demand- Supply Gap 2013 Delhi:(15839) Haryana: Delhi:(47781) Haryana: Talent Demand- Supply Gap (6427) (46380) Total Demand:194,000 Total Employable Talent Supply:606,664 Gap: ~412, Total Demand:418,281 Total Employable Talent Supply:759,090 Gap: *Supply numbers estimated using employability numbers based on dipstick assessment
18 Talent Demand and Supply estimates 2013 Regional imbalances in Talent Demand Karnataka, TN, AP and Maharashtra contribute to ~80 percent of Talent Demand and ~50 percent of Talent Supply. This imbalance has led to increasing manpower shortages and a consequent increase in manpower costs Talent Supply Delhi(NCR): Talent Demand Total Demand:194, Total Supply:5.01 millions Total Employable Talent Supply:3.60 millions Average growth rate for Talent demand estimated to be 9 pc Avg growth rate for Talent Supply estimated to be 8.5 pc *Supply numbers estimated using employability numbers as derived using a 18
19 Talent Demand and Supply estimates Possibility of Talent shortage in quality and quantity The industry growing at 13% will put tremendous pressure on supply side as other high-growth industries (such as electronics, retails, telecom, healthcare, infrastructure) will attract and employ talent from the same supply pool Talent Supply 2020 Talent Demand Delhi:13481 Delhi: Average growth rate for Talent demand estimated to be 8.6 pc Avg growth rate for Talent Supply estimated to be 8.5 pc *Supply numbers estimated using employability numbers as quoted by Mckinsey 19
20 Employability 1 rates in the IT-BPM Industry A dipstick assessment was conducted with leading employers in the Indian IT- BPM Industry. Observed results estimate employability at 18% and 24% respectively for BPM and non-bpm sub-sectors Ratio Non BPM BPM Employability ~24% ~18% Future Employability with NOS ~56% ~33% 1. Employability: Employability is defined as the proportion of people organizations are willing to make an offer to, out of a given number of applicants who are willing to work in the IT-BPM industry. This percentage has been derived in the next slide. Boundary Conditions to the definition above: The boundary conditions that apply to this definition are: a) demand is not a constraint ( actual demand could be fluctuating ) and b) this definition holds true only in the case of export led IT-BPM industry Future Employability with NOS: NOS will lead to more trained and job-ready individuals. This will have a huge impact on improving the employability scenario of graduates in India. This ratio defines the potential employability percentage, post the implementation of NOS 20

21 Talent Supply for Non-BPM sector With the implementation of NOS, we expect an approximate increase of 250% in the number of employable candidates 21
22 Talent Supply for BPM sector (Scenario 1: Only Non Technical graduates) With the implementation of NOS, we expect an approximate increase of more than 200% in the number of employable candidates * Employability is calculated as % of talent supply available after screening for academics, general & technical aptitude and soft skills out of total supply willing to work for IT-BPM industry. 22

23 Talent Supply for BPM sector (Scenario 2: All graduates) With the implementation of NOS, we expect an approximate increase of more than 200% in the number of employable candidates * Employability is calculated as % of talent supply available after screening for academics, general & technical aptitude and soft skills out of total supply willing to work for IT-BPM industry. 23


24 Shortage of Quality Talent = Potential Areas for Skill Development Primary data collected from over 300 employers combined with an analysis of course curricula identifies Communication, Innovation, Problem Solving and Attention to Detail as some of the most needed skills from the graduates The analyzed curricula also lacked on the academic outcomes identified by NBA (National Board of Accreditation) This skill gap is one of the major reasons for the Talent Supply not being job-ready Typically organizations, spend around anywhere close to 20 weeks to impart the employable skillset to each fresh graduate 24
25 Preferred Institutes for recruitment by Employers Employers prefer to hire from Technical colleges and Universities such as INIs, State and Central Universities and Private Universities All large organisations indicated that they hire from Institutes of National Importance (INIs) including the following: IITs- IIT Kanpur, Chennai, Powai, Delhi NITs- NIT Warangal, Rourkela, Tiruchirapalli IISc IIITs- IIIT Allahbad, Hyderabad, Delhi Amongst the State and Central Universities, the following were the most preferred by the sample set of employers: Anna University Delhi University Bangalore University Mumbai University University of Pune Private Universities Vocational Training Institutes Corporate Training Institutes Institutes of National Importance Central and State Universities Schools (9th -12th) Others % % % % % % 8 6.2%
26 Preferred courses for recruitment by the Employers Engineering is clearly the course which is most preferred by the employers. One of the key reasons for the same is the enhanced focus it lays upon imparting Higher Order Thinking Skills (HOTS) BCA MCA MBA M.Tech B.Tech % % 68 54% 68 54% % Technical courses such as Engineering, Business/Management and BCA/MCA were highlighted as preferred courses for recruitment by the employers A detailed analysis of these courses w.r.t. learning outcomes indicates that these courses have a higher focus on Higher Order Thinking Skills (HOTS) It is also observed that the INIs and other premier institutes offer courses that have a higher focus on HOTS have higher placement rates, thus indicating that candidates passing out of these colleges are well equipped and more employable w.r.t. the industry needs 26

27 Increasing need for and shortage of candidates with Higher Order Thinking Skills(HOTS) While quantity of talent may be an issue in the future, quality of talent is presently posing as a key issue for the Industry. Industry needs candidates with HOTS as these have emerged to be the key for employability The Industry recommends the following interventions to ensure that the students develop HOTS (Creating, Evaluating, Analysing): Use of technology to improve educational infrastructure Increase component of practical knowledge in educational courses Increase practical exposure and experience in the form of internships and apprenticeships Increase Industry participation in course design and formal and non-formal education This would mean that the Industry spends less time to make the candidates job-ready and the will create a pipeline of ready talent 27
28 Challenges in Upper Primary & Secondary education in India (9 th -12 th grade) RTE has contributed a great deal to improve the education statistics but there is less focus on learning outcomes and quality of school education. Quality of School Education of the significant contributors to lack of HOTS in majority of Indian students Issue Focus on wrong metrics - enrolment / attendance as opposed to learning outcomes Impact Even though educational statistics are on the rise, they do not lead to an impact on skill development scenario Course design and pedagogylearning by rote, minimal focus on vocational education Students do not possess Innovation/Ideation skills, analytical thinking and practical exposure Access to schools is low Distance and infrastructure still remains a challenge to increase girl enrollments Quality of Teaching is poor and attendance of teachers is dismal Quality of students is directly proportional to quality of teachers 28


29 Key Issues Identified in the report The detailed analysis in the subsequent sections highlights some interesting trends but also raises some key issues These must be addressed to ensure that the Industry meets its growth targets and the National Skills Mission meets its employability targets 29


30 Summary of Recommendations The report makes recommendations to resolve the key issues identified. Corrective actions and data-based policy making can ensure that the Industry comes out stronger and continues on the path of growth 30
31 Contents Executive Summary Demand-Supply Ecosystem IT-BPM Industry Dashboard Analysis of Current and Future Demand and Supply of Talent World IT-BPM Spend (2012) and Share of Indian IT Industry Region-wise Indian IT Industry Trends and Future Outlook Sub-sector/Occupation wise Occupations in Demand Present and Future Diversity Skills in Demand Present and Future Skill Gaps and Challenges Generic Skill Gaps in IT Industry Recommendations 31
32 World IT-BPM Spend (2012) and Share of Indian IT Industry Across Sub-sectors: IT Services, BPM, ERD and SPD ERD and SPD sub-sector have huge potential to grow as India builds high-end capabilities World IT-BPM spend Indian IT industry Revenues (Sub-sector wise) ERD, 11.2 SPD, 6.7 Share of world 1% 2% in USD Billion ERD, 1350 SPD, 278 BPM, 164 in USD Billion BPM, 20.9 ITS, % 9% ITS, ; Forrester, Gartner, IDC; NASSCOM STR In USD Billion In USD Billion As the world focuses its spending on ERD and SPD, Indian IT industry should also look at developing more offerings and solutions to these two sub-sectors. 1
33 World IT-BPM Spend (2012) and Indian IT Industry revenues Across major verticals: BFSI, Telecom, Manufacturing, Emerging Government and Emerging Verticals such as Healthcare, Construction and Utilities will drive future growth of Indian IT industry World IT-BPM Spend - Across Verticals BFSI Manufacturing Hi-Tech/Telecom Government Emerging/Others Contribution of verticals to Indian IT industry revenues BFSI Manufacturing Hi-Tech/Telecom Retail Emerging/Others 21% 15% 33% 10% 41% 20% 18% 16% 10% 16% ; Forrester, Gartner, IDC; NASSCOM STR
34 Indian IT Industry Trends and Future Outlook Total Revenue Projection Industry to most likely grow at 13% CAGR to USD 230 Billion Domestic market will grow to USD 50 Billion Total Revenue ( ) 350 USD Million Billion CAGR 16% Optimistic NASSCOM Perspective Billion CAGR 11.5 % 0 FY2008 FY2009 FY2010 FY2011 FY2012 FY2013 FY2020 ; NASSCOM STR ; NASSCOM Perspective
35 Indian IT Industry Revenue Trends and Future Outlook Export and Domestic Markets Industry to most likely grow at 13% CAGR to USD 225 Billion Domestic market will grow to USD 50 Billion 2,50,000 Export and Domestic Revenue (USD Million) 2,00,000 Domestic, Revenue in USD Million 1,50,000 1,00,000 Exports, , NASSCOM STR ; NASSCOM Perspective
36 Indian IT Industry Trends and Future Outlook Revenue by Sub-sector SPD to grow three times present value by Revenues by Sub-sector ( ) 200 SPD ERD BPM ITS ; NASSCOM STR ; NASSCOM Perspective
37 Occupations in Demand ( ) IT Services sub-sector Application Development will continue to accounts for 1/3 rd of total revenues; SOA, Web-services, e-commerce will grow fastest Share of different occupations IT education and training Hardware deploy and support Software deploy and support Others (SOA & Web Services + E-Business/E-Commerce) IS outsourcing Application management Software Testing Network consulting and integration Custom application development Systems integration IT consulting 5% 1% 0% 0% 6% 0% 7% 7% 1% 1% 3% 3% 2% 3% 11% 15% 14% 17% 14% 20% 32% 37% New services such as SOA, Web-services & e-commerce, Software deployment and support (also known as RIM) will record fastest growth rates which will lead to spurt in demand for skilled talent ; NASSCOM STR ; NASSCOM Perspective
38 Occupations in Demand ( ) BPM sub-sector Share of CIS will decrease; High-end services such as Knowledge Services and Vertical-specific BPO services will increase Share of different occupations Vertical-specific BPO Services 16% 14% Other Horizontal Services 1% 1% Knowledge Services 18% 26% Procurement and Logistics HR Admin 1% 1% 2% 2% Finance and Accounting 23% 22% Customer Interaction Services 31% 41% ; NASSCOM STR ; NASSCOM Perspective
39 Technical Skills in Demand Today and Tomorrow More than 50% respondents say Java and Testing skills will continue to be most sought after, though Cloud Computing will replace.net in Top 3 skills in demand 70% 60% 50% 40% 30% 20% 10% 0% JAVA Testing.NET Framework ASP.Net SQL C++ DBMS Cloud Computing UNIX C# Software MS Office Others Oracle Data Architecture CCNA/CCNS SAP QMS SAS Pearl Captivate SPSS ARIBA JAVA Cloud Computing Testing.NET Framework ASP.Net SQL DBMS Software C++ C# Data Architecture Others UNIX Oracle MS Office SAP CCNA/CCNS SAS QMS Pearl SPSS ARIBA Captivate 39
40 Generic Skill Gaps in IT Industry More than 60% of organizations observe a need to improve communication and Problem solving skills of the workforce 80% 70% 60% 50% 40% 30% 20% 10% 0% Attention needs to be given to soft skills development of the workforce apart from developing technical skills 40
41 Contents Executive Summary Demand-Supply Ecosystem Employment and Talent Demand in IT-BPM Industry Analysis of Current and Future Demand and Supply of Talent Region-wise Growth in Revenue and Employment Sub-sector/Occupation Forecasting For Employee wise Growth Diversity Growth of Direct and Indirect Employment Hiring in IT-BPM Industry Part, Present and Future Skill Gaps and Challenges Talent Demand and Preferred Courses Recommendations 41
42 Growth in Revenue and Employment Automation of various job roles such as software testing and call-centre operators has adversely affected the hiring growth hence total revenue has grown at a faster rate than rise in employment. ; NASSCOM STR
43 Scenario Based Forecasting For Employee Growth If revenue per employee increases as per the past trends, direct employment would double by 2020 adding 3 million jobs over the next 7 years Direct Employment (in Million) Optimistic Most Likely Trend Optimistic Revenue USD 300 Billion CAGR 13% Most Likely - Revenue USD 232 Billion CAGR 9 % FY2008 FY2009 FY2010 FY2011 FY2012 FY2013 FY
44 Growth of Direct and Indirect Employment 75% of the total people employed in the IT-BPM industry are employed through the indirect route such as transportation services and caterers. This percentage, however, is reducing as the industry matures. 25 Direct- Indirect employment 20 Indirect Direct Employment CAGR 8.6% Ratio: Ratio: Ratio: ; NASSCOM STR ; 44
45 Hiring in IT-BPM Industry ( ) Net hiring will double by 2020 to more than 0.4 millions if the demand continues to grow at 9 per cent. ; NASSCOM STR ; 45


46 Talent Employed in IT-BPM industry Contrary to the popular belief that mostly engineers are hired in the IT-BPM industry, only 1/3 rd of people employed in the industry are Engineering graduates. Less than 50% are graduates other than engineers. NASSCOM Strategic Review 2012 Estimates 46
47 Preferred Courses for Talent Sourcing Close to 90% organizations prefer to hire from B.Tech courses. Less than 30% organizations prefer to hire from diploma and BSc courses % 90.0% 80.0% 70.0% 60.0% 50.0% 40.0% 30.0% 20.0% 10.0% 0.0% 47
48 Contents Executive Summary Talent Demand Ecosystem Demand-Supply Ecosystem NASSCOM and Non-NASSCOM members Analysis of Current and Future Demand and Supply of Talent Types of companies and their contribution to revenue and people employed Region-wise Distribution of Employment among Companies Sub-sector/Occupation wise Employment by Customer/Market segment and Sub-sector Diversity Hiring by Sub-sector Skill Gaps and Challenges Gender Diversity Recommendations Demand Ecosystem 48
49 NASSCOM and Non-NASSCOM members NASSCOM Members contribute to almost 95% of industry revenues and employment There are around 5000 companies in the IT-BPM industry; all major companies across IT Services, BPM, ER&D and SPD are members of NASSCOM Companies are heterogeneous mix of Indian Service Providers (ISPs), Multinational Companies (MNCs) and Global-in-house Companies (GICs) NASSCOM TCS, Infosys, Wipro, IBM, HCL, Cognizant, Accenture, GENPACT, Aegis, Mphasis, Dell, CSC, WNS, KPIT Cummins, Microsoft, Oracle, SAP % contribution to Indian IT-BPM industry revenue 95% companies 5% companies Non- NASSCOM INGRAM Micro Total % of companies by type 16% 14% 70% ISPs MNCs GICs 49


50 Types of companies % contribution to revenue and people employed Top 11 companies employ 1/3rd of the industry and contribute 50% of revenues 50
51 Distribution of Employment among Companies Top 4 companies contribute to more than 20% of industry headcount Top 20 companies contribute to almost half of total headcount 120% % contribution to total headcount 100% 80% 60% 40% 100% 20% 23% 39% 48% 57% 0% Top 4 Top 10 Top 20 Top 50 All 5000 Industry employment is fairly concentrated by Top 20 companies most of which employ people across all sub-sectors, therefore, more employment can be generated in companies other than the top
52 Distribution of Hiring among Top companies Top 4 companies contribute to almost half of the net hiring for entry-level Top 10 companies contribute to 2/3 rd of all net hiring 120% % contribution to net hiring 100% 80% 60% 40% 79% 92% 97% 100% 20% 48% 0% Top 4 Top 10 Top 20 Top 50 All
53 Employment by Customer/Market segment Export market generates approximately 2/3 rd of the Talent Demand Total Headcount IT Services and Software Exports (includes ER&D) BPO Exports Domestic Market Total ~5.3 mn Total ~2 mn Overall CAGR of 8.6% Total ~3 mn FY 2008 FY 2009 FY 2010 FY 2011 FY 2012 FY 2013 FY 2014 FY 2015 FY 2016 FY 2017 FY 2018 FY 2019 FY 2020 ; NASSCOM STR
54 Hiring by Customer/Market segment More than 1/3 rd of all hiring will be for domestic market by 2020 Hiring (in millions) IT Services and Software Exports (includes ER&D) BPO Exports Domestic Market FY 2009 FY 2010 FY 2011 FY 2012 FY 2013 FY 2014 FY 2015 FY 2016 FY 2017 FY 2018 FY 2019 FY 2020 ; NASSCOM STR
55 Contents Talent Supply Ecosystem Executive Summary Where is the supply coming from Demand-Supply Ecosystem Types of Institutions Analysis of Current and Future Demand and Supply of Talent Enrolments at various level Region-wise Growth in GER in the Past Sub-sector/Occupation wise Growth in Talent Pool for the IT-BPM Industry Diversity Talent Supply Trends Levels, Streams, Gender and States Skill Gaps and Challenges Recommendations 55
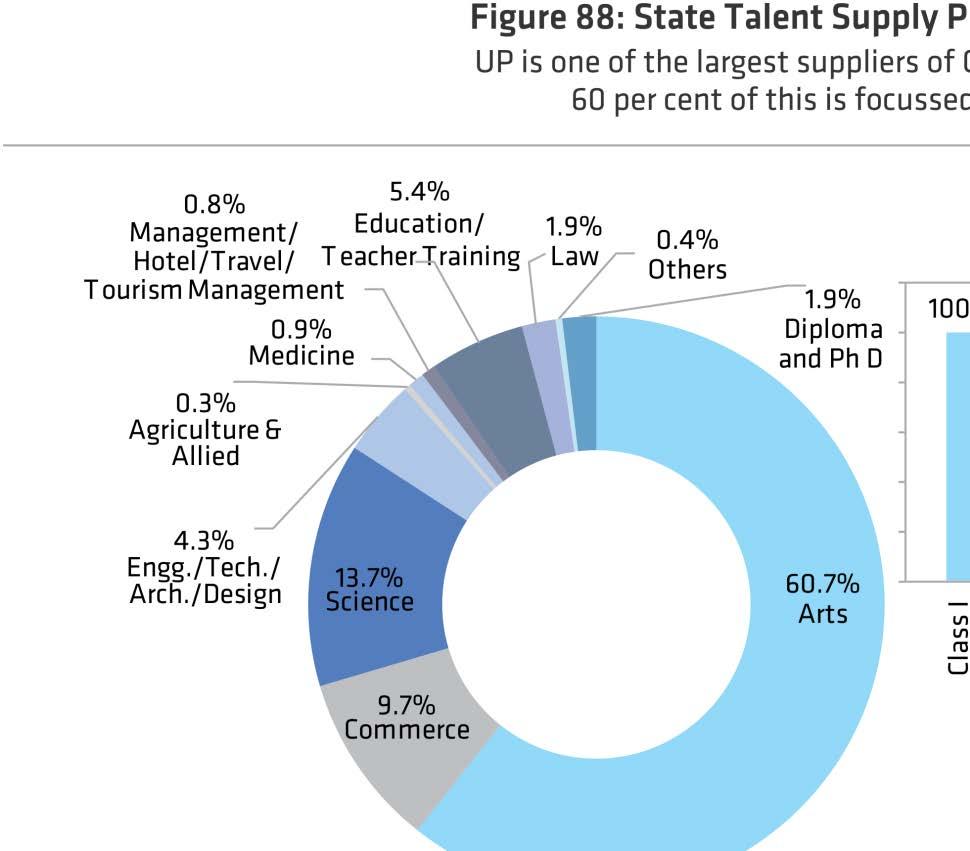
56 Where is the supply coming from? (1/2) UP and Rajasthan have the highest number of universities CU: 1 SU: 22 PU: 14 DU:2 INI: 2 CU: 1 SU: 17 PU: 33 DU:8 INI: 2 CU: 1 SU: 20 DU:21 INI: 2 CU: 1 SU: 10 PU: 14 DU: 6 INI: 1 CU: 2 SU: 18 PU: 11 DU:3 INI: 2 CU: 1 SU: 17 PU: 33 DU:8 INI: 2 CU: 1 SU: 12 PU: 6 INI: 1 Delhi CU: 5 SU: 5 DU:10 INI: 3 CU: 1 SU: 12 PU: 2 DU:2 INI: 2 CU: 2 SU: 15 DU:2 INI: 3 CU: 1 SU: 20 PU: 1 DU:1 INI: 3 Top 5 states in the given map in terms of total number of universities Next 5 states in the given map in terms of total number of universities CU: 1 SU: 23 PU: 3 DU:15 INI: 2 CU: 3 SU: 32 DU:7 INI: 2 CU: Central Universities States in the given map with the CU: 1 CU: 2 SU: 11 SU: 19 lowest total number of universities SU: State Universities DU:2 DU:29 PU: Public Universities INI: 3 INI: 3 DU: Deemed Universities INI: Institutes of National Importance 56


57 Where is the supply coming from? (2/2) Top 10 states in India with the highest number of universities 57
58 Talent Supply Ecosystem Prominent Categories Talent Supply into the IT-BPM Industry covers a wide gamut of sources including Schools, Colleges, Universities, ITIs and Polytechnics 58


59 Talent Supply Ecosystem ( ) INIs were set up to promote research and innovation. In reality, students passing out of these institutes join same employers and perform similar jobs ; Educational Statistics At A Glance , MHRD 59


60 Enrolments at various level ( ) - Across different levels Number of enrollments at the PhD/M Phil. levels are extremely low This is the talent pool that drives innovation and research ; Educational Statistics At A Glance , MHRD 60
61 Drop-outs at different levels in the Talent Supply Chain An analysis of the enrollments at the different stages in the Education Ecosystem shows that of every 10 candidates enrolled in a graduate course ~1 opts for higher Education while the remaining ~9 join the Industry 61
62 Growth in GER over last 5 years Gross Enrollment Ratio (GER) in higher education is extremely low at 18% Although GER has increased by over 50% from 2006 to 2011 ; Educational Statistics At A Glance , MHRD 62


63 Talent Supply to the IT-BPM Industry An estimated 0.78 millions technically1 qualified graduates are expected to pass-out of the formal education space in Overall, ~5 millions graduates(across all streams) are expected to pass-out in Total Talent Pool 81,46,973 Engineer/ Technology/ Architecture/ Design 15,74,380 42,55,931 46,14,831 50,13,571 4,89,535 6,23,306 7,76,177 FY 2011 FY 2012 FY 2013 FY 2020 FY 2011 FY 2012 FY 2013 FY Technical = Engg Degree + Engg. Diploma (PG + Post-school) + MCA ; Educational Statistics At A Glance , MHRD 63
64 Talent Supply Trends (1/3) Split by Levels The proportion of Post Graduates in the Talent Supply is extremely low. This leads to reduced prospects for R&D and Education areas within each area Millions % % % % Graduates Post Graduates Diploma PhD Budget Allocation for HEIs especially PG Education should be increased to ensure more PG are produced every year. Private participation in PG Education must also be encouraged ; Educational Statistics At A Glance , MHRD 64

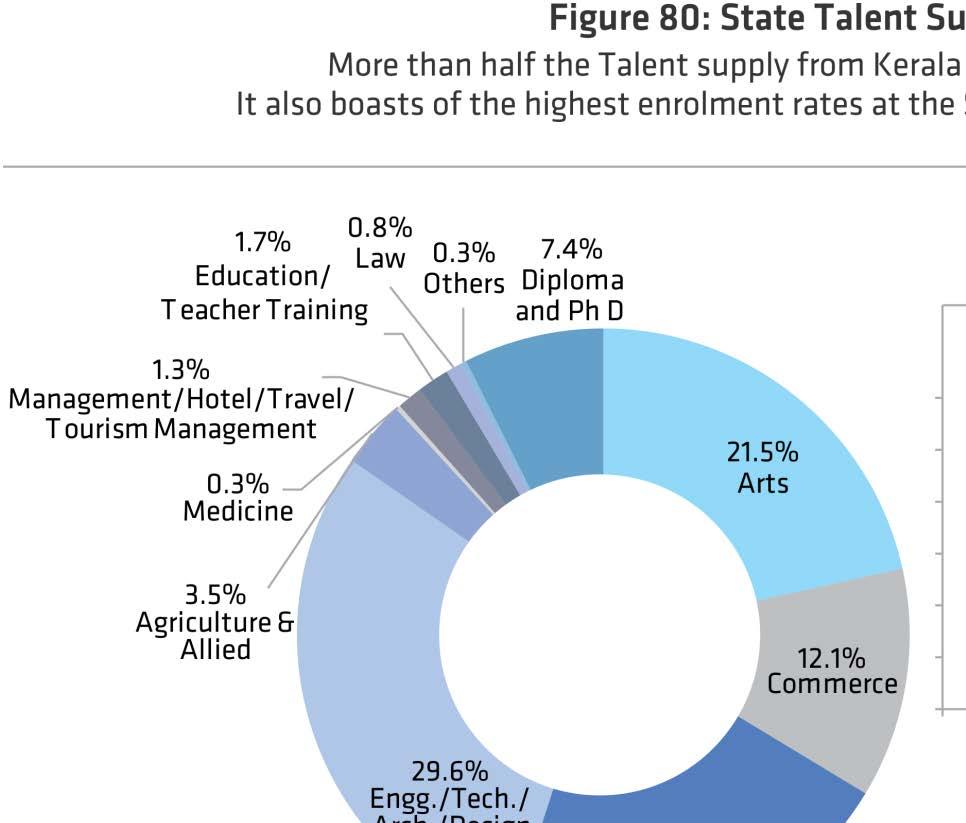
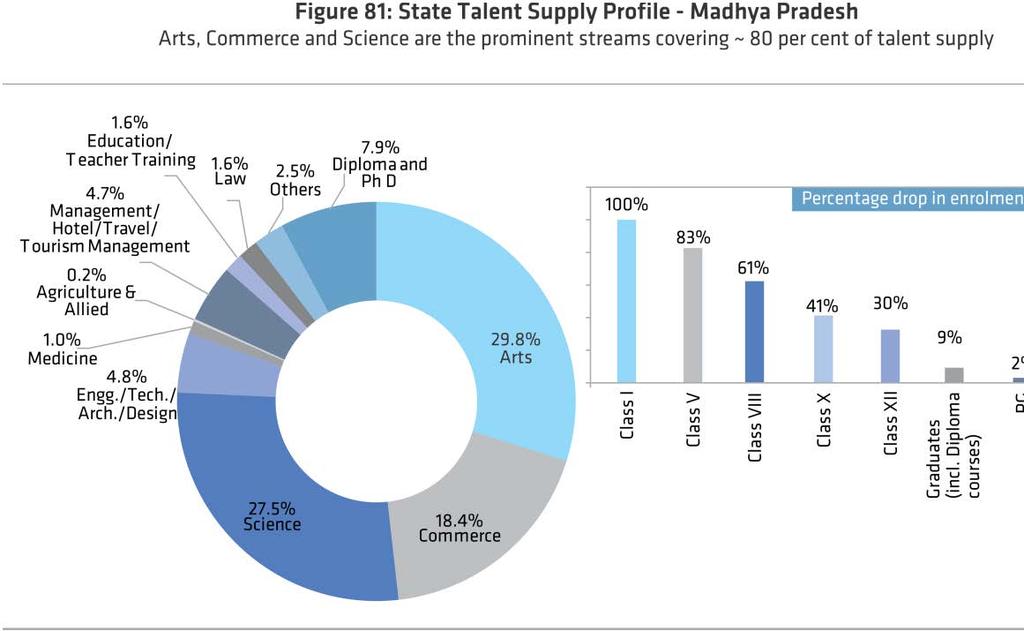
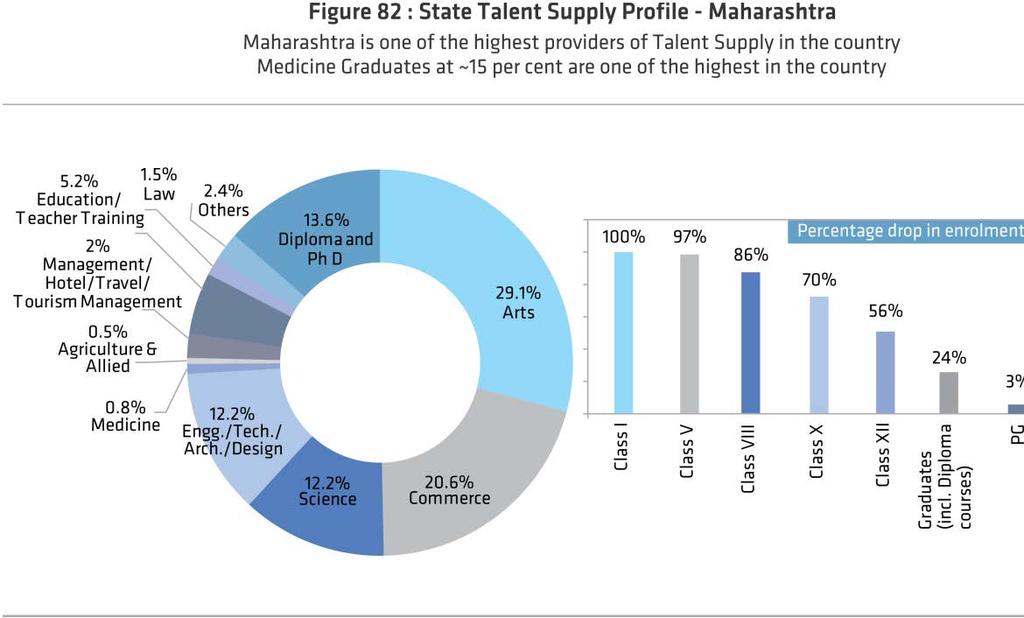
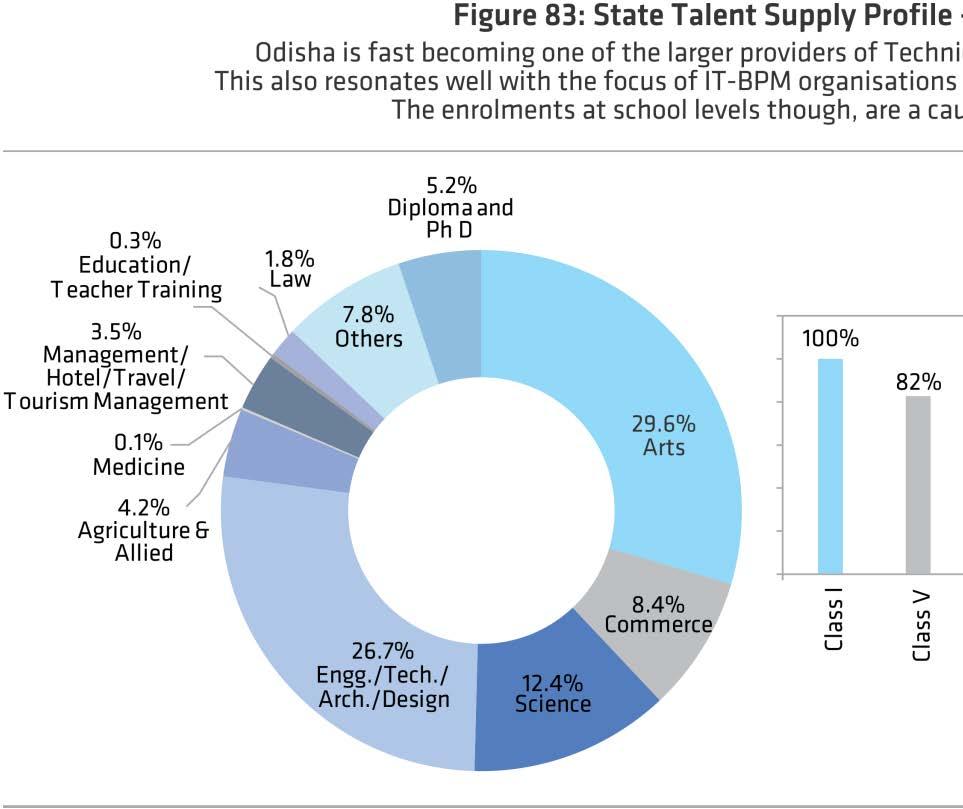
65 Talent Supply Trends (2/3) - Split by Streams ; Educational Statistics At A Glance , MHRD 65
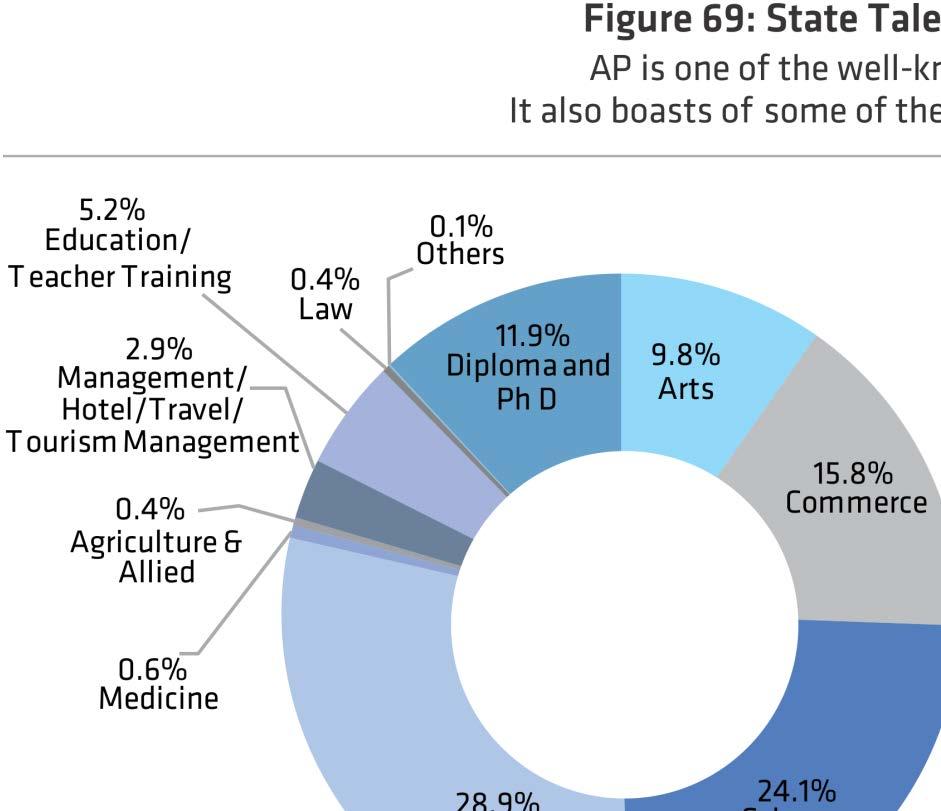
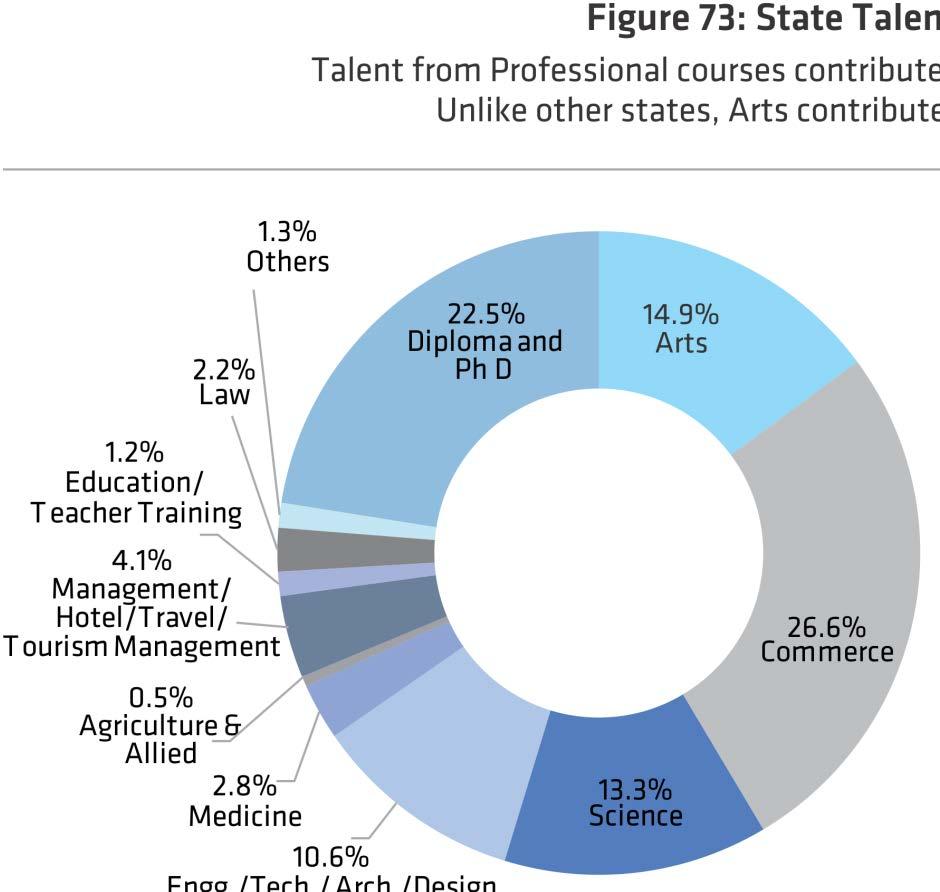
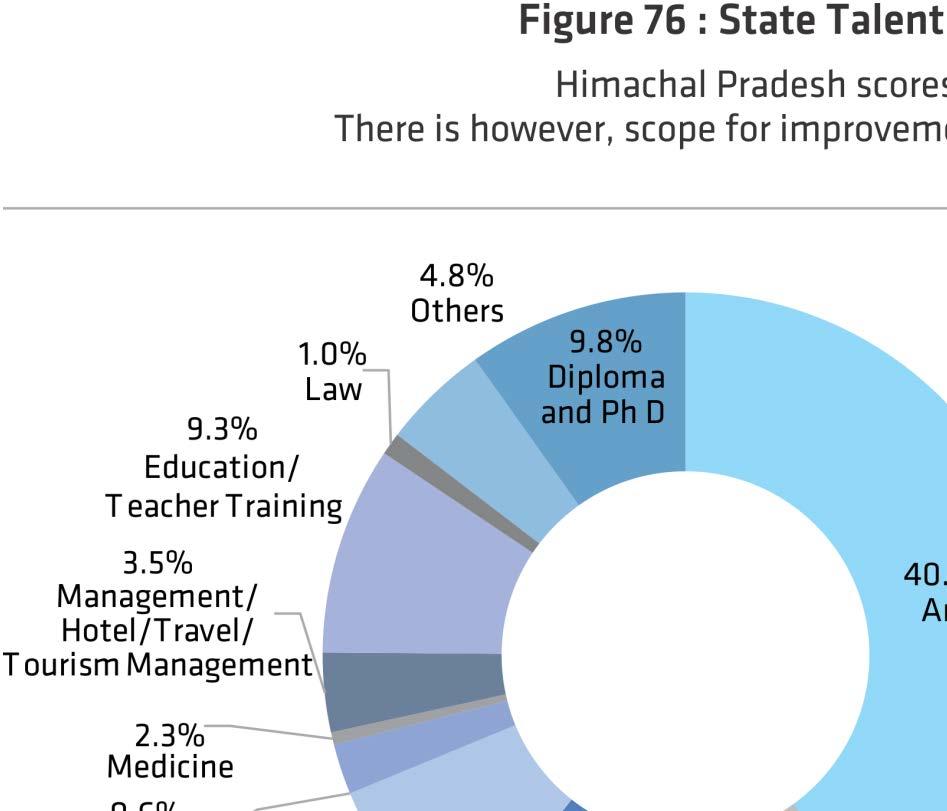
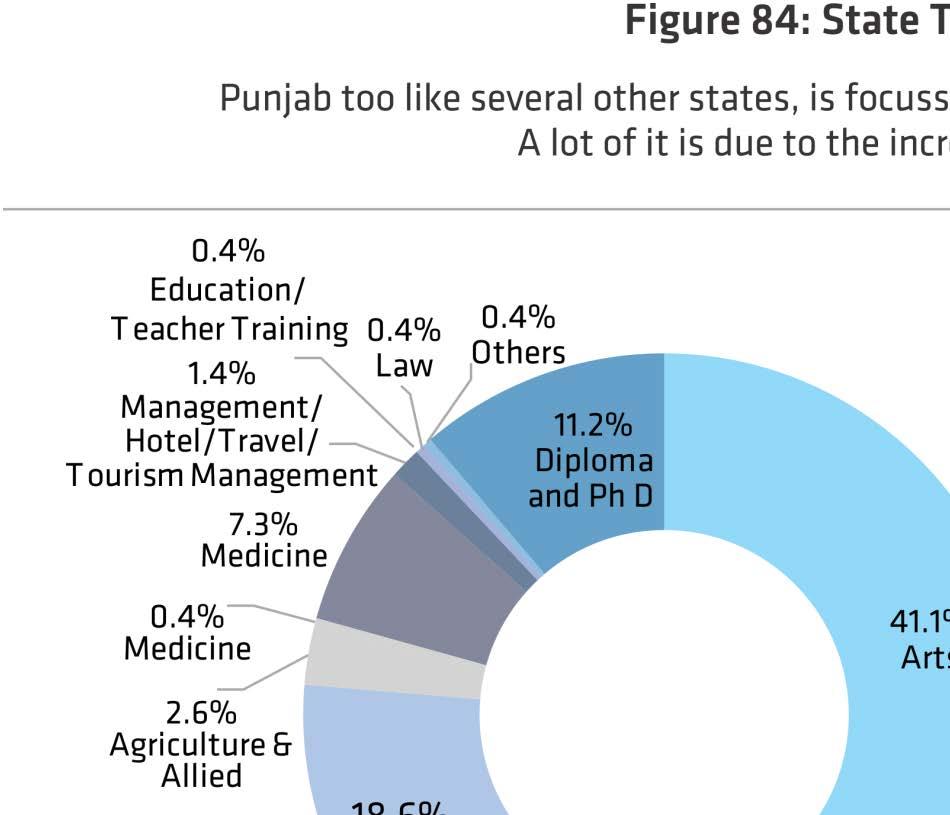
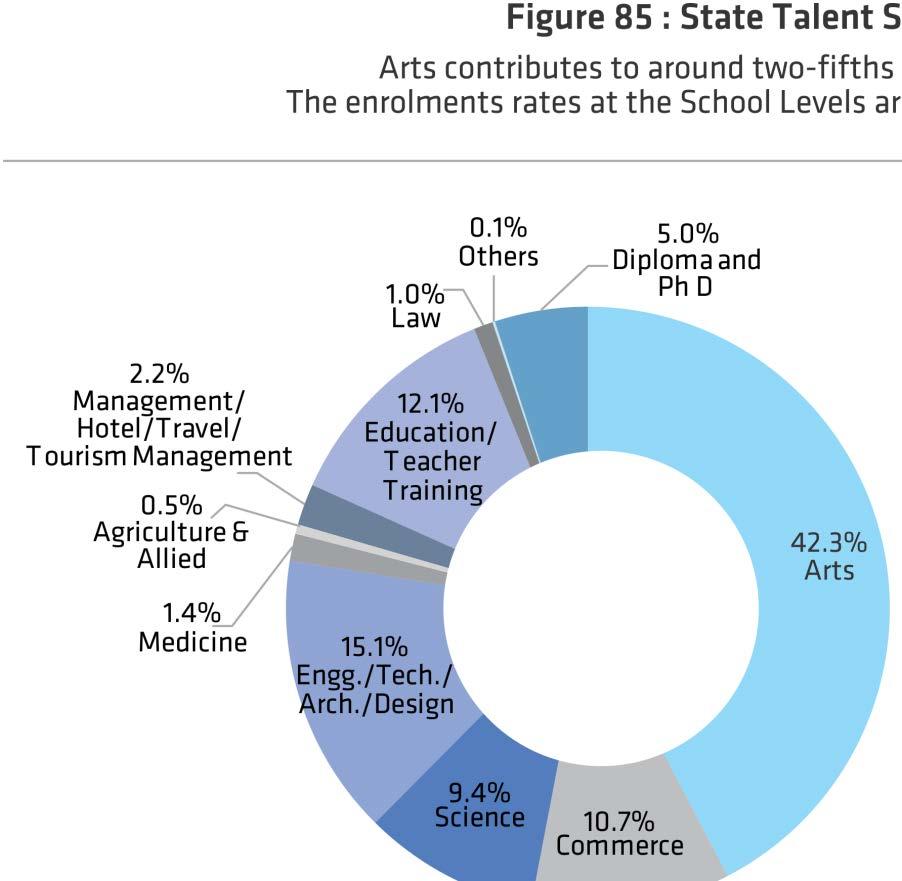
66 Talent Supply Trends (3/3) - Split by Gender Diversity Engineering / Technology is mostly dominated by boys Arts & Medicine are almost balanced in terms of gender diversity India Stream Wise 40 % 46% 40% 41% 29% 48% 19% 37% 50% 29% 22% 41% 54% 60% 59% 71% 52% 81% 63% 50% 71% 78% 59% 60 % Boy Women enrolments should be encouraged more and more in professional courses such as Engineering and Management ; Educational Statistics At A Glance , MHRD 66 Girl
67 Talent Supply Trends Analysis of States by Stream (1/13) Stream Engineering / Technology / Architecture About 60% of India s supply of Engineering Talent comes from five states only. This trend is in-line with Talent Demand as well. Percentage of UG talent from each state Percentage of PG talent from each state Andhra Pradesh 20.4% Tamil Nadu 25.5% Others 15.3% Others 13.4% Maharashtra 14.1% Maharashtra 10.3% Karnataka 9.2% Gujarat 9.2% Tamil Nadu 9.2% West Bengal 9.1% Haryana 5.9% Delhi 8.8% Odisha Kerala Gujarat Rajasthan Uttar Pradesh 5.8% 5.1% 5.1% 4.9% 4.8% 0.0% 10.0% 20.0% 30.0% Punjab Karnataka Uttar Pradesh Andhra Pradesh Kerala 8.5% 4.4% 3.9% 3.9% 2.9% 0.0% 10.0% 20.0% 30.0% ; Educational Statistics , MHRD 67
68 Talent Supply Trends Analysis of States by Stream (2/13) Stream - Commerce Maharashtra is the largest supplier of talent for Commerce stream both for Under Graduate (UG) and Post Graduate (PG) programs Percentage of UG talent from each state Percentage of PG talent from each state Maharashtra 19.0% Maharashtra 34.3% Others Andhra Pradesh Uttar Pradesh 9.8% 9.4% 17.7% Gujarat Others 14.7% 13.7% Karnataka 9.2% Madhya Pradesh 11.5% Madhya Pradesh 7.9% Tamil Nadu 9.8% Gujarat Tamil Nadu Delhi 6.9% 6.1% 5.8% Uttar Pradesh Andhra Pradesh 2.7% 8.4% West Bengal 4.8% Jharkhand 2.5% Bihar 3.4% Chhattisgarh 2.4% 0.0% 5.0% 10.0% 15.0% 20.0% 0.0% 10.0% 20.0% 30.0% 40.0% ; Educational Statistics , MHRD 68
69 Talent Supply Trends Analysis of States by Stream (3/13) Stream - Science More than 60% of Science stream talent comes from 5 states : Uttar Pradesh, Madhya Pradesh, Andhra Pradesh, Tamil Nadu and Maharashtra Percentage of UG talent from each state Percentage of PG talent from each state Others 17.7% Madhya Pradesh 19.4% Uttar Pradesh 13.1% Andhra Pradesh 18.6% Andhra Pradesh Tamil Nadu 12.9% 11.3% Tamil Nadu Maharashtra Uttar Pradesh 14.7% 11.9% 9.9% Maharashtra 11.3% West Bengal 3.8% Madhya Pradesh 10.3% Rajasthan 3.8% Bihar 6.9% Gujarat 2.3% West Bengal 6.1% Punjab 2.1% Karnataka Kerala 4.2% 3.2% Bihar Kerala Chhattisgarh 2.0% 1.9% 1.3% Gujarat 3.1% Others 8.2% 0.0% 10.0% 20.0% 0.0% 10.0% 20.0% 30.0% ; Educational Statistics , MHRD 69
70 Talent Supply Trends Analysis of States by Stream (4/13) Stream - Arts Almost 1/4 th of Art stream talent supply comes from state of Uttar Pradesh Percentage of UG talent from each state Uttar Pradesh Others Maharashtra West Bengal Bihar Karnataka Uttarakhand Madhya Pradesh Rajasthan Tamil Nadu Chhattisgarh Delhi Gujarat 4.4% 4.2% 3.9% 3.6% 3.3% 2.7% 5.5% 4.6% 10.2% 9.3% 9.1% 18.0% 21.2% 0.0% 10.0% 20.0% 30.0% Percentage of PG talent from each state Uttar Pradesh Maharashtra Madhya Pradesh Chhattisgarh West Bengal Gujarat Bihar Uttarakhand Tamil Nadu Rajasthan Andhra Pradesh Jammu & Kashmir Others 3.6% 3.6% 2.0% 5.8% 4.8% 4.5% 4.2% 6.1% 9.5% 8.8% 12.2% 11.7% 23.1% 0.0% 10.0% 20.0% 30.0% ; Educational Statistics , MHRD 70
71 Talent Supply Trends Analysis of States by Stream (5/13) Stream - Medicine Top supplier for Medical Talent are Karnataka, Gujarat, Maharashtra, Odisha & Tamil Nadu Percentage of UG talent from each state Percentage of PG talent from each state Karnataka Tamil Nadu Odisha Maharashtra Gujarat Kerala Madhya Pradesh West Bengal Andhra Pradesh Rajasthan Bihar Uttar Pradesh Others 19.9% 13.1% 8.4% 8.2% 8.1% 5.3% 4.7% 4.1% 3.8% 3.7% 3.2% 3.1% 14.5% 0.0% 5.0% 10.0% 15.0% 20.0% 25.0% Gujarat Karnataka Punjab Maharashtra Tamil Nadu Uttar Pradesh Rajasthan Kerala Delhi Madhya Pradesh Odisha West Bengal Others 20.1% 18.9% 14.0% 7.0% 7.0% 5.7% 5.4% 3.8% 3.6% 3.5% 2.2% 1.6% 7.1% 0.0% 5.0% 10.0% 15.0% 20.0% 25.0% ; Educational Statistics , MHRD 71
72 Talent Supply Trends Analysis of States by Stream (6/13) Stream - Agriculture & Allied Stream More than 50% of talent for Agriculture and Allied Streams come from Uttar Pradesh, Maharashtra & West Bengal Percentage of UG talent from each state Percentage of PG talent from each state West Bengal 27.0% Uttar Pradesh 17.7% Uttar Pradesh Maharashtra Andhra Pradesh 6.5% 14.0% 25.7% Maharashtra Madhya Pradesh Karnataka Gujarat 6.4% 10.0% 9.1% 14.2% Karnataka 4.5% Andhra Pradesh 5.2% Rajasthan 3.9% West Bengal 5.2% Gujarat Bihar Madhya Pradesh Delhi 3.4% 1.7% 1.4% 1.3% Punjab Rajasthan Tamil Nadu Haryana Himachal Pradesh 5.2% 4.5% 3.4% 2.5% 2.5% Others 10.5% Others 14.2% 0.0% 10.0% 20.0% 30.0% 0.0% 5.0% 10.0% 15.0% 20.0% ; Educational Statistics , MHRD 72
73 Talent Supply Trends Analysis of States by Stream (7/13) Stream Management / Hotel / Travel / Tourism Stream 27% of Under Graduate (UG) talent comes from Tamil Nadu 20% of Post Graduate (PG) talent comes from Andhra Pradesh Percentage of UG talent from each state Percentage of PG talent from each state Tamil Nadu 26.7% Andhra Pradesh 19.6% Gujarat 14.7% Maharashtra 16.2% Madhya Pradesh 14.4% Tamil Nadu 9.1% Haryana Punjab Maharashtra Karnataka Odisha West Bengal 7.6% 5.6% 5.2% 4.0% 4.0% 3.1% Uttar Pradesh Madhya Pradesh Gujarat Haryana Rajasthan Punjab West Bengal 8.5% 8.5% 7.6% 7.1% 5.3% 5.0% 4.1% Delhi 2.3% Odisha 3.0% Bihar 2.0% Delhi 1.5% Others 10.4% Others 4.5% 0.0% 10.0% 20.0% 30.0% 0.0% 10.0% 20.0% 30.0% ; Educational Statistics , MHRD 73
74 Talent Supply Trends Analysis of States by Stream (8/13) Stream - Education / Teacher Training Stream Uttar Pradesh and Maharashtra are the biggest sources of both Under Graduate (UG) Talent for Education Stream Percentage of UG talent from each state Percentage of PG talent from each state Uttar Pradesh 13.9% Maharashtra 32.1% Maharashtra 12.6% Bihar Tamil Nadu 11.6% 11.3% Haryana 12.6% Madhya Pradesh 5.6% Tamil Nadu 12.2% Jammu & Kashmir Punjab 5.1% 4.4% Gujarat 10.2% Gujarat 4.0% Rajasthan 9.0% Delhi Uttar Pradesh 3.3% 2.8% Andhra Pradesh 8.3% West Bengal 2.6% Jammu & Kashmir 7.2% Andhra Pradesh Rajasthan 2.3% 2.2% Others 13.9% Others 12.7% 0.0% 5.0% 10.0% 15.0% 0.0% 10.0% 20.0% 30.0% 40.0% ; Educational Statistics , MHRD 74
75 Talent Supply Trends Analysis of States by Stream(9/13) Stream- Law Stream A quarter of Law stream UG talent comes from state of Uttar Pradesh while more than a quarter of PG talent comes from Delhi Percentage of UG talent from each state Percentage of PG talent from each state Uttar Pradesh 22.9% Delhi 27.0% Maharashtra 17.5% Maharashtra 20.5% Madhya Pradesh 9.0% Gujarat 6.5% Bihar 7.4% Madhya Pradesh 5.8% Karnataka 4.6% Uttar Pradesh 5.8% Tamil Nadu Gujarat Odisha Assam Rajasthan 4.2% 4.2% 4.2% 3.6% 3.4% Jammu & Kashmir West Bengal Andhra Pradesh Haryana Rajasthan Assam 5.8% 4.9% 3.8% 3.1% 2.5% 2.5% West Bengal 3.2% Kerala 2.3% Others 15.8% Others 9.5% 0.0% 10.0% 20.0% 30.0% 0.0% 10.0% 20.0% 30.0% ; Educational Statistics , MHRD 75
76 Talent Supply Trends Analysis of States by Stream (10/13) Stream - Other Streams 40% of UG talent for other streams come from Bihar & Maharashtra while 40 % of PG talent for Other Streams comes from Gujarat Percentage of UG talent from each state Percentage of PG talent from each state Bihar Maharashtra Delhi Odisha Madhya Pradesh Gujarat Tamil Nadu Uttar Pradesh Himachal Pradesh West Bengal Nagaland Haryana Others 22.7% 20.2% 13.2% 10.8% 8.6% 5.3% 3.8% 3.0% 2.6% 2.3% 1.6% 1.6% 4.2% Gujarat Odisha Maharashtra Madhya Pradesh Delhi Haryana Tamil Nadu Bihar West Bengal Uttar Pradesh Himachal Pradesh Punjab Others 40.3% 12.5% 12.2% 9.1% 4.2% 3.3% 3.2% 2.9% 2.2% 2.2% 2.0% 1.1% 4.8% 0.0% 10.0% 20.0% 30.0% 0.0% 20.0% 40.0% 60.0% ; Educational Statistics , MHRD 76
77 Talent Supply Trends Analysis of States by Stream (11/13) Stream - Post School Diploma Maharashtra & Gujarat supply more than a third of Post School Diploma talent Percentage of Post School Diplomas from each state Maharashtra 22.5% Gujarat Andhra Pradesh 13.4% 13.1% Karnataka 10.7% Tamil Nadu Haryana 7.6% 7.3% Uttar Pradesh Punjab Delhi Madhya Pradesh Kerala Rajasthan 2.9% 2.8% 2.7% 2.3% 2.2% 2.1% Others 10.4% 0.0% 5.0% 10.0% 15.0% 20.0% 25.0% ; Educational Statistics , MHRD 77
78 Talent Supply Trends Analysis of States by Stream(12/13) Stream- PG Diploma 41% of PG Diploma talent from the state of Madhya Pradesh Percentage of PG Diploma talent from each state Madhya Pradesh Chhattisgarh Maharashtra Gujarat Karnataka West Bengal Rajasthan Delhi Himachal Pradesh Assam Uttar Pradesh Puducherry Others 4.5% 3.8% 2.8% 2.7% 2.2% 1.2% 1.2% 1.1% 6.1% 9.3% 12.6% 11.5% 40.8% 0.0% 5.0% 10.0% 15.0% 20.0% 25.0% 30.0% 35.0% 40.0% 45.0% ; Educational Statistics , MHRD 78
79 Talent Supply Trends Analysis of States by Stream (13/13) Stream - PhD / M Phil Tamil Nadu and Andhra Pradesh supply more than a third of Phd/ M. Phil talent Percentage of PhD/MPhil talent from each state Tamil Nadu 22.2% Andhra Pradesh Delhi 11.4% 12.8% Uttar Pradesh Maharashtra 8.9% 8.7% Madhya Pradesh West Bengal Himachal Pradesh Gujarat Bihar Punjab Kerala 5.0% 4.5% 3.7% 3.4% 2.9% 2.3% 2.0% Others 12.3% 0.0% 5.0% 10.0% 15.0% 20.0% 25.0% ; Educational Statistics , MHRD 79
80 Contents Analysis of Supply Chain w.r.t. Academic outcomes Executive Summary Summary of Academic Outcomes Demand-Supply Ecosystem Assessment Insights Analysis of Current and Future Demand and Supply of Talent Summary of analysis of curricula Region-wise Curricula Evaluation Sub-sector/Occupation wise Analysis of curricula w.r.t. academic outcomes using Bloom s Taxonomy Diversity Critical competencies for the IT-BPM Industry Skill Gaps and Challenges Learning outcomes identified by NBA Recommendations Detailed note on Bloom s Taxonomy of Learning Outcomes 80
81 Summary of Academic Outcomes An analysis of 8 courses across streams and colleges was conducted to assess the academic outcomes w.r.t. formative and summative assessments The courses were assessed using the Bloom s Taxonomy for learning objectives The following courses were chosen: 1. Bachelors in Technology (B. Tech.) 2. Bachelors in Science 3. Bachelors in Arts 4. Bachelors in Commerce 5. Bachelors in Law 6. Bachelors in Education 7. Bachelors in Medicine Bachelors in Surgery (MBBS) 8. Masters in Business Administration (MBA) 81
82 Assessments insights The analysis highlighted key areas of strength and need for improvements w.r.t. outcomes expected by the Industry Relatively, the reviewed curricula focused more on Cognitive Domain than on Affective Domain and Psychomotor Domain Analysis of skills within the Cognitive domain reveals that the curricula lacks focus on higher order Cognitive Skills While almost all curricula focus on the end objective of theory and knowledge elements, elements such as synthesis and evaluation are not focused in the evaluated curricula Based on calculated scores B. Tech, MBBS and MBA programs emerged to be the top 3 courses when evaluated on a set framework of Bloom s Taxonomy of Learning objectives The courses seem to focus a lot on the Knowledge elements and focused heavily on developing theory in the requisite areas All courses focused minimally on the Affective domain an observation that has been validated with senior recruitment professionals- this has led to high skills gaps on softer aspects of Communication and Business Conduct 82
83 Summary of analysis of curricula using Bloom s Taxonomy Domain Learning Objectives B Arts BCom B Sc B Tech MBBS LLB Cognitive domain Affective domain Psychomotor domain Knowledge Comprehension Application Analysis Synthesis Evaluation Listening Responding to phenomenon Valuing Organization Internalizing values Perception Set Guided Response Mechanism Complex Overt Response Adaptation Origination MBA/PGDB M 83 B Ed


84 We analysed the curricula from a representative sample of institutes for the following courses The courses and institutes were chosen to holistically represent regional coverage and based on preferred institutions as selected by ~300 organizations over an online survey from a range of Institutes including Anna University, Punjab University, AIIMS, Delhi University etc. Bachelor of Science Bachelor of Education MBA Bachelor of Law MBBS Bachelor of Technology Bachelor of Arts Bachelor of Commerce 84
85 Summary of curricula evaluation (1/3) The reviewed course curricula lacked focus on Ideation and Innovation related skills. B. Com. curricula also did not seem to lay enough emphasis on Decision making skills, which are extremely important in Finance jobs S. No. Course Course Analysis 1 B. Arts 2 B. Com. 3 B. Sc. The evaluated Arts curriculum focused on theory elements of English, Local Language, Economics, Geography, Sociology, Political Sciences etc. It included minimal components of practical or industry exposure. The course also focuses on culture, values and social ethics. Community work Ideation was one of the key areas that was missing The evaluated Commerce curriculum focused on theory elements of Financial Accounting, Business Communication, Business Mathematics, Statistics, Economics etc. It included components of accounting standards and account maintenance. There were components of financial analysis of organizations as part of projects but practical exposure was missing. Decision making as a result of analysis and Ideation were some of the key areas that was missing The evaluated Science curriculum focused on theory elements of Physics, Chemistry, Biology, Statistics, Computer Science, Mathematics etc. It included a good mix of practical and theoretical subjects especially in the area of Physics, Chemistry and Biology. However, the curricula focused less on research and ideation but more on understanding application of theory. Ideation and innovation/research skills were the key areas that were missing 85
86 Summary of curricula evaluation (2/3) The evaluated Engineering curricula was found to be a balanced mix of theoretical and practical knowledge. Research related skills was lacking focus. S. No. Course Summary analysis 4 B. Tech. 5 MBBS 6 LLB The evaluated Engineering curriculum focused on theory elements of Applied Physics, Chemistry, Mathematics, Computer Systems, Electronics and Electrical Systems etc. The curriculum was found to be an optimum mix of practical and theoretical subjects. The practical subjects focused essentially on the application of theory. The curriculum also comprised of research and project work however original research/ideation was not mandatory but only optional. Due importance was assigned for professional experience (internship) by assigning credits and dedicating a window of time for the same. Ideation and innovation/research skills were the key areas that were missing The evaluated Medicine curriculum focused on theory elements of Anatomy, Biochemistry, Physiology, Medicine, Surgery, Psychiatry etc. The curriculum was observed to be a good mix of theory and practical courses. It however appeared to contain too many subjects in the duration of the course/subject. The focus on practical and hands-on learning was extremely high. It covered courses pertaining to community welfare and social medicine. Additionally, the course curriculum gives due importance to practical exposure by dedicating one year for internship. Ideation and innovation/research skills were the key areas that were missing The evaluated Law curriculum focused on theory elements of Law of Contract, Family Law, Constitutional Law, Law of Torts, Environmental Law, Company Law etc. The curricula seemed too much fact and theory based. There was too less of a focus on practical aspects of application of law. The curriculum did focus on case studies to highlight reference to the laws in real scenarios, however the proportion of this methodology was quite less. Application of law, practical exposure and ideation and innovation were the key areas that were missing 86
87 Summary of curricula evaluation (3/3) The MBA curricula was one of the rare courses that lay due importance to application of theory in the form of academic projects and all-round evaluation. S. No. Course Summary analysis 7 MBA/PGDB M 8 B Ed The evaluated management curriculum focused on theory elements of Financial Management, Marketing, Organization Behavior, Operations Management etc. The curriculum was a mix of theoretical subjects and project work to apply the theoretical knowledge. There was due importance in terms of credits assigned to application of theory in the form of academic projects. Due importance was assigned for professional experience(internship) by assigning credits and dedicating a window of time for the same. The curriculum was closely integrated with the skills demanded by the industry. Ideation and innovation/research skills were the key areas that were missing The evaluated management curriculum focused on theory elements of the role of Education System, Sociology, Culture and Values Systems etc. The curriculum focuses on teaching methodology and less on theoretical subjects. The curriculum focused on understanding the bigger picture of education, culture and the impact of education on the social structure. Importance was also given to practical exposure in the form of community based project work Ideation and innovation/research skills were the key areas that were missing 87
88 Recommended learning outcomes based on NOS(1/2) Key learning outcomes that the courses focused on were identified based on Bloom s Taxonomy. Learning outcomes based on NOS that should be included in the curricula have been highlighted for each course. S. No. Course Key Learning Outcomes As is Key Learning outcomes - Desired 1 B. Arts 2 B. Com. 3 B.Sc. 4 B. Tech. Knowledge Comprehension Valuing Organization Knowledge Comprehension Analysis Evaluation Organization Knowledge Comprehension Analysis Evaluation Organization Knowledge Comprehension Analysis Evaluation Mechanism Complex response Analytical Thinking Application Problem Solving/ Synthesis Responding to Phenomenon, Adaption Innovation/Creativity/ Origination Problem Solving/ Synthesis Responding to Phenomenon, Adaption Innovation/Creativity/ Origination Oral Communication Problem Solving/ Synthesis Responding to Phenomenon, Adaption Innovation/Creativity/ Origination Oral Communication Internalizing values Problem Solving/ Synthesis Innovation/Creativity/ Origination Valuing Application 88
89 Recommended learning outcomes based on NOS(2/2) Key learning outcomes that the courses focused on were identified based on Bloom s Taxonomy. Learning outcomes based on NOS that should be included in the curricula have been highlighted for each course S. No. Course Key Learning Outcomes Learning outcomes which should be included 5 MBBS Knowledge Application Valuing Set Guided Response Complex Response Responding to Phenomenon, Adaption Plan and Organize Innovation/Creativity/ Origination 6 L.LB Knowledge Comprehension Analysis Evaluation Analytical Thinking Problem Solving/ Synthesis Responding to Phenomenon, Adaption Innovation/Creativity/ Origination 7 MBA/PGDBM 8 B. Ed. Knowledge Comprehension Analysis Evaluation Mechanism Complex response Knowledge Evaluation Valuing Comprehension Application Guided response Mechanism Responding to Phenomenon, Adaption Innovation/Creativity/ Origination Internalizing values Analytical Thinking Problem Solving/ Synthesis Responding to Phenomenon, Adaption Innovation/Creativity/ Origination 89 Internalizing values
90 Using a combination of Primary and Secondary research we have identified the following competencies to be critical for IT-BPM Industry Following outcomes have been identified as critical success factors for employment in the IT-BPM Industry a) System-level perspective (including Knowledge integration, consideration for multilateral viewpoint, and user centeredness) b) Analytical skills (including investigative skills, critical thinking, numerical ability, attention to detail, visualize/conceptualize, research and experimentation skills) c) Creativity and Idea Initiation d) Entrepreneurship, Decision-making, Project Planning and Adaptability e) Persuasion skills, Mentoring skills, Persistence and Sense of urgency f) Sensitivity towards moral responsibilities and sustainability g) Knowledge of contemporary issues h) Ability to work in multicultural teams i) Listening j) Adaptability and ability to multi-task k) Organizational skills l) Be the customer mentality m) Project planning and management n) Stress management 90
91 Expected learning outcomes identified by National Board of Accreditation (NBA) NBA India s only official accreditation body for engineering education has established 11 Program Outcomes. The analysed courses lacked highly on Communication, Contemporary issues, Design skills. The NBA is a provisional member of the Washington Accord an international agreement between accreditation agencies for engineering education for 18 countries. The NBA criteria are: a) Graduates will demonstrate knowledge of mathematics, science and engineering b) Graduates will demonstrate an ability to identify, formulate and solve engineering problems c) Graduates will demonstrate an ability to design and conduct experiments, analyze and interpret data d) Graduates will demonstrate an ability to design a system, component or process as per needs and specifications e) Graduates will demonstrate an ability to visualize and work on laboratory and multidisciplinary tasks f) Graduate will demonstrate skills to use modern engineering tools, techware and equipment to analyze problems g) Graduates will demonstrate knowledge of professional and ethical responsibilities h) Graduate will be able to communicate effectively in both verbal and written form i) Graduate will show the understanding of impact of engineering solutions on the society and also will be aware of contemporary issues j) Graduate will develop confidence for self-education and ability for life-long learning k) Graduate who can participate and succeed in competitive examinations. 91
92 Detailed note on Bloom s Taxonomy of Learning Outcomes(1/3) Cognitive Domain Category Knowledge: Recall data or information Comprehension: Understand the meaning, translation, interpolation, and interpretation of instructions and problems. State a problem in one's own words Example Examples: Recite a policy. Quote prices from memory to a customer. Knows the safety rules. Examples: Rewrites the principles of test writing. Explain in one's own words the steps for performing a complex task. Translates an equation into a computer spreadsheet. Application: Use a concept in a new situation or unprompted use of an abstraction. Applies what was learned in the classroom into novel situations in the work place Examples: Use a manual to calculate an employee's vacation time. Apply laws of statistics to evaluate the reliability of a written test. Analysis: Separates material or concepts into component parts so that its organizational structure may be understood. Distinguishes between facts and inferences Examples: Troubleshoot a piece of equipment by using logical deduction. Recognize logical fallacies in reasoning. Gathers information from a department and selects the required tasks for training. Synthesis: Builds a structure or pattern from diverse elements. Put parts together to form a whole, with emphasis on creating a new meaning or structure Evaluation: Make judgments about the value of ideas or materials Examples: Write a company operations or process manual. Design a machine to perform a specific task. Integrates training from several sources to solve a problem. Revises and process to improve the outcome. Examples: Select the most effective solution. Hire the most qualified candidate. Explain and justify a new budget. 92
93 Detailed note on Bloom s Taxonomy of Learning Outcomes (2/3) Affective Domain Category Receiving Phenomena: Awareness, willingness to hear, selected attention. Responding to Phenomena: Active participation on the part of the learners. Attends and reacts to a particular phenomenon. Learning outcomes may emphasize compliance in responding, willingness to respond, or satisfaction in responding (motivation). Example Examples: Listen to others with respect. Listen for and remember the name of newly introduced people. Examples: Participates in class discussions. Gives a presentation. Questions new ideals, concepts, models, etc. in order to fully understand them. Know the safety rules and practices them. Valuing: The worth or value a person attaches to a particular object, phenomenon, or behavior. This ranges from simple acceptance to the more complex Key Words: completes, demonstrates, differentiates, explains, follows, forms, initiates, state of commitment. Valuing is based on the invites, joins, justifies, proposes, reads, reports, selects, shares, studies, works. internalization of a set of specified values, while clues to these values are expressed in the learner's overt behavior and are often identifiable. Organization: Organizes values into priorities by contrasting different values, resolving conflicts between them, and creating an unique value system. The emphasis is on comparing, relating, and synthesizing values. Internalizing values (characterization): Has a value system that controls their behavior. The behavior is pervasive, consistent, predictable, and most importantly, characteristic of the learner. Instructional objectives are concerned with the student's general patterns of adjustment (personal, social, emotional). Examples: Recognizes the need for balance between freedom and responsible behavior. Accepts responsibility for one's behavior. Explains the role of systematic planning in solving problems. Accepts professional ethical standards. Creates a life plan in harmony with abilities, interests, and beliefs. Prioritizes time effectively to meet the needs of the organization, family, and self. Examples: Shows self-reliance when working independently. Cooperates in group activities (displays teamwork). Uses an objective approach in problem solving. Displays a professional commitment to ethical practice on a daily basis. Revises judgments and changes behavior in light of new evidence. Values people for what they are, not how they look. 93
94 Detailed note on Bloom s Taxonomy of Learning Outcomes (3/3) Psychomotor Domain Category Example Examples: Detects non-verbal communication cues. Estimate where a ball will land after it is Perception: The ability to use sensory cues to guide motor thrown and then moving to the correct location to catch the ball. Adjusts heat of stove to correct activity. This ranges from sensory stimulation, through cue temperature by smell and taste of food. Adjusts the height of the forks on a forklift by selection, to translation. comparing where the forks are in relation to the pallet. Set: Readiness to act. It includes mental, physical, and Examples: Knows and acts upon a sequence of steps in a manufacturing process. Recognize emotional sets. These three sets are dispositions that one's abilities and limitations. Shows desire to learn a new process (motivation). NOTE: This predetermine a person's response to different situations subdivision of Psychomotor is closely related with the Responding to phenomena subdivision (sometimes called mindsets). of the Affective domain. Guided Response: The early stages in learning a complex Examples: Performs a mathematical equation as demonstrated. Follows instructions to build a skill that includes imitation and trial and error. Adequacy of model. Responds hand-signals of instructor while learning to operate a forklift. performance is achieved by practicing. Mechanism: This is the intermediate stage in learning a complex skill. Learned responses have become habitual Examples: Use a personal computer. Repair a leaking faucet. Drive a car. and the movements can be performed with some confidence and proficiency. Complex Overt Response: The skillful performance of motor acts that involve complex movement patterns. Proficiency is indicated by a quick, accurate, and highly coordinated performance, requiring a minimum of energy. This category includes performing without hesitation, and automatic performance. For example, players are often utter sounds of satisfaction or expletives as soon as they hit a tennis ball or throw a football, because they can tell by the feel of the act what the result will produce. Adaptation: Skills are well developed and the individual can modify movement patterns to fit special requirements. Origination: Creating new movement patterns to fit a particular situation or specific problem. Learning outcomes emphasize creativity based upon highly developed skills. Examples: Maneuvers a car into a tight parallel parking spot. Operates a computer quickly and accurately. Displays competence while playing the piano. Examples: Responds effectively to unexpected experiences. Modifies instruction to meet the needs of the learners. Perform a task with a machine that it was not originally intended to do (machine is not damaged and there is no danger in performing the new task). Examples: Constructs a new theory. Develops a new and comprehensive training programming. Creates a new gymnastic routine. 94
95 Contents Executive Summary Talent Demand-Supply Analysis Demand-Supply Ecosystem Hiring and Talent Supply in IT-BPM Industry Analysis of Current and Future Demand and Supply of Talent Employable Talent Supply Region-wise Talent Demand-Supply Analysis- Entry level (0-2 yrs.) Sub-sector/Occupation wise Talent Demand-Supply Analysis- Experienced level (>2 yrs.) Diversity Talent Demand-Supply Analysis by Region and State Skill Gaps and Challenges Recommendations PS: The analytics in this section consider supply as employable supply the same has been defined in the initial slides in the section 95
96 Hiring in Industry Net hiring / Job-creation Funneling Though companies hire across all levels, 95% of the net hiring or net jobcreation for industry is at the entry-level Gross Hiring ~ 0.4 million Company A Company B Other industry + Lateral Hiring -- Attrition + Fresher Hiring Experienced Experienced Experienced FY 2013 Entry level Entry level Entry level Net Hiring ~ 0.2 million FROM COLLEGES 96
97 Talent Supply for IT-BPM Industry - Non BPM sub-sector Out of the total talent from technical stream and willing to work in the IT-BPM Industry ~24% are employable in the IT-BPM Industry (exported oriented / high end occupations). Percentage Available Talent Supply ( for 2013) Total Supply from Technical Streams millions 80% Willing to work in IT-BPM millions Employable 24% millions 97
98 Talent Supply for IT-BPM Industry - BPM sub-sector Out of the total supply from non-technical streams and willing to work in the IT- BPM Industry ~18% are employable in the IT-BPM Industry (BPM sub-sector) Percentage Available Talent Supply Total Supply of Other Streams millions 60% Willing to work in IT-BPM millions Employable 18% millions 98
99 Talent Supply for IT-BPM Industry- BPM sub-sector Overall considering total supply from All streams and willing to work in the IT- BPM Industry ~20% are employable in the IT-BPM Industry Percentage Available Talent Supply Total Supply of Other Streams millions 62% Willing to work in IT-BPM millions Employable 20% millions 99
100 Employable Talent Supply for IT-BPM Sector Only ~0.15 mn technically qualified candidates are estimated to be employable in the non BPM sub-sectors out of the ~8 mn people supplied from technical streams in This proportion is lower for other streams Millions Millions Total 0.62 Willing 0.15 Employable Total Willing 0.46 Employable Total Willing 0.61 Employable Total 0.9 Willing 0.2 Employable Total Willing 0.5 Employable Total Willing 0.8 Employable Technical non Technical All graduates Technical non Technical All graduates 100
101 Talent Demand-Supply Analysis : IT-BPM Industry Assuming the most likely* scenario for growth in employment, the availability of talent will continue to be in excess of the demand 9 percent p.a ; Educational Statistics At A Glance , MHRD 101
102 Talent Demand-Supply Analysis : BPM sub-sector For BPM sub-sector, the demand supply gap will be relatively larger. This is due to the fact that the non-engineering talent is potential supply to each and every industry in the Indian economy. 6,00,000 Demand-Supply analysis - BPM sub-sector 5,00,000 4,00,000 3,00,000 2,00,000 1,00, Demand BPM 74,400 71,300 60,140 1,47,688 Employable non engineers 4,06,771 4,31,085 4,57,639 5,32,380 9 percent p.a ; Educational Statistics At A Glance , MHRD 102

103 Talent Demand-Supply Analysis by 2020 By 2020, the gap between demand and supply is expected to reduce, which will become a challenge as high-growth industries such as electronics, retail, telecom, healthcare, infrastructure will attract talent from the same supply pool ; NASSCOM STR ; 103
104 Level wise analysis (entry and experienced) The supply for experienced people is highly constrained as this is where companies hire from each other, 95% of net job creation is at entry level 104


105 Talent Demand-Supply Analysis By Region Demand is ~60% for South region while the Supply is fairly well-distributed across all regions ; STPI Annual Report


106 Current Talent Demand Analysis By State Karnataka, Delhi, Maharashtra, Tamil Nadu and Andhra Pradesh account for 86% of all jobs created in country, this figure was 90% 5 years back ; STPI Annual Report

107 Talent Supply Analysis By State 5 States Maharashtra, Uttar Pradesh, Andhra Pradesh, Tamil Nadu and Karnataka contribute to more than 50%of the total potential supply for IT-BPM 107
108 Demand-Supply Gap North Region Delhi and Chandigarh face a supply crunch Uttar Pradesh and Haryana dominate the employable supply in the North Region ; STPI Annual Report
109 Demand-Supply Gap South and East In Karnataka demand exceeds supply by ~30% ; STPI Annual Report
110 Demand-Supply Gap West and Central Madhya Pradesh could be evaluated as a new destination for IT-BPM jobs ; STPI Annual Report
111 Contents Executive Summary Demand-Supply Ecosystem Analysis of Current and Future Demand and Supply of Talent Recommendations Region-wise Sub-sector/Occupation wise Diversity Skill Gaps and Challenges Recommendations 111

112 Summary of Recommendations The report makes recommendations to resolve the key issues identified. Corrective actions and data-based policy making can ensure that the Industry comes out stronger and continues on the path of growth Recommendations Change positioning from service based to product based Locate Demand closer to Supply bases Devise Skill Developm ent Initiatives based on the foundation of Occupatio nal Standards Set-up more Vocational Training facilities and Communit y colleges to impart skills that improve jobreadiness Promote Innovation and Ideation in Higher Education curricula Undertake a more data based decision making approach to policy 112
113 Locate Demand closer to Supply bases (1/2) Issue: High regional concentration in four states and excessive focus on Tier 1 cities to establish shops As quality talent saturates especially in the traditional centers of Indian IT-BPM Industry, migration is becoming the norm This situation, combined with high attrition as result of incessant competition with other players is leading to increased manpower costs and are reducing the overall competitiveness of the Industry There thus exists a need for the organizations, to re-look at the operational centers and consider Tier 2 and 3 cities for setting up shops Such a movement can greatly benefit the organizations/industry by: Leveraging home base preference of some professionals Tapping comparatively less mobile BPO talent Providing Better quality of life with lower commute times, cost of living, pollution levels etc. Reducing costs of operation 113

114 Locate Demand closer to Supply bases (2/2) If Infrastructure and Political factors can be managed, movement to Tier 2 cities can prove to be a game changer for the Indian IT-BPM Industry in the current decade A NASSCOM and AT Kearney report categorized 50 Indian cities on a scale of location attractiveness into the following categories: Leaders: Bangalore, Chennai, Hyderabad, Kolkata, Mumbai, NCR, Pune Challengers: Ahmedabad, Bhubaneshwar, Chandigarh, Jaipur, Madurai etc. Followers: Bhopal, Goa, Kanpur,Surat etc. Aspirants: Allahabad, Gangtok, Ludhiana etc. Recent moves by the government suggest that it is supporting this movement in policy by encouraging SEZs in Tier 2 and 3 cities. The Industry must now play its part in contributing to the development of these cities and attempting to develop and capture local pool in these cities 114


115 The industry should change its positioning from service-based industry to a product based industry Issue: Need to increase revenue per employee contribution 115
116 Promote Innovation and Ideation in Higher Education curricula(1/2) Supply of Post Graduates and PhDs is extremely low Issue: Insufficient PG and PhD/M. Phil talent pool Currently, the Industry is churning out a mere ~25,000 PhDs and ~500,000 PGs. Of every 1000 candidates who enroll in Primary Education only ~13 reach the PG stage and ~1 reaches Doctorate education Drop in Talent Enrolment Post RTE implementation there has been a remarkable improvement in GERs for Primary and Secondary Education. The Government now needs to ensure that these benefits also reach out to the higher education sector 120% 100% 80% 60% 40% 20% 0% 100% 79% Class I 64% Class V Class VIII Class X Class XII 49% India 30% 12% Graduates (incl. Diploma courses) PG Doctorates 1.27% 0.07% 116


117 Promote Innovation and Ideation in Higher Education curricula(2/2) Supply of Post Graduates and PhDs is extremely low Education policy level changes are required to ensure that the supply in these areas increases leading to an increase in Innovation and Research facilities in India 117
118 Execute Focused Skill Development Initiatives based on the foundation of Occupational Standards(1/2) Issue: Extremely low employability rates for both Engineering and non- Engineering graduates It is a well accepted fact that the quality of skills imparted is highly inconsistent across the different institutes in the Supply Ecosystem While India is churning out huge numbers of Engineers every year, their quality is now starting to be heavily questioned There is thus a need for skill development, both in the formal as well as non-formal Educational system to bridge the employability gap We recommend that these skill development initiatives be based on Occupational Standards In the short term, the Vocational Training providers should develop fast track training programs to impart right skills that make students job ready In the medium to long term OS should lead to redesign of curricula in the Indian Higher Education System 118


119 Execute Focused Skill Development Initiatives based on the foundation of Occupational Standards(2/2) Both Public and Private participation should be encouraged to ensure skill development happens at a fast rate 119

120 Occupational Standards (OS) developed by SSC organisations for all industry sectors to facilitate cross-industry movements 22 high-growth sectors identified by NSDC for skill development, most of them are clients/industry verticals of IT-BPM industry 120
121 Set-up more Vocational Training facilities and Community colleges to impart job-readiness skillsets(1/2) Issue: Low Graduate Employability Ratios indicate that talent is available in quantity but not quality Research conducted by NSSO for the ILO shows 48 percent of employers reported having difficulty in filling jobs Another research conducted by IMaCs and NSDC, showed that there exists a growing need to increase employability by implementing skill development programs by offering strong market linkages, specialized skill development, continuation of learning etc. It also goes on to identify a need for a strong system where Vocational Skill Building is imparted as a part of Education 121
 National Policy on Skills Development Vocational Training largely offered through ITIs and ITCs")

122 Set-up more Vocational Training facilities and Community colleges to impart job-readiness skillsets (2/2) National Policy on Skills Development Vocational Training largely offered through ITIs and ITCs falls under the ambit of MoLE through the Directorate General of Education and Training (DGET) The DGET must ensure the implementation of the National Policy through the State Governments and their agencies 122
 Issue:")

123 Undertake a more data based decision making approach to policy (1/2) Issue: Lack of structured information and analysis around Talent demand- Supply situation 123
124 Undertake a more data based decision making approach to policy(2/2) Following additional analysis are recommended based on the preliminary findings of this report Primary research on employment and employability of school pass-outs (NVEQF Level 1-3) Talent Demand-Supply analysis drilled-down to the level of occupation and job-role Mobility studies indicating percentage of talent moving to Ties 1 cities for employment in IT-BPM Industry 124
125 Contents Executive Summary Demand-Supply Ecosystem Analysis of Current and Future Demand and Supply of Talent Appendix Region-wise Sub-sector/Occupation wise Diversity Skill Gaps and Challenges Recommendations 125
126 Contents Executive Summary List of Appendices Demand-Supply Ecosystem Analysis of Current and Future Demand and Supply of Talent Appendix A: State Profiles Appendix Region-wise B: Qualitative skill gaps by sub-sector Appendix Sub-sector/Occupation C:Analysis of Talent wise Demand-Supply gaps by Regions Appendix Diversity D: Definitions used in the report Skill Gaps and Challenges Recommendations 126
127 Contents Executive Summary Demand-Supply Ecosystem Analysis of Current and Future Demand and Supply of Talent Region-wise Appendix A State Profiles State Sub-sector/Occupation wise Analysis of wise Talent Supply Enrollment Diversity in Streams and Availability across levels Skill Gaps and Challenges Recommendations 127
128 128
129 129
130 130

131 131
132 132
133 133
134 134

135 135
136 136
137 137
138 138
139 139
140 140
141 141
142 142

143 143
144 144
145 145
146 146
147 147
148 148
149 149
150 150
151 151
152 152
153 Contents Executive Summary Demand-Supply Ecosystem Appendix B Analysis of Current and Future Demand and Supply of Talent Skill Region-wise Gaps by Sub-sector Sub-sector/Occupation wise Diversity Skill Gaps and Challenges Recommendations 153
154 Technical Skills in Demand Today: IT Services Sub-Sector More than 50% of Organizations consider Java & Testing skills to be most sought after 154
155 Technical Skills in Demand in Future: IT Services Sub-Sector More than 50% of Organizations consider Java and. NET Framework to be high demand skill areas in future 155
156 Skill Gaps in IT Services Sub-sector (1/2) More than a third of the organizations feel that there exists a skill gap for Cloud Computing, Java, Testing, Software Development Lifecycle and DBMS 156
157 Skill Gaps in IT Services Sub-sector (2/2) More than 60% of organizations observe a need to improve Communication and Problem solving skills of the workforce 157
158 Technical Skills in Demand Today: BPM Sub-sector About 50 % of Organizations consider MS Office and.net Framework skills to be most sought after 158
159 Technical Skills in Demand in Future: BPM Sub-sector About 50% of Organizations consider MS Office to be high demand skill areas in future 159
160 Skill Gaps in BPM Sub-sector (1/2) More than a third of the organizations feel that there exists a skill gap for skills in MS Office, Java, SQL and Cloud Computing 160
161 Skill Gaps in BPM Sub-sector (2/2) More than 70% of organizations observe a need to improve communication skills of the workforce 161
162 Technical Skills in Demand Today: Engg. and R&D Sub-sector More than 60 % of Organizations consider Java, C++ and Testing skills to be most sought after 80% 70% 60% 50% 40% 30% 20% 10% 0% JAVA C++ Testing UNIX.NET Framework C# Cloud Computing Software ASP.Net Others Oracle DBMS Data Architecture CCNA/CCNS SQL QMS Pearl Captivate SAP MS Office UG CATIA ideas Hypermesh Abaqus SAS SPSS ARIBA Nastran Ls-Dyna Adams Pam-crash RomaxDesigner KISSsoft Unigraphics Proe 162
163 Technical Skills in Demand in Future: Engg. And R&D Sub-sector More than 50% of Organizations consider Java, Testing and C++ to be high demand skill areas in future 70% 60% 50% 40% 30% 20% 10% 0% JAVA Testing C++ UNIX.NET Framework Cloud Computing C# Data Architecture DBMS Software Others ASP.Net CCNA/CCNS SQL MS Office Pearl Oracle QMS SAS SAP UG CATIA ideas Hypermesh Abaqus SPSS ARIBA Captivate Nastran Ls- Dyna Adams Pam-Crash Romax-Designer KISSsoft Unigraphics Proe 163
164 Skill Gaps in Engg. And R&D Sub-sector (1/2) More than a third of the organizations feel that there exists a skill gap for Software Development Cycle, UNIX, C++, C# and Cloud Computing 60% 50% 40% 30% 20% 10% 0% Software UNIX C++ C# Cloud Computing JAVA Data Architecture Others Testing.NET Framework ASP.Net Oracle DBMS QMS MS Office Pearl SQL SAP CCNA/CCNS SAS ARIBA UG CATIA ideas Hypermesh Adams Captivate SPSS Nastran Abaqus Ls-Dyna Pam-crash RomaxDesigner KISSoft Unigraphics Proe 164
165 Skill Gaps in Engg. and R&D Sub-sector (2/2) More than 60% of organizations observe a need to improve communication skills of the workforce 90% 80% 70% 60% 50% 40% 30% 20% 10% 0% 165
166 Technical Skills in Demand Today: Software Products Sub-sector About 70 % of Organizations consider Java skills to be most sought after, Another 60 % consider Testing skills to be important 80% 70% 60% 50% 40% 30% 20% 10% 0% JAVA Testing.NET Framework ASP.Net DBMS SQL C++ C# Software UNIX Cloud Computing Oracle Data Architecture Others MS Office CCNA/CCNS Pearl SAS QMS Captivate SAP SPSS ARIBA UG CATIA ideas Hypermesh Nastran Abaqus Ls-Dyna Adams Pam-crash RomaxDesigner KISSsoft Unigraphics Proe 166
167 Technical Skills in Demand in Future: Software Products Sub-sector More than 50% of Organizations consider Java and Cloud computing to be high demand skill areas in future 70% 60% 50% 40% 30% 20% 10% 0% JAVA Cloud Computing.NET Framework Testing ASP.Net C# SQL Software DBMS Data Architecture C++ UNIX Oracle SAS Others CCNA/CCNS SAP MS Office QMS Pearl Captivate SPSS ARIBA UG CATIA ideas Hypermesh Nastran Abaqus Ls- Dyna Adams Pam-Crash Romax-Designer KISSsoft Unigraphics Proe 167
168 Skill Gaps in Software Products Sub-sector (1/2) More than 50% of the organizations feel that there exists a skill gap for Cloud computing skills 60% 50% 40% 30% 20% 10% 0% Cloud Computing Software JAVA Testing.NET Framework SQL C# ASP.Net Data Architecture Oracle C++ UNIX DBMS QMS Others CCNA/CCNS SAS MS Office SAP Pearl SPSS ARIBA Captivate UG CATIA ideas Hypermesh Nastran Abaqus Ls-Dyna Adams Pam-crash RomaxDesigner KISSoft Unigraphics Proe 168
169 Skill Gaps in Software Products Sub-sector(2/2) More than 60% of organizations observe a need to improve Communication, Problem solving and Analytical Thinking skills of the workforce 90% 80% 70% 60% 50% 40% 30% 20% 10% 0% 169
170 Contents Executive Summary Demand-Supply Ecosystem Appendix C Analysis of Current and Future Demand and Supply of Talent Analysis Region-wise of Talent Demand-Supply gaps by Regions Sub-sector/Occupation wise Diversity Skill Gaps and Challenges Recommendations 170
 Delhi NCR has the")

171 Analysis of Demand-Supply : Region wise (North) Delhi NCR has the largest demand in the Northern region although Uttar Pradesh supplies most talent 171
 While Karnataka, Andhra Pradesh")

172 Analysis of Demand-Supply : Region wise (South) While Karnataka, Andhra Pradesh and Tamil Nadu continue to be the Big 3 - Kerala is emerging as the new destination 172


173 Analysis of Demand-Supply : Region wise (West) While Maharashtra continues to lead both demand and supply, Gujarat is emerging as the new centre for IT-BPM Industry in the West region 173
")

174 Analysis of Demand-Supply : Region wise (East) Odisha and West Bengal have large potential of growth 174
 The Central region is extremely")

175 Analysis of Demand-Supply : Region wise (Central) The Central region is extremely supply heavy although it is not the preferred location for Indian IT-BPM Industry 175
IT & ITeS AUGUST For updated information, please visit
 1 Contents Advantage India Market overview and trends Growth drivers Opportunities Success story: Infosys Useful information 2 Advantage India Growing demand Strong growth in export demand from new verticals
IT & ITeS MARCH For updated information, please visit
 1 Contents Advantage India Market overview and trends Growth drivers Opportunities Success story: Infosys Useful information 2 Advantage India Growing demand Strong growth in export demand from new verticals
BPM Sub-sector: at a glance
 BPM Sub-sector: at a glance Business Process Management (BPM) sub-sector deals with the management of one or more business processes by an external organisation that, in turn, owns and manages the selected
Discussion with Madan Padaki
 Discussion with adan Padaki Chief Executive Officer, erittrac Services. adan Padaki is the Co-Founder & CEO of erittrac Services. erittrac, an investee company of anipal Education Group (EG), is India's
Preliminary Study. Corporate Services Segment. IT-BPO Industry
 Preliminary Study for the Corporate Services Segment of the IT-BPO Industry Caesar Parlade 3 April 2013 A Report on the CSS Survey, Focus Group Discussions, and the 14 November 2012 Workshop By George
TeamLease Services Limited Investor presentation August Putting India to work
 TeamLease Services Limited Investor presentation August 2016 Putting India to work Safe Harbor Certain statements in this release concerning our future growth prospects are forward-looking statements,
INDIA S BPO/ITeS industry saw sluggish hiring in Jan-Jun
 BPO/ITeS Talent demand rise in BPO/ITeS sales, QC and customer support INDIA S BPO/ITeS industry saw sluggish hiring in Jan-Jun 2016, witnessing a drop of 1 per cent in this period. The IT-BPM sector continued
Progress and Potential of Horticulture in India
 Ind. Jn. of Agri.Econ. Vol.63, No.3, July-Sept. 2008 SUBJECT I TRIGGERING AGRICULTURAL DEVELOPMENT THROUGH HORTICULTURE CROPS Progress and Potential of Horticulture in India Ramesh Chand, S.S. Raju and
Introduction. Aspiring Minds' National Trainers' Skills Report 2
 Introduction Vocational trainers play a pivotal role in reducing the skill gap that exists in vocational sectors by imparting training and development to new recruits. Therefore, it becomes imperative
Forest Cover and Forest Area
 Forest Cover and Forest Area Chapter 3 FOREST COVER AND FOREST AREA The term 'Forest Area' (or recorded forest area) generally refers to all the geographic areas recorded as forest in government records.
Workshop on The NCAER 2018 State Investment Potential Index N-SIPI 2018
 Workshop on The NCAER 2018 State Investment Potential Index N-SIPI 2018 The NCAER Study Team August 3, 2018 1 Structure of Presentation 1. Background and scope of project 2. The six pillars of N-SIPI 3.
NABARD Consultancy Services Private Limited (An ISO 9001:2008 Company) A Wholly owned subsidiary of NABARD
 A Wholly owned subsidiary of NABARD") NABARD Consultancy Services Private Limited (An ISO 9001:2008 Company) A Wholly owned subsidiary of NABARD NABARD Consultancy Services Private Limited, a wholly owned subsidiary of NABARD, invites online
NABARD Consultancy Services Private Limited (An ISO 9001:2008 Company) A Wholly owned subsidiary of NABARD NABARD Consultancy Services Private Limited, a wholly owned subsidiary of NABARD, invites online
Soil Health Management in India
 Soil Health Management in India Soil Health Management in India Soil Health Management In order to improve the soil health of the Indian soils, gov- The nature and extent of deficiencies of nutrients in
Concept Note Occupational Standards (OS)
") Concept Note Occupational Standards (OS) IT-ITES Sector Skills Council, NASSCOM 4E-Vandana Building (4th Floor) 11, Tolstoy Marg,New Delhi-110001. T +91 11 41519230/60 F +91 11 41519240 Table of Contents
Concept Note Occupational Standards (OS) IT-ITES Sector Skills Council, NASSCOM 4E-Vandana Building (4th Floor) 11, Tolstoy Marg,New Delhi-110001. T +91 11 41519230/60 F +91 11 41519240 Table of Contents
Global Indirect Procurement BPO Market Size, Status and Forecast
 Report Information More information from: https://www.wiseguyreports.com/reports/3520849-global-indirect-procurement-bpo-market-size-statusand-forecast-2018-2025 Global Indirect Procurement BPO Market
OCCUPATIONAL STRUCTURE OF RURAL FEMALES IN INDIA AFTER GLOBALIZATION. Simta Rani. Abstract
 OCCUPATIONAL STRUCTURE OF RURAL FEMALES IN INDIA AFTER GLOBALIZATION Simta Rani Research Scholar, Babasaheb Bhimrao Ambedkar University, A central University, Lucknow. Department of Economics, School for
Capacity Building Scheme
 Capacity Building Scheme NeGP Round Table Conference 29 th- 31 st July 2009 By Krishnan, Principal Consultant, PMU, DIT, GOI Contents 1 2 3 4 Background - Capacity Building Scheme Current Status of Activities
In this Presentation
 1 In this Presentation Current Scenario Employer Satisfaction Quotient Why Industry Academia Linkage? How industry Academia linkage will help? FICCI Story NKFH Its working Model Bridging Skill Gap in Healthcare
Confederation of Indian Industry. Opportunities in. Fisheries. Sector in India. Ministry of Food Processing Industries. Government of India
 Confederation of Indian Industry Opportunities in Fisheries Sector in India Ministry of Food Processing Industries Government of India Advantage India One of the fastest growing economies in the world
Appendix A. This is an appendix of the report. Fuelling the Transition
 Appendix A This is an appendix of the report Fuelling the Transition from Prayas (Energy Group) and Prayas (Health Group) available at http://www.prayaspune.org/peg/publications/item/376 Amamo½, D$Om,
Occupational Analysis for ITS, BPM, ERD & SPD. Executive Summary
 Occupational Analysis for ITS, BPM, ERD & SPD Executive Summary IT-BPM Industry: growth potential The IT-BPM industry is the fastest growing industry, not only in India but across the world, providing
Safe Water Network is recognized as a National Key Resource Center by the Ministry of Drinking Water and Sanitation KNOWLEDGE PARTNER GRANT PARTNER
 Safe Water Network is recognized as a National Key Resource Center by the Ministry of Drinking Water and Sanitation KNOWLEDGE PARTNER GRANT PARTNER 1 Dream of Har Ghar Jal will be realized by 2030:
SECTOR ASSESSMENT (SUMMARY): EDUCATION. 1. Sector Performance, Problems, and Opportunities
: EDUCATION. 1. Sector Performance, Problems, and Opportunities") Country Partnership Strategy: IND, 2013 2017 SECTOR ASSESSMENT (SUMMARY): EDUCATION Sector Road Map 1. Sector Performance, Problems, and Opportunities 1. India s weak human capital and skill base is a
Country Partnership Strategy: IND, 2013 2017 SECTOR ASSESSMENT (SUMMARY): EDUCATION Sector Road Map 1. Sector Performance, Problems, and Opportunities 1. India s weak human capital and skill base is a
It is not the strongest of the species that survives, nor the most intelligent, but the one most responsive to change.
 It is not the strongest of the species that survives, nor the most intelligent, but the one most responsive to change. Charles Darwin Mission Veritas will become the wind under the wings of tomorrow s
Fact Track-Power Distribution Sector in India
 June 2013 Fact Factor Report Series Copyright 2013, All rights reserved Fact Track-Power Distribution Sector in India 2 Power Distribution Sector in India- An Overview Research Base AT&C Losses Over the
2Q17 analysis KPMG.com
 Global IT-BPO outsourcing deals analysis 2Q17 analysis KPMG.com About global IT-BPO outsourcing deals analysis KPMG s Shared Services and Outsourcing Advisory (SSOA) practice publishes a quarterly analysis
INTERNATIONAL FOOD POLICY RESEARCH INSTITUTE. Page 1
 Page 1 Food and Energy Security for Development in India Ashok Gulati & Kavery Ganguly Presentation at Third IBSA Summit Academic Forum IBSA Partnership for Shared Prosperity and Inclusive Globalization
HR Connect Asia Pacific
 India s Knowledge Sector Growth Engine or Troubled Times Ahead? Organizations in the IT Business Process Management (BPM) sector will have to evolve their HR and rewards strategies to align with the rapidly
TCS Updates. Kumar Narayanan, Country Head, TCS France Serge Acito, Director, Major Markets & Strategic Projects, TCS France.
 #TCSARDay TCS Updates Kumar Narayanan, Country Head, TCS France Serge Acito, Director, Major Markets & Strategic Projects, TCS France Copyright 2012 Tata Consultancy Services Limited 1 TCS GLOBAL 2 Tata
humancapitalsolutions
 One of the leading Human Capital Solutions companies in India, Eduquity was incorporated in India in June 2000 by a group of entrepreneurs with over five decades of experience in running large organizations
3Q17 analysis KPMG.com
 Global IT-BPO outsourcing deals analysis 3Q17 analysis KPMG.com About global IT-BPO outsourcing deals analysis KPMG s Shared Services and Outsourcing Advisory (SSOA) practice publishes a quarterly analysis
ISSN: Volume 2, Issue 10, March 2016 RELEVANCE OF SKILL DEVELOPMENT IN THE INDIAN CONTEXT
 RELEVANCE OF SKILL DEVELOPMENT IN THE INDIAN CONTEXT PARMINDER KAUR Assistant Professor in Commerce G.G.N. Khalsa College, Ludhiana Email: neetugugnani@gmail.com Ph.97810-70778 ABSTRACT Skills and Knowledge
 SKILL MAP INDIA 2017 Aspiring Minds is a global job skills creden aling leader set up with a vision to create a merit driven talent ecosystem and enable efficient job skills matching by cra ing credible
Manpower in Mining Some Reflections
 Manpower in Mining Some Reflections Employment has been the biggest challenge for a country as diverse and as vast as India. The rural hinterland is a hub of diverse resources including variety of minerals.
Technology IT services
 Technology IT services Yogesh Aggarwal* Analyst HSBC Securities and Capital Markets (India) Private Limited +91 22 2268 1246 yogeshaggarwal@hsbc.co.in *Employed by a non-us affiliate of HSBC Securities
India s IT Industry in the 21 st Century: Vanguard of the Services Export Revolution
 India s IT Industry in the 21 st Century: Vanguard of the Services Export Revolution ICRIER-KAS Seminar 14 June, 2012 Som Mittal President, NASSCOM NASSCOM: Driving thought leadership and collaboration
A COMPARATIVE STUDY OF MARGINAL FARMS IN INDIA VIS-A-VIS WEST BENGAL DURING LAST DECADE
 Journal of Economic & Social Development, Vol. - XIII, No. 2, Dec. 2017 A COMPARATIVE STUDY OF MARGINAL FARMS IN INDIA VIS-A-VIS WEST BENGAL DURING LAST DECADE Amit Mandal* ISSN 0973-886X Agriculture is
Status of Poverty in India A State wise Analysis
 Status of Poverty in India A State wise Analysis Dr Waheeda Sunny Thomas Faculty Economics, SEMCOM, Gujarat, India ABSTRACT First millennium development goal is to eradicate extreme poverty and hunger.
Aajeevika - National Rural Livelihoods Mission, New Delhi
 Aajeevika - National Rural Livelihoods Mission, New Delhi Terms of Reference for Technical Selection of Training Agencies for providing Training and Capacity Building support to SRLMs Note: The outcome
Contents 1. Introduction and Contacts... P.1
 QUALIFICATIONS PACK NATIONAL OCCUPATIONAL STANDARDS FOR IT-BPM INDUSTRY Contents 1. Introduction and Contacts... P.1 What are National Occupational Standards (NOS)? NOS describe what individuals need to
Enterprise Solutions. Chandra Shekar Kakal Senior Vice President & Executive Council Member Head Enterprise Solutions
 Enterprise Solutions Chandra Shekar Kakal Senior Vice President & Executive Council Member Head Enterprise Solutions Safe Harbor Certain statements made in this Analyst Meet concerning our future growth
Confederation of Indian Industry. Opportunities in ORGANIC. Food in India. Ministry of Food Processing Industries. Government of India
 Confederation of Indian Industry Opportunities in ORGANIC Food in India Ministry of Food Processing Industries Government of India Advantage India One of the fastest growing economies in the world Largest
From Rooftops to Farmtops. Augmenting India s Distributed Solar Goals through net-metered solar pumps
 From Rooftops to Farmtops Augmenting India s Distributed Solar Goals through net-metered solar pumps Introduction The Government of India has recently announced a scheme for solar water pumps known as
Capital Market BPO Service Provider Profile Compendium 2016
 Capital Market BPO Service Provider Profile Compendium 2016 Banking, Financial Services, and Insurance (BFSI) Business Process Outsourcing Market Report January 2017 Preview Deck Our research offerings
IT/ITeS Certification. Presentation at World Bank SSLEV Mumbai, 9 th February,2008
 IT/ITeS Certification Presentation at World Bank SSLEV Mumbai, 9 th February,2008 About us India s Largest Skills Assessment Company Investee Company of Manipal Education Group Over 3 Million candidates
Emerging Opportunities in African BPO Markets
 Emerging Opportunities in African BPO Markets Innovation Boosts Growth in Key African Countries July 2016 Contents Section Slide Number Executive Summary 3 BPO Services Market Overview 6 Analysis of the
Market Research SKILL REQUIREMENTS AMONG YOUNG PROFESSIONALS IN INDIA
 Market Research SKILL REQUIREMENTS AMONG YOUNG PROFESSIONALS IN INDIA www.britishcouncil.in www.britishcouncil.in TABLE OF CONTENTS FOREWORD ACKNOWLEDGEMENTS 6 EXECUTIVE SUMMARY 7 RESEARCH BACKGROUND &
Growth and Inclusion: Theoretical and Applied Perspectives
 THE WORLD BANK WORKSHOP Growth and Inclusion: Theoretical and Applied Perspectives Session I Food Inflation: Drivers and Policy Implications Subir Gokarn Reserve Bank of India January 12, 212 The Claridges
Parliament of India for SSC & Bank Exams - GK Notes in PDF
 Parliament of India for SSC & Bank Exams - GK Notes in PDF We all know that India is a democratic country and the Parliament of India is the highest legislative body of India. By and large, the Indian
BIBLIOMETRIC ANALYSIS OF ANNALS OF LIBRARY AND INFORMATION STUDIES ( )
") BIBLIOMETRIC ANALYSIS OF ANNALS OF LIBRARY AND INFORMATION STUDIES (2004-2013) ABSTRACT IMRAN KHAN Librarian Zakir Husain Delhi College (University of Delhi) Jawaharlal Nehru Marg New Delhi-110002 e-mail:
BIBLIOMETRIC ANALYSIS OF ANNALS OF LIBRARY AND INFORMATION STUDIES (2004-2013) ABSTRACT IMRAN KHAN Librarian Zakir Husain Delhi College (University of Delhi) Jawaharlal Nehru Marg New Delhi-110002 e-mail:
Comparative Study of Marginal Farms in India vis-a-vis West Bengal; Evidences from Last Decade
 Economic Affairs, Vol. 61, No. 4, pp. 589-598, December 2016 DOI: 10.5958/0976-4666.2016.00073.5 2016 New Delhi Publishers. All rights reserved Comparative Study of Marginal Farms in India vis-a-vis West
Implementation and Feedback. 10 th April 2018
 1 37 10 18 18 Implementation and Feedback 2 10 th April 2018 3 State/UT wise Status : Phase-I State Districts M App Trans Master Trainer A & N ISLANDS 1 269 ANDHRA PRADESH # 10 3616 NA ARUNACHAL PRADESH
Santosh Mehrotra Prof of Economics, Centre for Labour Studies, Jawaharlal Nehru University, New Delhi
 Santosh Mehrotra Prof of Economics, Centre for Labour Studies, Jawaharlal Nehru University, New Delhi santoshmeh@gmail.com 1 1. Trends in employment and its structure Statewise trends 2. What explains
E-Recruitment Process
 IJIRST National Conference on Networks, Intelligence and Computing Systems March 2017 E-Recruitment Process Dr.J.Shanthini 1 M.Akila 2 A.Dhanashree 3 P.Janani 4 C.M.Lekshmi 5 1 Assistant Professor 2,3,4,5
Life and Pensions Insurance BPO Service Provider Profile Compendium 2015
 Life and Pensions Insurance BPO Service Provider Profile Compendium 2015 Banking, Financial Services, and Insurance (BFSI) Business Process Outsourcing Market Report: February 2016 Preview Deck Our research
The automobile industry saw a stable hiring trend
 AUTOMOBILE Engineering graduates with design and software skills in demand The automobile industry saw a stable hiring trend during Jan-Jun 2016. May witnessed the maximum rise in talent demand (14 per
Banking BPO Service Provider Profile Compendium
 Banking BPO Service Provider Profile Compendium Banking, Financial Services, and Insurance (BFSI) Business Process Outsourcing Market Report January 2017 Preview Deck Our research offerings for global
India s Growth and Poverty Reduction Experience: Facts and Conjectures. Timothy Besley, LSE
 India s Growth and Poverty Reduction Experience: Facts and Conjectures Timothy Besley, LSE In this presentation, I am going to look at the growth experience of India using cross-state data from the sixteen
State wise analysis of RPO Regulation for Captive users
 State Regulation for Captive Users Definition of renewable Energy as per the commission order Remarks Andhra Pradesh Every consumer owning a captive generating plant of installed capacity of one (1) MW
Contents 1. Introduction and Contacts... P.1
 Qualifications Pack For IP Executive QUALIFICATIONS PACK NATIONAL OCCUPATIONAL STANDARDS FOR IT-BPM INDUSTRY Contents 1. Introduction and Contacts... P.1 What are National Occupational Standards (NOS)?
Accenture Services Private Limited Corporate Social Responsibility (CSR) Policy
 Policy") Accenture Services Private Limited Corporate Social Responsibility (CSR) Policy Accenture Services Private Limited Corporate Social Responsibility (CSR) Policy Introduction and Background Accenture is
Accenture Services Private Limited Corporate Social Responsibility (CSR) Policy Accenture Services Private Limited Corporate Social Responsibility (CSR) Policy Introduction and Background Accenture is
Analysis of Campus Recruitment Parameters in an Indian Context
 Analysis of Campus Recruitment Parameters in an Indian Context Dr. V.Samuel Rajkumar Director(Placement and Training),VIT University, Vellore, Tamil Nadu, India Email:sam.rajkumar@vit.ac.in Dr. R. Prabhakara
Retail Banking BPO State of the Market with PEAK Matrix Assessment 2016: Analytics and Innovation at the Forefront in Challenging Times
 Retail Banking BPO State of the Market with PEAK Matrix Assessment 2016: Analytics and Innovation at the Forefront in Challenging Times Banking, Financial Services, and Insurance (BFSI) Outsourcing Market
has taken place in western and south-western states, whereas crop specialization has occurred
 Trans. Inst. Indian Geographers Joydeep Saha, New Delhi agricultural economy in terms of income, employment and security. Obtaining required secondary data on area under crops, this paper attempts to explore
INFOSYS TECHNOLOGIES LTD INDIA ANALYST MEET AUG 27, 2008 CHENNAI ENTERPRISE SOLUTIONS SESSION 1
 INFOSYS TECHNOLOGIES LTD INDIA ANALYST MEET AUG 27, 2008 CHENNAI ENTERPRISE SOLUTIONS SESSION 1 Mr. Welcome to the session on the enterprise solutions practice. Today, I will in the next few minutes take
Performance of IT and ITEs Industry in Indian Economy
 Performance of IT and ITEs Industry in Indian Economy Meenu Ph. D Scholar, Department of Commerce, MDU, Rohtak ABSTRACT Today, among various sectors of the economy IT and ITEs sector is one whose services
TMI PHARMA CAPABILITIES
 TMI PHARMA CAPABILITIES 1 Index 2 Pharma Industry Overview Job Board Analysis TMI Pharma Capabilities TMI Experience TMI Insights TMI Differentiators Methodology Process Screenshots About TMI RPO An Overview
State Service Delivery Gateway (SSDG), e-forms, State Portal (SP): An Approach to Access the Services by Citizens under a Single Interface Mechanism
, e-forms, State Portal (SP): An Approach to Access the Services by Citizens under a Single Interface Mechanism") State Service Delivery Gateway (SSDG), e-forms, State Portal (SP): An Approach to Access the Services by Citizens under a Single Interface Mechanism 1. Ms. Poonam Malik 2. Ms. Anisha Tandon Research scholar
State Service Delivery Gateway (SSDG), e-forms, State Portal (SP): An Approach to Access the Services by Citizens under a Single Interface Mechanism 1. Ms. Poonam Malik 2. Ms. Anisha Tandon Research scholar
MEMBERS' REFERENCE SERVICE LARRDIS LOK SABHA SECRETARIAT, NEW DELHI LEGISLATIVE NOTE. No.47/LN/Ref./November/2017
 MEMBERS' REFERENCE SERVICE LARRDIS LOK SABHA SECRETARIAT, NEW DELHI LEGISLATIVE NOTE No.47/LN/Ref./November/2017 For the use of Members of Parliament NOT FOR PUBLICATION 1 THE ANCIENT MONUMENTS AND ARCHAEOLOGICAL
MSME Success Lies on Skill. And Testing Infrastructure Development. Presented by: Mr Vinod Simon Chairman, RSDC
 MSME Success Lies on Skill And Testing Infrastructure Development Presented by: Mr Vinod Simon Chairman, RSDC Micro, Small and Medium Enterprises (MSMEs) Micro, Small and Medium Enterprises (MSMEs) play
ARE DISPARITIES IN INDIAN AGRICULTURE GROWING?
 ARE DISPARITIES IN INDIAN AGRICULTURE GROWING? Indian agriculture has witnessed tremendous changes during the last 3 decades following the adoption of green revolution technology during late 1960's The
Finance Specialization
 Finance Specialization The Finance Specialization imparts knowledge to the students by offering courses that are essential in building comprehensive contemporary knowledge in finance, besides building
Global Infrastructure Outsourcing Market
 Global Infrastructure Outsourcing Market 2015-2019 Global Infrastructure Outsourcing Market 2015-2019 Sector Publishing Intelligence Limited (SPi) has been marketing business and market research reports
India s Positioning in the Global Fertilizer Industry
 Market Update Kg/Hectare Arable Land India s Positioning in the Global Fertilizer Industry Country-Wise Consumption of Fertilizers 8,000 7,000 6,000 5,000 4,000 3,000 2,000 1,000-6898.7 2759.6 1750 157.52
Retail Analytics Market Research Report- Global Forecast 2023
 Report Information More information from: https://www.marketresearchfuture.com/reports/3075 Retail Analytics Market Research Report- Global Forecast 2023 Report / Search Code: MRFR/ICT/2229-HCRR Publish
Evolving Skills IT-BPM Industry. Penny Bongato Executive Director Talent Development
 Evolving Skills IT-BPM Industry Penny Bongato Executive Director Talent Development US$ Billions FTEs ('000) 50 40 30 20 10 0 Revenue 1,250 1,146 1,044 958 858 777 640 527 8.9 11.0 13.2 15.8 18.0 20.5
Confederation of Indian Industry. Opportunities in. Ministry of Food Processing Industries. Government of India
 Confederation of Indian Industry Opportunities in DAIRY Sector in India Ministry of Food Processing Industries Government of India Advantage India One of the fastest growing economies in the world Largest
MSMEs IN ECONOMIC DEVELOPMENT - A CASE STUDY OF SHIMOGGA AREA
 MSMEs IN ECONOMIC DEVELOPMENT - A CASE STUDY OF SHIMOGGA AREA Appasaba L. V. 1, Kiran.G 2 and Dr. A. M. Kadakol 3 1 Research Scholar, Department of MBA, Kuvempu University, Shankaraghatta, India Email:meappu6877@gmail.com
Chapter-II. 2.0 Definition of terms. 2.1BPO in India
 15 Chapter-II 2.0 Definition of terms 2.1BPO in India Business process outsourcing otherwise known as BPO is the process of leveraging technology vendors in various third worlds or developing nations for
INTERVIEW OF THE MONTH 100
 INTERVIEW OF THE MONTH 100 August 2012 INTERVIEW WITH: Ms. Geeta Jain Chief Executive Officer- Carlson Wagonlit Travel India - By Dhruv Chadha Ms Geeta Jain is the Chief Executive Officer for Carlson Wagonlit
Criteria for Assessment of Trainees QUALIFICATIONS PACK NATIONAL OCCUPATIONAL STANDARDS FOR IT-BPM INDUSTRY. OCCUPATION: Application Development
 ec Criteria for Assessment of Trainees QUALIFICATIONS PACK NATIONAL OCCUPATIONAL STANDARDS FOR IT-BPM INDUSTRY What are National Occupational Standards(NOS)? NOS describe what individuals need to do, know
Irrigation Market in India
 Now Available Irrigation Market in India Programmes and Projects: Opportunities for Construction and Equipment Report (PDF) Data-set (Excel) India Infrastructure Research Irrigation Market in India Table
MEMBERS' REFERENCE SERVICE LARRDIS LOK SABHA SECRETARIAT, NEW DELHI REFERENCE NOTE. No.56/RN/Ref./Nov/2017
 MEMBERS' REFERENCE SERVICE LARRDIS LOK SABHA SECRETARIAT, NEW DELHI REFERENCE NOTE No.56/RN/Ref./Nov/2017 For the use of Members of Parliament NOT FOR PUBLICATION 1 DAIRY SECTOR: PRESENT SCENARIO AND NEW
Regional Pattern of Agricultural Growth and Rural Employment in India: Have Small Farmers Benefitted?
 Agricultural Economics Research Review Vol. 26 (Conference Number) 2013 pp 1-11 Regional Pattern of Agricultural Growth and Rural Employment in India: Have Small Farmers Benefitted? M.L. Nithyashree* and
Facts of PAT Cycle 1 & 2. A Bicon Consultants Report. Bicon Report 12/30/16 Energy Knowledge Hub
 Facts of PAT Cycle 1 & 2 A Bicon Consultants Report Bicon Report 12/30/16 Energy Knowledge Hub About Bicon Consultants: bicon Bicon Consultants is a Chartered Engineering firm, accredited by BEE as an
QUALIFICATIONS PACK - OCCUPATIONAL STANDARDS FOR IT-ITeS INDUSTRY. SUB-SECTOR: Engineering and R&D. OCCUPATION: Product Marketing
 QUALIFICATIONS PACK - OCCUPATIONAL STANDARDS FOR IT-ITeS INDUSTRY Contents 1. Introduction and Contacts.......P.1 2. Qualifications Pack....P.2 3. Glossary of Key Terms.......P.3 4. NOS Units...P.5 OS
Capital Markets BPO Service Provider Profile Compendium
 Capital Markets BPO Service Provider Profile Compendium BFSI BPO Market Report: January 2015 Preview Deck Our research offerings for global services Subscription information The full report is included
National Vegetable Initiative for Urban Clusters. Value chain integration, technology dissemination and accessing investments and markets
 National Vegetable Initiative for Urban Clusters Value chain integration, technology dissemination and accessing investments and markets Progress and Prospects Vegetable Initiative for Urban Clusters FPO
COMPENDIUM REGULATIONS & TARIFF ORDERS ISSUED BY REGULATORY COMMISSIONS FOR RENEWABLE ENERGY SOURCES IN INDIA
 COMPENDIUM OF REGULATIONS & TARIFF ORDERS ISSUED BY REGULATORY COMMISSIONS FOR RENEWABLE ENERGY SOURCES IN INDIA IREDA MINISTRY OF NEW AND RENEWABLE ENERGY INDIAN RENEWABLE ENERGY DEVELOPMENT AGENCY LTD.
Cellulosic Ethanol Emerging Opportunities in India Feb 2015
 Cellulosic Ethanol Emerging Opportunities in India Feb 2015 Safe Harbor Statement This presentation and its related comments contain forwardlooking statements, including financial expectations. Forward-looking
Dynamics and Performance of Livestock and Poultry Sector in India: A Temporal Analysis
 Volume 3, Issue 1 June 2014 1 RESEARCH ARTICLE ISSN: 2278-5213 Dynamics and Performance of Livestock and Poultry Sector in India: A Temporal Analysis M. Borah* and R.A. Halim Dept. of Agricultural Economics
Contents 1. Introduction and Contacts... P.1
 QUALIFICATIONS PACK - OCCUPATIONAL STANDARDS FOR IT-ITeS INDUSTRY Contents 1. Introduction and Contacts... P.1 2. Qualifications Pack... P.2 3. Glossary of Key Terms... P.3 4. NOS Units... P.5 5. Nomenclature
High Demand Occupations and Career Opportunities. IT-BPM Industry
 High Demand Occupations and Career Opportunities IT-BPM Industry 2016 High Demand Occupations and Career Opportunities IT-BPM Industry 2016 Copyright 2016 NASSCOM 4E-Vandana Building (4th Floor) 11, Tolstoy
Draft Document on Structure and Tasks of State Health Agency for Implementing PMRSSM in Trust Mode
 Draft Document on Structure and Tasks of State Health Agency for Implementing PMRSSM in Trust Mode In order to facilitate the effective implementation of the PMRSSM, the State Government shall set up the
Agrarian Stagnation in Eastern Gangetic Plains. Avinash Kishore IFPRI, New Delhi
 Agrarian Stagnation in Eastern Gangetic Plains Avinash Kishore IFPRI, New Delhi Agriculture is stagnant across India 17500 AgGDP of India (2011-12 billion rupees) 17000 16500 CAGR = 2.32% 16000 15500 15000
Contents 1. Introduction and Contacts... P.1
 QUALIFICATIONS PACK NATIONAL OCCUPATIONAL STANDARDS FOR IT-BPM INDUSTRY Contents 1. Introduction and Contacts... P.1 2. Qualifications Pack... P.2 3. Glossary of Key Terms... P.3 4. NOS Units... P.5 5.
Role Type Pay Band Location Duration Reports to:
 Role Title Head Arts North India Role Information Role Type Pay Band Location Duration Reports to: Business, partnership and Programme development 7 Delhi Indefinite Assistant Director - Programmes Role
Cambridge International Examinations Cambridge Ordinary Level
 Cambridge International Examinations Cambridge Ordinary Level *3337806662* GEOGRAPHY 2217/12 Paper 1 October/November 2015 Candidates answer on the Question Paper. Additional Materials: Ruler Calculator
SERVICES. World s leading INFORMATION SERVICES. operational excellence GLOBAL SHARED SERVICES CLIENT BACKGROUND
 World s leading leading World s GLOBAL INFORMATION INFORMATION SERVICES SERVICES GLOBAL company achieves achieves cost cost optimization optimization and and company operational excellence excellence through
Forfás / EGFSN Study: Addressing the Demand for High-Level ICT Skills across all Sectors of the Economy in Ireland. November 2013
 Forfás / EGFSN Study: Addressing the Demand for High-Level ICT Skills across all Sectors of the Economy in Ireland November 2013 Background Aim of the Study undertaken by Forfás / EGFSN, is to assess the