Measurement Systems Analysis
|
|
|
- Douglas Osborne
- 6 years ago
- Views:
Transcription
1 Measurement Systems Analysis Components and Acceptance Criteria Rev: 11/06/2012
2 Purpose To understand key concepts of measurement systems analysis To understand potential sources of measurement error and its affect on both process and part quality
3 Why Do We Care About Measurement Systems Analysis (MSA)? Ensures measurement is accurate and precise Eliminates false data that can impact decisions about the process Provides information about the gage(s) being used to evaluate our parts and processes Reduces risk in calling good parts bad (Type I Error) **Impacts internal throughput, scrap and rework Reduces risk in calling bad parts good (Type II Error) **Impacts customer Data you can trust = Good Decisions
4 Which line has less variation? Line 1 Line 2
5 Which line has less variation? Line 1 Line 2 Gage Variation Total Variation
6 Which line has less variation? Line 1 Line 2 Part Variation Line 2 has Less variation Part Variation + Gage Variation Gage Variation = Total Variation Total Variation (Observed)
7 Understanding Variation Part Variation + Gage Variation = What is the best course of action? Assume the total observed variation is below 1.33 Ppk for an initial process study on a starred dimension (1.67 Ppk or greater required) A. Measure a different sample of parts (Gather more data) B. Investigate process changes to reduce process variation C. Investigate gage changes to reduce measurement variation Total Variation (Observed)
8 How do you decide what to do? What are typical reactions to measuring a part out of tolerance? Adjust processes / implement additional detection methods Quarantine / Sort / Scrap parts Review PFMEAs and Control Plans Before doing all this verify the measurement system
9 MSA Components What does a measurement system analysis consist of?
10 MSA Components Resolution (Discrimination) Accuracy Linearity Stability Repeatability (Test / Retest) Reproducibility Gage R&R
11 Sources of Variation Location of the Measurements Accuracy / Bias Stability Linearity Variation of Measurement Repeatability Reproducibility Resolution / Discrimination Each source of variation can result in incorrect measurements

12 Resolution Can the gage detect change? Which logo below is larger? How is the measurement different?
13 Resolution - Response Select gages that have greater levels of discrimination (smaller increments) Record all measurement data, i.e. if a gage measures to 3 decimal points record all three As a general rule gage discrimination should be 1/10 th of the product tolerance Product tolerance: Gage tolerance: (Recommended minimum)
14 Accuracy What is accuracy? The difference between the measured average value and the master value or the Shift from True value The master value needs to come from a traceable measurement source (ex. CMM) Although accuracy and bias are often used interchangeably it is best practice to refer to this difference in values as bias
 Measured values In this")

15 Accuracy What is accuracy? Master value (reference standard) Measured values In this case the accuracy of the gage is bias by 0.5 above the master Let s also assume the average measurement is 5.5 Let s assume the master value is 5
16 How to Determine Bias Take three samples Ideally these samples would be at the high, middle and low ends of the process Determine the reference value for each sample using a traceable measurement method (CMM, calibrated height gage, etc.) Measure each sample at least 10 times. Calculate the average and subtract from the reference value Determine if the accuracy is acceptable or needs to be corrected This is to be determined by the working team

17 Bias Example Note: With multiple samples a linearity study may be completed
18 Potential Bias Causes Gage needs calibration Worn gage, equipment or fixture Error in master part (worn or damaged) Improper setting of master in gage Differing measurement methods (set, loading, clamping, technique, etc.) Environment (temperature, humidity, vibration, cleanliness, etc.)
19 Bias - Response Increase calibration schedule Implement gage operating instructions Verify gage was made to correct specifications Check gage for wear Cleaning of gage Evaluate gage environment
20 Linearity What is linearity? Linearity is the change in bias across the operating range of the gage
21 Measured Average Value Linearity Bias (Difference between the measured average value and the master value) No Bias (Master value equals measured average value) Note the bias and increasing variance Full Range of Gage (Master Value)
22 How to Determine Linearity Pick 5 parts covering the entire product tolerance Determine reference value of each part (ex. CMM) Measure each part 10 times or more and determine averages Subtract the average values from the determined reference values and decide if linearity is acceptable


23 Linearity Calculation (Minitab) 2. Go to Stat, Quality Tools, Gage Study, Gage Linearity and Bias Study 3. Fill in column ID s for Part Number, Reference Values and Measurement Data. Don t forget to fill in the Gage Info! 1. Enter Part Number, Measurement and Reference Value in the Worksheet
24 Linearity Analysis (Minitab) However, there is significant bias (P<0.05) at 1.31 and 1.35 This gage has little bias between 1.0 and 1.2
25 Linearity - Acceptance Criteria Study must use 5 or more parts Parts must cover entire operating range of gage A p-value of less than 0.05 (P<0.05) indicates statistically significant bias
26 Linearity Response Implement correction factor / table / curve Review gage and adjust Restrict use of range (Need to consider specification limits) Verify proper calibration (through entire operating range) Verify part / fixture is not distorted with change in part size
27 Linearity Question Question: Is this linearity study acceptable? A. Yes, all points are statistically acceptable across the range B. No, at there is significant bias C. No, at and there is significant bias D. There is no bias, this is a linearity study
28 Stability What is stability? The variation in measurements obtained with the same master part(s) on a single feature over a period of time Also known as measurement drift and the change in bias over time
29 Stability Measurements taken Monday Measurements taken Friday Measurement results are changing over time. Gage is not stable
30 How to Determine Stability Select a master part Part may be a reference part (master) or a production part You can select multiple parts (low, middle and high end of expected range) and track stability for each Determine the reference value for each part via a master measurement method Measure each part 3 5 times at a chosen interval (daily, weekly, etc.) Frequency should be determined based on knowledge of the gage. If frequency is unclear you should start at a high frequency and reduce over time as deemed acceptable. Plot the ongoing data on a Xbar & R chart
31 Stability Potential Causes Calibration issues Gage wear Poor maintenance Master part damage / wear
32 Stability Response Increase frequency of calibration Increase frequency of PM Change / Adjust gage Establish life of gage or master part

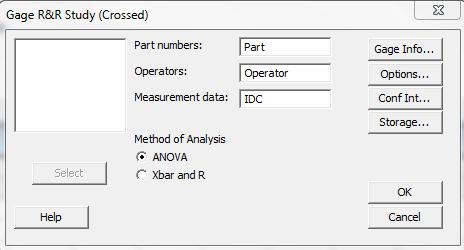
33 Stability Question The gage is not stable. Larger jumps appear to happen every other day. The team should decide how often calibration should take place. Question: Assuming the same part was measured is this gage stable? Can this gage be used? Process tolerance is 9.0/6.0 A. Yes, the process is stable. Use the gage. B. No, the gage is not stable. Do not use the gage. C. No, the gage is not stable. Develop calibration schedule and use the gage.
34 Precision What is precision? According to AIAG it is the net effect of discrimination, sensitivity and repeatability over the operating range of the measurement system. (AIAG MSA Third Edition) So what does that mean? Precision quantifies how close repeated measurements are to each other Not Precise Precise
35 Precision - Components Repeatability Best known as within user variation Also encompasses all within variation Within part Within gage Within standard Within method Within user Within environment Reproducibility Best known as between user variation Also encompasses all between variation Between systems Between conditions Between methods Between Environment
36 Precision - Components Repeatability (Within Variation) Operator 1 Operator 2 Operator 3 Reproducibility (Between Variation)
37 Variable Data GRR
38 Variable Data Gage R&R How do you conduct a Variable Gage R&R? 1. Determine the need for the study. What do you want to accomplish? %Study For process control %Tolerance For product control 2. Determine specifics about the study (number of appraisers, number of trials, etc.) 3. Select appraisers Appraisers should be selected that will used the gage in production 4. Select the sample parts to be used Based upon chosen need from study If for process control parts must be chosen from process range
39 Variable Data Gage R&R 5. Verify gage resolution is acceptable 6. Measure parts in random order to prevent measurement memory 7. The standard measurement process should be observed by all users (gage instructions) 8. The study should be observed by the engineer to ensure reliability of the data
40 Variable Data Gage R&R General Rules Three appraisers Ten parts Three measurements per part per appraiser (Ninety total measurements) Parts should make use of the entire range of process variation This does not mean the entire product tolerance A capability study should accompany a completed GRR Parts should be collected over time Parts collected in a row will usually have low between part variation Use ANOVA method if possible Xbar & R method does not account for operator interaction Report %Study or %Tolerance (whichever applies)
 Crossed is when the same parts are used between trials Nested is when")
41 Variable GRR Calculation (Minitab) 1. Enter Appraiser, Part number and Measurement in the Worksheet 2. Go to Stat, Quality Tools, Gage Study, Gage R&R Study (Crossed) Crossed is when the same parts are used between trials Nested is when different parts are used between trials

42 Variable GRR Calculation (Minitab) Fill in part number, Operators and Measurement Data and select ANOVA Complete Gage Info Click Options

43 Variable GRR Calculation (Minitab) Fill in upper and lower limits and include a title of the GRR Click OK
44 Sample Mean Average Sample Range Percent Gage R&R (ANOVA) for IDC Gage name: O GP F LA SH Date of study : 27 A pril 2012 Reported by : J C ole Tolerance: Misc: Components of Variation IDC by Part % Contribution % Study Var % Tolerance Gage R&R Repeat Reprod R Chart by Operator DK EB JC Part-to-Part UCL= Part IDC by Operator Part Xbar Chart by Operator DK EB JC _ R= LCL= DK EB Operator Part * Operator Interaction JC Part _ X= UCL= LCL= Part Operator DK EB JC
45 Sample Mean Average Sample Range Percent Variable GRR - Analysis Gage R&R (ANOVA) for IDC Gage name: O GP F LA SH Date of study : 27 A pril 2012 Reported by : J C ole Tolerance: Misc: Pay attention to the overall sample range to understand scale of error Gage R&R Components of Variation Repeat Reprod R Chart by Operator DK EB JC Part-to-Part % Contribution % Study Var % Tolerance UCL= IDC by Part Part IDC by Operator Inside the Xbar r Chart control limits is the blind spot of the gage Part Part Xbar Chart by Operator DK EB JC _ R= LCL=0 _ X= UCL= LCL= DK EB JC Operator Part * Operator Interaction Operator DK EB JC Part

46 Sample Mean Average Sample Range Percent Variable GRR - Analysis Gage R&R (ANOVA) for IDC Gage name: O GP F LA SH Date of study : 27 A pril Gage R&R Components of Variation Repeat Reprod R Chart by Operator DK EB JC Part-to-Part % Contribution % Study Var % Tolerance UCL= Reported by : J C ole Tolerance: Misc: IDC by Part 5 6 Part IDC by Operator Part to part variation should be the largest contributor R Chart should have all points in control. An out of control condition indicates poor repeatability Xbar r Chart should be 50% out of control. This indicates each operator can tell a good part from a bad part Part Part Xbar Chart by Operator DK EB JC _ R= LCL=0 _ X= UCL= LCL= DK Part EB Operator Part * Operator Interaction JC Operator DK EB JC Want: Small spread around mean Similar mean and spread by operator Lines to be close to being on top of each other
47 Variable GRR Graphical Metrics Components of Variation Indicates repeatability / reproducibility / parts Want low Gage R&R, High part to part variation R Chart Indicates repeatability / resolution No outliers are permitted, helps to I.D. unusual measurements Plateaus or steps indicate resolution limitation Xbar r Chart Reproducibility / Sensitivity Want to see similar patterns for each operator
48 Variable GRR Numerical Metrics Report %Study or %Tolerance (Whichever applies) More on this later Report number of distinct categories
49 Variable GRR Numerical Metrics %Study or %Tolerance should be below 10% Between 10% and 30% may be acceptable Above 30% is not acceptable Number of distinct categories must be at least 5
50 Why ANOVA?

51 Xbar/R GRR
52 ANOVA GRR
53 Xbar/R & ANOVA Comparison The same data was used for both studies The only difference is method used to analyze the gage WHY? The Xbar/R method ignores operator to part interaction and as a result can appear to boost gage performance
54 Xbar/R & ANOVA Comparison Xbar/R Method ANOVA Method Operator interaction is ignored using the Xbar/R method
55 Understanding %Tolerance %Tolerance is the measurement error as a percent of the product specification (tolerance) %Tolerance determines if the gage can be used for product control (determining a good part from a bad) If the gage cannot pass %Tolerance it cannot determine if a part within specification
56 Understanding %Study %Study is the measurement error as a percent of total variation (standard deviation) %Study determines if the gage can be used for process control If the gage cannot pass %Study it cannot distinguish one part from another within normal process variation or monitor process improvements / process changes
57 Specification vs. Total Variation Product Specification Total Variation
58 Outlier Effect on %Study Product Tolerance Adding an outlier will increase total variation σ observed (Total Observed Variation) This will reduce the reported %Study and can make the gage look acceptable when it really isn t
59 Outlier Effect on %Tolerance Product Tolerance Adding an outlier will not affect %Tolerance σ observed (Total Observed Variation) %Tolerance relies upon the USL-LSL in its calculation. An outlier does not affect the product specification
60 Minimizing %Study by Part Selection %Study is heavily dependent on the parts selected for the study The more variation between parts selected for the study the lower %Study will be When selecting parts be sure to include parts across the entire process variation Do not select parts outside of the process variation as this can mislead you to think the gage is better than it is
61 Part Selection for GRR %Study is a measure of how well the gage sees inside the range of parts selected. Part selection is critical %Tolerance is not affected by part selection
62 Confidence Interval and Distinct Categories Confidence Interval The actual size of a measured part can be anywhere within the confidence interval Measurement Actual Size
63 Distinct Categories Distinct categories is the number of confidence intervals (divisions) that the measurement system can accurately measure across the process variation. Also known as effective resolution (not gage resolution)
64 Distinct Categories 1 Distinct Category 2-4 Distinct Categories 5+ Distinct Categories Number of distinct categories is an indication of how well a measurement system can detect product variation Used to establish if the measurement system has acceptable resolution (discrimination)
65 Confidence Interval and Distinct Categories Confidence Interval surrounding a measurement Number of Distinct Categories is roughly four Looking at the measurements what is your estimate of the number of distinct categories? Conceptually the number of distinct categories is equal to the number of confidence intervals that span the distribution
66 When to Report %Tolerance There are cases when you want to report %Tolerance instead of %Study When the manufacturing process is stable, in control, and When the parts selected for the GRR cover the entire range of process variation, and When the distribution is not close to the specification limits, and When the process is highly capable (Ppk>=2.5) When the dimension is not a SC/CC/ and severity <8
67 Values Sample Range Sample Mean What Does That Look Like? Xbar Chart 6 7 R Chart Feature # 59: Ø UCL= _ X= LCL= UCL= LSL Capability Histogram USL Normal Prob Plot A D: 0.398, P: Specifications LSL USL _ R= LCL= Last 12 Subgroups Sample Within StDev Cp 7.75 Cpk 6.07 PPM 0.00 Capability Plot Within O v erall Specs Overall StDev Pp 6.03 Ppk 4.73 Cpm * PPM 0.00
68 Troubleshooting Variable GRR Repeatability Issues Verify / Review gage instructions Verify clamping sequence Verify part is not loose in gage Verify measuring location is the same between trials Verify sufficient gage resolution Verify maintenance schedule is sufficient Verify operator method does not vary Review environmental impact (heat, vibration, etc.)
69 Troubleshooting Variable GRR Reproducibility Issues Verify / Review gage instructions Verify clamping sequence is the same Verify appraiser to appraiser methods are the same Appraiser ergonomics (size, strength, etc.) Review environmental impact (heat, vibration, etc.)
70 Reducing Variation Multiple Readings If improving of gage instructions and appraiser training fail to provide an acceptable outcome you can use multiple readings to gain a better result One drawback to this is that it can take significantly longer to conduct the study and this method will need to be used until further gage improvements can be made
71 Reducing Variation Multiple Readings Variation may be reduced by taking multiple measurements of a part and averaging the readings. This average can then be substituted for the individual measurement Where N = Sample size
72 Multiple Readings Why? Confidence Interval Measurement Actual Size Average Measurement
73 Multiple Readings - Example
74 Multiple Readings - Example Five measurements were taken and averaged to help reduce variation Initial GRR (1 Measurement) Repeat GRR (5 Measurements) %Study %Study
75 Attribute Data GRR
76 Attribute GRR What is the goal of an attribute GRR? 100% match within and between operators measurement and the correct (master) attribute To have all Kappa values greater than 0.75
77 Attribute GRR What you need 1. At least 50 parts 2. At least 3 appraisers 3. Each appraiser should measure each part 3 times
78 Attribute GRR Part Selection 25% close to the LSL 30% from normal process variation 25% close to the USL 10% outside of LSL 10% outside of USL LSL USL
79 Attribute GRR How to conduct an attribute GRR 1. Select parts for study (50 minimum) 2. Select appraisers for study (recommend 3) 3. Measure all 50 parts on a master measurement system (ex. CMM) 4. Build a master truth table This table lists the known disposition of each part (pass/fail) as well as associated variable data


80 Attribute GRR 5. Conduct the GRR study (Measure parts in random order, observe study while in progress. 6. Input data into Minitab Input part number, master measurement and truth Input trial number, appraiser and outcome


81 Attribute GRR 1. Go to Stat, Quality Tools, Attribute Agreement Analysis Don t forget to fill in the gage information! If appraiser data is in multiple columns fill in here Select the appropriate columns for each field.
82 Percent Percent Assessment Agreement - Attribute Date of study: 03/20/2012 Reported by: Dan W. Name of product: 19 - Alignment Pin Height Misc: Less than 6.8mm Within Appraisers Appraiser vs Standard % C I Percent % C I Percent How well each appraiser agrees with themself How well each appraiser agrees with the truth Appraiser Appraiser 3
83 (Repeatability) Kappa Values (Must be greater than 0.75)
84 (Reproducibility) Kappa Values (Must be greater than 0.75)
85 Kappa Value What is a kappa value? Fleiss kappa value is used to measure the level of agreement between two appraisers rating the same data set This equation is comparing the proportion of agreement between appraisers after removing chance
86 Attribute Agreement How many Kappa values are calculated? Within Appraiser Between Appraiser Each Appraiser to Standard All Appraisers to Standard All Kappa values must be greater than 0.75
87 Attribute GRR More Info There is an alternate method for calculating Kappa values for different types of attribute data Nominal Information is qualitative, not quantitative Go / No Go, Gender, Race Use Fleiss Kappa Statistic Ordinal Higher number represent higher values. The zero point is chosen arbitrarily. Casting porosity rating Use Kendall s Coefficient of Concordance
88 Guard Banding
89 Guard Banding General Rules Guard banding is shrinking the product acceptance limits from the product tolerance This can only be done if a gage has repeatability issues. It will do nothing to correct a reproducibility concern Typically used when a product is not capable and the part is measured 100%
90 Guard Banding How to Implement 10% 10% Both the LSL and USL should be shrunk by 10% (toward nominal) LSL USL Let s assume a gauge has 20% Tolerance Variation measurement error (GRR) What would you do?
91 Acceptance Criteria - Summary Resolution Gage should be 1/10 th of product tolerance Range charts with 5 or less possible values (steps) could be an indicator of inadequate resolution Range charts where 25% or more points have 0 range values indicates poor resolution Linearity Must include 5 or more samples Parts selected must cover entire product tolerance All p-values should be greater than 0.05 (P>0.05)
92 Acceptance Criteria - Summary Variable GRR 10% or less %Study with 5 or more distinct categories (10%-30% may be acceptable) 10% or less %Tolerance with 5 or more distinct categories (10%-30% may be acceptable) If reporting %Tolerance process must have high capability (ex Ppk>2.5), be stable and in control. Number of distinct categories is not used when reporting %Tolerance with a high capability process R-Charts should have all points within control limits Xbar charts should have more than 50% of points outside of control limits. Part to part variation should account for almost all of the variation in the study
93 Acceptance Criteria - Summary Attribute GRR All Kappa values must be greater than 0.75 Within Appraiser Between Appraiser Each Appraiser to Standard All Appraisers to Standard
Four Innovative Methods to Evaluate Attribute Measurement Systems
 Four Innovative Methods to Evaluate Attribute Measurement Systems Thomas Rust Reliability Engineer/Trainer Sept. 206 Saving More Lives Autoliv Global Footprint Japan RoA 0% Europe 7% 3% China 7% Sales
Continuous Improvement Toolkit
 Continuous Improvement Toolkit Measurement System Analysis (MSA) Managing Risk PDPC Pros and Cons Importance-Urgency Mapping RACI Matrix Stakeholders Analysis FMEA RAID Logs Break-even Analysis Cost -Benefit
Why do Gage R&Rs fail?
 Why do Gage R&Rs fail? Common reasons a gage fails a gage R&R Consider these in all gage system designs. 1) The part itself is awkward or encumbering Maybe the part needs a holding fixture to free up your
ISE 320 Quality Control and Industrial Statistics CHAPTER 06 MEASUREMENT SYSTEM ANALYSIS (MSA) Engineering College, Hail University, Saudi Arabia
 Engineering College, Hail University, Saudi Arabia") ISE 320 Quality Control and Industrial Statistics CHAPTER 06 MEASUREMENT SYSTEM ANALYSIS (MSA) Professor Mohamed Aichouni Engineering College, Hail University, Saudi Arabia Introduction on MSA To improve
ISE 320 Quality Control and Industrial Statistics CHAPTER 06 MEASUREMENT SYSTEM ANALYSIS (MSA) Professor Mohamed Aichouni Engineering College, Hail University, Saudi Arabia Introduction on MSA To improve
Measure Phase Measurement System Analysis
 Measure Phase Measurement System Analysis Measurement System Analysis Welcome to Measure Process Discovery Six Sigma Statistics Measurement System Analysis Basics of MSA Variables MSA Attribute MSA Process
QUICK & DIRTY GRR PROCEDURE TO RANK TEST METHOD VARIABILITY
 QUICK & DIRTY GRR PROCEDURE TO RANK TEST METHOD VARIABILITY Mike Mercer, Quality Engineering Specialist, 3M, St. Paul, MN Steve Cox, Lean Six Sigma Coach, 3M, St. Paul, MN Introduction One of the first
Presented by: ASQ Section 0700 ASQ Section ASQ Section 0702 ASQ Section 0706
 Presented by: ASQ Section 0700 ASQ Section 0701 ASQ Section 0702 ASQ Section 0706 Please support our gracious Sponsors: Gold Level Silver Level Bronze Level Measurement Systems Analysis VARIABLE GAGE R&R
Understanding Variation and Statistical Process Control: Variation and Process Capability Calculations
 Understanding Variation and Statistical Process Control: Variation and Process Capability Calculations www.nano4me.org 2017 The Pennsylvania State University Process Capability Calculations 1 Outline Variation
Welcome to the course, Evaluating the Measurement System. The Measurement System is all the elements that make up the use of a particular gage.
 Welcome to the course, Evaluating the Measurement System. The Measurement System is all the elements that make up the use of a particular gage. Parts, people, the environment, and the gage itself are all
Capability on Aggregate Processes
 Capability on Aggregate Processes CVJ Systems AWD Systems Trans Axle Solutions edrive Systems The Problem Fixture 1 Fixture 2 Horizontal Mach With one machine and a couple of fixtures, it s a pretty easy
Capability studies, helpful tools in process quality improvement
 Capability studies, helpful tools in process quality improvement Carmen Simion 1,* 1 Lucian Blaga University of Sibiu, Department of Industrial Engineering and Management, 550025 Emil Cioran street 4,
Measurement system analysis for one-sided tolerance
 ITM Web of Conferences 15, 511 (217) DOI: 1.151/itmconf/21715511 Measurement system analysis for one-sided tolerance Szemik Kamil 1,*, Bogacz Pawel 1 1 AGH University of Science and Technology, Faculty
Cpk. X _ LSL 3s 3s USL _ X. Cpk = Min [ Specification Width Process Spread LSL USL
 Cpk A Guide to Using a Process Capability Index Cpk = Min [ USL _ X, X _ LSL ] 3s 3s Specification Width Process Spread LSL X USL The following information is provided by the Technology Issues Committee
Daniel Y. Peng, Ph.D.
 Using Control Charts to Evaluate Process Variability Daniel Y. Peng, Ph.D. Quality Assessment Lead Office of Process and Facility (OPF) OPQ/CDER/FDA PQRI 205 Annual Meeting North Bethesda, Maryland October
Statistical Process Control Seminar at Jireh Semiconductor. Topic Agenda
 Statistical Process Control Seminar at Jireh Semiconductor Instructor: John Breckline January 24, 2018 In association with BW (Ben) Marguglio, LLC 845-265-0123 Topic Agenda 2 SPC / Stats Review Critical
Statistical Measurement System Analysis of Ruston TA1750 Gas Turbine 1st Stage Nozzle
 Statistical Measurement System Analysis of Ruston TA1750 Gas Turbine 1st Stage Nozzle R.SHOJAEI, M.SOHRABI, M.A.AMJADI Research centre on manufacturing and production Mavadkaran Engineering Co. (MAPNA
Chapter 6 - Statistical Quality Control
 Chapter 6 - Statistical Quality Control Operations Management by R. Dan Reid & Nada R. Sanders 3rd Edition PowerPoint Presentation by R.B. Clough UNH M. E. Henrie - UAA Learning Objectives Describe Categories
Type-2 Study. Measurement system analysis in destra, version 11
 Type-2 Study Measurement system analysis in destra, version 11 Type-2 Study 1/25 Contents 1. Preface... 2 2. Basic information about type-2 study... 3 2.1 Performing a measurement system analysis according
INFLUENCE OF THE INTERACTION BETWEEN PARTS AND APPRAISERS ON THE RESULTS OF REPEATABILITY AND REPRODUCIBILITY ANALYSIS
 KVALITA INOVÁCIA PROSPERITA / QUALITY INNOVATION PROSPERITY XVI/1 2012 25 INFLUENCE OF THE INTERACTION BETWEEN PARTS AND APPRAISERS ON THE RESULTS OF REPEATABILITY AND REPRODUCIBILITY ANALYSIS JIŘÍ PLURA,
Poor Metrology: The Hidden Cost
 Poor Metrology: The Hidden Cost Michael Cieslinski Panasonic Factory Solutions Company of America Buffalo Grove, IL Abstract Doing more with less has been the standard operating procedure in manufacturing
Pegasus Manufacturing SUPPLIER QUALITY REQUIREMENTS MANUAL
 Pegasus Manufacturing SUPPLIER QUALITY REQUIREMENTS MANUAL January 15, 2013 Rev. 2 March 20, 2008 SUPPLIER QUALITY REQUIREMENTS MANUAL CONTENTS SECTION PAGE # INTRODUCTION ii 01 SUPPLIER SELECTION AND
Product Robustness: Reducing Variability and Ensuring Delivery of Superior Quality Products to Patients
 Product Robustness: Reducing Variability and Ensuring Delivery of Superior Quality Products to Patients Dafni Bika, Jennifer Walsh and Tara Nestor Global Manufacturing Science and Technology Bristol-Myers
Ten Requirements for Effective Process Control
 Published in ASQ Quality Progress and won the Paper of the Year Award in 2002. Ten Requirements for Effective Process Control Thomas A. Little Ph.D. Thomas A. Little Consulting 12401 N Wildflower Lane
Comparison of Approaches to Gauge Repeatability and Reproducibility Analysis
 Comparison of Approaches to Gauge Repeatability and Reproducibility Analysis Pavlína Mikulová 1,*, and Jiří Plura 2 1 VSB - Technical University of Ostrava, FMME, Department of Quality Management, Ostrava-
VALIDATION OF THE GRADER S ABILITY USING MEASUREMENT SYSTEM ANALYSIS
 VOL., NO. 5, AUGUST ISSN 8-8 - Asian Research Publishing Network (ARPN). All rights reserved. VALIDATION OF THE GRADER S ABILITY USING MEASUREMENT SYSTEM ANALYSIS Ivan Gunawan and Dwi Agustin Nuriani Sirodj
How to ask questions thru Webcast If just want awareness feel free to drop off after first hour
 11 How to ask questions thru Webcast If just want awareness feel free to drop off after first hour 2 3 Purpose of SQM Establishes the Quality System Requirements to become and remain a direct or indirect
Applying Statistical Techniques to implement High Maturity Practices At North Shore Technologies (NST) Anand Bhatnagar December 2015
 Anand Bhatnagar December 2015") Applying Statistical Techniques to implement High Maturity Practices At North Shore Technologies (NST) Anand Bhatnagar December 2015 For our audience some Key Features Say Yes when you understand Say No
Applying Statistical Techniques to implement High Maturity Practices At North Shore Technologies (NST) Anand Bhatnagar December 2015 For our audience some Key Features Say Yes when you understand Say No
Best Practices for OINDP Pharmaceutical Development Programs Leachables and Extractables. VIII. Quality Control and Specification Setting
 Best Practices for OINDP Pharmaceutical Development Programs Leachables and Extractables VIII. Quality Control and Specification Setting PQRI Leachables & Extractables Working Group PQRI Training Course
Measurement System Analysis For Automated Test Systems. Dave Barnard Bob Trinnes Rockwell Automation, Inc
 Measurement System Analysis For Automated Test Systems Dave Barnard Bob Trinnes Rockwell Automation, Inc Why? How much of my tolerance is being used up by my measurement system? Can I tell a good part
Practical Applications of Statistical Methods Under 2011 FDA Process Validation Guidance
 Practical Applications of Statistical Methods Under 2011 FDA Process Validation Guidance Abe Germansderfer Associate Director, Quality Control Gilead Sciences 2011 Process Validation Guidance In January
Statistics and Pharmaceutical Quality
 Statistics and Pharmaceutical Quality Karthik Iyer (CQE, CSSBB) Senior Policy Advisor CDER/OC/OMPQ January 24 th, 2014 IFPAC * This presentation reflects the views of the author and should not be construed
Daniel Y. Peng, Ph.D.
 Using Process Capability to Enhance Product Quality Daniel Y. Peng, Ph.D. Senior Product Quality Reviewer Office of Process and Facility (OPF) OPQ/CDER/FDA IFPAC 2015 Annual Meeting Arlington, Virginia
Quality Assurance. Chapter 42
 Quality (Part 8) Quality Assurance Chapter 42 Quality Definitions Quality is defined as those products and/or service features that meet or exceed customer expectations Quality Assurance (QA) is proactive
Introduction to Control Charts
 Introduction to Control Charts Highlights Control charts can help you prevent defects before they happen. The control chart tells you how the process is behaving over time. It's the process talking to
CEC SDG Glossary of Terms Notes
 CEC SDG Glossary of Terms Notes - Terms are listed alphabetically - Acronyms are either identified by underlined words (e.g. Co-ordinating European Council), or refer to a separate full-text entry - Each
Managing Quality in Pharmaceutical Industry Using Six Sigma. Edited by Mahmoud Farouk Moussa TQM, CSSBB, MBA
 Managing Quality in Pharmaceutical Industry Using Six Sigma Edited by Mahmoud Farouk Moussa TQM, CSSBB, MBA Outlines Pharmaceutical Manufacturing Process and Drug Product Quality. Process Excellence Approach
Measurement Uncertainty Guide. ISO Accreditation Program
 Measurement Uncertainty Guide ISO 15189 Accreditation Program Background Why This is Necessary The ISO 15189:2012 standard contains enhanced expectations regarding measurement uncertainty (MU) in clause
This document has been printed from the network and will not be updated. The user is responsible for verification of current revision.
 Page 2 of 18 1.0 PURPOSE This document provides guidelines for compliance to UTC s UPPAP, for members of the NORDAM supply chain. is a standalone document to be used in place of UTC s ASQR 9.2. The UPPAP
Statistics in Validation. Tara Scherder CSO Supply, Arlenda, Inc
 Statistics in Validation 05 Arlenda Tara Scherder CSO Supply, Arlenda, Inc IVT Validation Week Philadelphia, PA Oct 7,05 Agenda Evolution of Validation 0 FDA Guidance Why Use Statistics Stage Process Design
Approach of Measuring System Analyses for Automotive Part Manufacturing
 Approach of Measuring System Analyses for Automotive Part Manufacturing S. Homrossukon, S. Sansureerungsigun Digital Open Science Index, Industrial and Manufacturing Engineering waset.org/publication/9997706
Resolving Common Issues with Performance Indices
 http://www.isixsigma.com/library/content/c090119a.asp Resolving Common Issues with Performance Indices By Forrest W. Breyfogle III Measurements affect behavior. Wrong behavior results when metrics are
Variation Management of Key Characteristics
 Aerospace Standard AS9103 Variation Management of Key Characteristics Chetan Date Director, Quality Initiatives Honeywell ES&S Standardization Management Leader Why AS9103? One of the objectives of the
Design of Experiments (DOE) Instructor: Thomas Oesterle
 Instructor: Thomas Oesterle") 1 Design of Experiments (DOE) Instructor: Thomas Oesterle 2 Instructor Thomas Oesterle thomas.oest@gmail.com 3 Agenda Introduction Planning the Experiment Selecting a Design Matrix Analyzing the Data Modeling
1 Design of Experiments (DOE) Instructor: Thomas Oesterle 2 Instructor Thomas Oesterle thomas.oest@gmail.com 3 Agenda Introduction Planning the Experiment Selecting a Design Matrix Analyzing the Data Modeling
PPAP Process Checklist \ Sign Off Sheet instructions
 PPAP Process Checklist \ Sign Off Sheet instructions In addition to these requirements you must meet all Nexteer Automotive Supplier Requirements noted in the Nexteer Automotive Supplier Website. Nexteer
Document downloaded from:
 Document downloaded from: http://hdl.handle.net/10251/60492 This paper must be cited as: Carrión García, A.; Grisales Del Rio, AM. (2013). Number of distinct data categories and gage repeatability and
SNAP-ON INCORPORATED STANDARD ON FACILITY SPECIFIC REQUIREMENTS
 SNAP-ON INCORPORATED STANDARD ON FACILITY SPECIFIC REQUIREMENTS Approval: Date: SEQ80.01.doc Page 1 of 15 Rev. 05/01/05 0.0 Introduction and overview The QFS system document (Tier I) includes both corporate
Industry Forum. Aerospace Management System Tools Training and Implementation Programmes. Web:
 Industry Forum Aerospace Management System Tools Training and Implementation Programmes Web: www.industryforum.co.uk/training Email: courses@industryforum.co.uk Phone: +44(0)121 717 6600 Why choose Industry
For Demonstrations: Automatic Data Collection So Simple The Graphs Just Appear
 For Demonstrations: 800.875.4243 S P C S O F T W A R E S I N C E 1 9 8 3 Automatic Data Collection So Simple The Graphs Just Appear D A T A C O L L E C T I O N / A N A L Y S I S S O F T W A R E QC-CALC
The Dummy s Guide to Data Analysis Using SPSS
 The Dummy s Guide to Data Analysis Using SPSS Univariate Statistics Scripps College Amy Gamble April, 2001 Amy Gamble 4/30/01 All Rights Rerserved Table of Contents PAGE Creating a Data File...3 1. Creating
Statistical Questions from CPV Monitoring of Bioreactor Data
 Statistical Questions from CPV Monitoring of Bioreactor Data Craig Bernier Principal Statistician Design to Value and Quality Engineering Janssen Pharmaceutical Companies of Johnson and Johnson Individual
MEASUREMENT SYSTEMS ANALYSIS
 MEASUREMENT SYSTEMS ANALYSIS Reference Manual Fourth Edition First Edition, October 1990 Second Edition, February 1995; Second Printing, June 1998 Third Edition, March 2002; Second Printing, May 2003;
Quality Management (PQM01) Chapter 04 - Quality Control
 Chapter 04 - Quality Control") Quality Management (PQM01) Chapter 04 - Quality Control Slide 1 Slide 2 Involves monitoring specific project results to determine if they comply with relevant quality standards, and identifying ways to
Quality Management (PQM01) Chapter 04 - Quality Control Slide 1 Slide 2 Involves monitoring specific project results to determine if they comply with relevant quality standards, and identifying ways to
Chapter 4: Foundations for inference. OpenIntro Statistics, 2nd Edition
 Chapter 4: Foundations for inference OpenIntro Statistics, 2nd Edition Variability in estimates 1 Variability in estimates Application exercise Sampling distributions - via CLT 2 Confidence intervals 3
Quality Management. It costs a lot to produce a bad product. Norman Augustine
 Quality Management It costs a lot to produce a bad product. Norman Augustine Cost of quality 1. Prevention costs 2. Appraisal costs 3. Internal failure costs 4. External failure costs 5. Opportunity costs
Step 5: ISO9001:2015 -Risk Based Planning Risk Controls
 Step 5: ISO9001:2015 -Risk Based Planning Risk Controls Ridgeway Services Specialists Ltd Copyright 2014 In this fifth workshop module we will look at risks controls. By the end of this module you will
Assignment 5 (Solution) Measurement System Analysis and OC curve
 Measurement System Analysis and OC curve") Assignment 5 (Solution) Measurement System Analysis and OC curve Dr. Jitesh J. Thakkar Department of Industrial and Systems Engineering Indian Institute of Technology Kharagpur Dr. Jitesh J. Thakkar, IIT
Assignment 5 (Solution) Measurement System Analysis and OC curve Dr. Jitesh J. Thakkar Department of Industrial and Systems Engineering Indian Institute of Technology Kharagpur Dr. Jitesh J. Thakkar, IIT
Industry Forum SPECIAL OFFER. Industry Forum... A Common Approach Universally Applied. ISO/TS16949: 2009 Lead Auditor Re-Certification Training
 Industry Forum Newsletter Volume 13 ISO/TS16949: 2009 Lead Auditor Re-Certification Training You may be coming up to your Re-Certification date after attending one of our ISO/TS16949 Lead Auditor Training
Statistics: Data Analysis and Presentation. Fr Clinic II
 Statistics: Data Analysis and Presentation Fr Clinic II Overview Tables and Graphs Populations and Samples Mean, Median, and Standard Deviation Standard Error & 95% Confidence Interval (CI) Error Bars
Production Part Approval Process (PPAP)
") Document ID: QN-M04 Page 1 of 13 Aerojet Rocketdyne Quality Note M04 Date: 03/16/2016 Table of Contents 1. PURPOSE... 2 2. APPLICATION... 2 2.1. Resubmissions... 2 2.2. Applicable Documents... 3 3. CONVENTIONS...
Document ID: QN-M04 Page 1 of 13 Aerojet Rocketdyne Quality Note M04 Date: 03/16/2016 Table of Contents 1. PURPOSE... 2 2. APPLICATION... 2 2.1. Resubmissions... 2 2.2. Applicable Documents... 3 3. CONVENTIONS...
Aerojet Quality Note. Process Variation Management QN-C /30/2014
 Doc ID: QN-C24 Page 1 of 7 Aerojet Quality Note Rev # Date QN-C24 2 05/30/2014 Scope: Application: Any process or characteristic-related data collected at the supplier or the supplier s subcontractor s
Lean Six Sigma Quality Transformation Toolkit (LSSQTT)* LSSQTT Tool #13 Courseware Content
* LSSQTT Tool #13 Courseware Content") Lean Six Sigma Quality Transformation Toolkit (LSSQTT)* LSSQTT Tool #13 Courseware Content Capability, Charts And Quality Characteristics Analysis: Transitioning Six Sigma And Lean 1. Framework for capability:
Lean Six Sigma Quality Transformation Toolkit (LSSQTT)* LSSQTT Tool #13 Courseware Content Capability, Charts And Quality Characteristics Analysis: Transitioning Six Sigma And Lean 1. Framework for capability:
The Importance of Understanding Type I and Type II Error in Statistical Process Control Charts. Part 1: Focus on Type 1 Error
 The Importance of Understanding Type I and Type II Error in Statistical Process Control Charts Part 1: Focus on Type 1 Error Phillip R. Rosenkrantz, Ed.D., P.E. California State Polytechnic University
P D A C. Driven by Excellence. Increase the Ppk of window runout from 0.3 to 1.33 by Mar 16. Project Champion : Mr. Pawan Khurana
 Driven by Excellence Increase the Ppk of window runout from 0. to 1. by Mar 1 Project Champion : Mr. Pawan Khurana Project Leader : Mr. Atul Aggarwal Driven by Excellence Amtek Powertrain Ltd. Dharuhera
Practical Considerations for the Use of Double-Flank Testing for the Manufacturing Control of Gearing - Part II
 technical Practical Considerations for the Use of Double-Flank Testing for the Manufacturing Control of Gearing - Part II Ernie Reiter and Fred Eberle Part I of this paper, which appeared in the January/February
Production Part Approval Process (PPAP)
") Document ID: QN-M04 Page 1 of 15 Aerojet Rocketdyne Quality Note M04 Date: 12/23/2016 Table of Contents 1. PURPOSE... 2 2. APPLICATION... 2 2.1. Resubmissions... 3 2.2. Applicable Documents... 3 3. CONVENTIONS...
Document ID: QN-M04 Page 1 of 15 Aerojet Rocketdyne Quality Note M04 Date: 12/23/2016 Table of Contents 1. PURPOSE... 2 2. APPLICATION... 2 2.1. Resubmissions... 3 2.2. Applicable Documents... 3 3. CONVENTIONS...
Learn What s New. Statistical Software
 Statistical Software Learn What s New Upgrade now to access new and improved statistical features and other enhancements that make it even easier to analyze your data. The Assistant Let Minitab s Assistant
If measurements are used to guide decisions, then it follows logically that. in the decisions based on those measurements.
 MSA Measurement System Analysis If measurements are used to guide decisions, then it follows logically that the more error there is in the measurements, the more error there will be in the decisions based
Graphical Tools - SigmaXL Version 6.1
 Graphical Tools - SigmaXL Version 6.1 Basic and Advanced (Multiple) Pareto Charts Multiple Boxplots and Dotplots EZ-Pivot/Pivot Charts Multiple Normal Probability Plots (with 95% confidence intervals to
= = Name: Lab Session: CID Number: The database can be found on our class website: Donald s used car data
 Intro to Statistics for the Social Sciences Fall, 2017, Dr. Suzanne Delaney Extra Credit Assignment Instructions: You have been hired as a statistical consultant by Donald who is a used car dealer to help
= = Intro to Statistics for the Social Sciences. Name: Lab Session: Spring, 2015, Dr. Suzanne Delaney
 Name: Intro to Statistics for the Social Sciences Lab Session: Spring, 2015, Dr. Suzanne Delaney CID Number: _ Homework #22 You have been hired as a statistical consultant by Donald who is a used car dealer
Monitoring validated processes by using SPC
 Monitoring validated processes by using SPC Content Monitoring validated process effectively Using SPC / Control charts to monitor processes Separating Signal from Noise System Approach Risk Analysis Protocol/Report
SECTION 1.0: PROCESS AUDIT STRATEGY AND PLANNING
 SECTION 1.0: PROCESS AUDIT STRATEGY AND PLANNING a. Have Annual Quality Targets been agreed and submitted to Electrolux or other customers? 7.7f 5.4.1 Objectives and quantifiable targets are required to
SEMBIT SQA Unit Code F9JK 04 Contributing to the application of measurement systems analysis (MSA)
") Contributing to the application of measurement systems analysis (MSA) Overview This unit covers the competences required for contributing to the application of measurement systems analysis (MSA). You will
Contributing to the application of measurement systems analysis (MSA) Overview This unit covers the competences required for contributing to the application of measurement systems analysis (MSA). You will
Basic applied techniques
 white paper Basic applied techniques Choose the right stat to make better decisions white paper Basic applied techniques 2 The information age has changed the way many of us do our jobs. In the 1980s,
Qualifying Capacitive Sensing Hole Measurement System Technology for Performing Gage R&R Studies
 08AMT-0050 Qualifying Capacitive Sensing Hole Measurement System Technology for Performing Gage R&R Studies Copyright 2008 SAE International Robert Magee Capacitec, Inc. ABSTRACT The Capacitec CMS3 Reader,
Test Method Validation of In-Vitro Diagnostic Products. Tim Carr QA Manager, Beckman Coulter
 Test Method Validation of In-Vitro Diagnostic Products Tim Carr QA Manager, Beckman Coulter IVD Overview What is an In-Vitro Diagnostic Test IVDs are medical devices and accessories Used to perform tests
Two Way ANOVA. Turkheimer PSYC 771. Page 1 Two-Way ANOVA
 Page 1 Two Way ANOVA Two way ANOVA is conceptually like multiple regression, in that we are trying to simulateously assess the effects of more than one X variable on Y. But just as in One Way ANOVA, the
Online Student Guide Types of Control Charts
 Online Student Guide Types of Control Charts OpusWorks 2016, All Rights Reserved 1 Table of Contents LEARNING OBJECTIVES... 4 INTRODUCTION... 4 DETECTION VS. PREVENTION... 5 CONTROL CHART UTILIZATION...
Design and Analysis of Gauge R&R Studies: Making Decisions Based on ANOVA Method
 Design and Analysis of Gauge R&R Studies: Making Decisions Based on ANOVA Method Afrooz Moatari Kazerouni Abstract In a competitive production environment, critical decision making are based on data resulted
Student Manual. Lesson 4- Statistical Concepts. Version /
 4-1 4-2 Listed above are the major Learning Outcomes you will have achieved when this lesson is completed. 4-3 It is important to understand that there is Variability in constructing transportation projects.
C O N T E N T S. Brief introduction to Six-Sigma. Case development and hands-on exercises. Conclusions. August 9, 2013 Santiago, Chile
 TheApplicationof Six-Sigma DMAIC to a Distribution System Edgardo J. Escalante, Ph.D. ITESM México Pan-American Advanced Studies Institute on Modeling, Simulation and Optimization of Globalized Physical
Project Quality Management. For the PMP Exam using PMBOK
 Project Quality Management For the PMP Exam using PMBOK Guide 5 th Edition PMI, PMP, PMBOK Guide are registered trade marks of Project Management Institute, Inc. Contacts Name: Khaled El-Nakib, PMP, PMI-RMP
Pb-Free Implementation: Best Practices by Ronald C. Lasky, Ph.D., PE Senior Technologist, Indium Corp Visiting Professor, Dartmouth
 Pb-Free Implementation: Best Practices by Ronald C. Lasky, Ph.D., PE Senior Technologist, Indium Corp Visiting Professor, Dartmouth Slide #0 Pb-Free Best Practices Assess Yourself Crucial with Pb-free
SPECIAL CONTROL CHARTS
 INDUSTIAL ENGINEEING APPLICATIONS AND PACTICES: USES ENCYCLOPEDIA SPECIAL CONTOL CHATS A. Sermet Anagun, PhD STATEMENT OF THE POBLEM Statistical Process Control (SPC) is a powerful collection of problem-solving
Its purpose is to define the approval process of new or revised parts, or parts resulting from new or significantly revised production methods.
 SUPPLIER PPAP HANDBOOK NORTH AMERICA Revision D May 24, 2018 Table of Contents Table of Contents 1 Foreword.. 2 Production Part approval Process (PPAP) Purpose.. 3 When is a Submission Required?. 3 Significant
aculty Research WORKING PAPER SERIES Identifying Sources of Variation in Sheet Metal Stamping Karl D. Majeske University of Michigan Business School
 aculty Research WORKING PAPER SERIES Identifying Sources of Variation in Sheet Metal Stamping Karl D. Majeske University of Michigan Business School Patrick C. Hammett University of Michigan Business School
PROCESS VALIDATION. A Systematic Approach 2015 WHITE PAPER WHITE PAPER PRODUCED BY MAETRICS
 WHITE PAPER PROCESS VALIDATION A Systematic Approach 2015 WHITE PAPER PRODUCED BY MAETRICS For more information, please contact: USA Office: +1 317 706 1493 UK Office: +44 115 921 6200 globalsales@maetrics.com
How to perform PPAP Level 1 Level 2 Level 3 Level 4 Level 5
 How to perform PPAP The process of completing a PPAP submission is complex. This detailed process is a collection of key elements that must be completed to verify that the production process will produce
Session 7. Introduction to important statistical techniques for competitiveness analysis example and interpretations
 ARTNeT Greater Mekong Sub-region (GMS) initiative Session 7 Introduction to important statistical techniques for competitiveness analysis example and interpretations ARTNeT Consultant Witada Anukoonwattaka,
For the PMP Exam using PMBOK. PMI, PMP, PMBOK Guide are registered trade marks of Project Management Institute, Inc.
 For the PMP Exam using PMBOK Guide 5 th Edition PMI, PMP, PMBOK Guide are registered trade marks of Project Management Institute, Inc. 1 Contacts Name: Khaled El-Nakib, MSc, PMP, PMI-RMP URL: http://www.khaledelnakib.com
Lifecycle Management of Process Analytical Technology Procedures
 Lifecycle Management of Process Analytical Technology Procedures IFPAC 2015 Marta Lichtig Senior Scientist in New Testing Technologies, ACS Member Contents General Comparison : PV guide to NIR model development
Developing and implementing statistical process control tools in a Jordanian company. R.H. Fouad* and Salman D. Al-Shobaki
 Int. J. Manufacturing Technology and Management, Vol. 17, No. 4, 2009 337 Developing and implementing statistical process control tools in a Jordanian company R.H. Fouad* and Salman D. Al-Shobaki Department
SPSS 14: quick guide
 SPSS 14: quick guide Edition 2, November 2007 If you would like this document in an alternative format please ask staff for help. On request we can provide documents with a different size and style of
JMP TIP SHEET FOR BUSINESS STATISTICS CENGAGE LEARNING
 JMP TIP SHEET FOR BUSINESS STATISTICS CENGAGE LEARNING INTRODUCTION JMP software provides introductory statistics in a package designed to let students visually explore data in an interactive way with
SEMBIT SQA Unit F9J4 04 Carrying out measurement systems analysis (MSA)
") Overview This unit covers the competences required for carrying out measurement systems analysis (MSA). It involves selecting an appropriate measurement system on which to carry out the analysis, and obtaining
Overview This unit covers the competences required for carrying out measurement systems analysis (MSA). It involves selecting an appropriate measurement system on which to carry out the analysis, and obtaining
Delivering Engineered Solutions
 Quality Terms Term Description Accept / Reject Criteria This refers to the measurement and decision of whether or not the quality and performance of a product or service is acceptable. These criteria can
Lean Six Sigma Green Belt Supplement
 Problem Solving and Process Improvement Tools and Techniques Guide Book Lean Six Sigma Green Belt Supplement Max Zornada, University of Adelaide Executive Education 7 th Floor, 10 Pultney Street, Adelaide,
Chapter 1 Data and Descriptive Statistics
 1.1 Introduction Chapter 1 Data and Descriptive Statistics Statistics is the art and science of collecting, summarizing, analyzing and interpreting data. The field of statistics can be broadly divided
STAT 2300: Unit 1 Learning Objectives Spring 2019
 STAT 2300: Unit 1 Learning Objectives Spring 2019 Unit tests are written to evaluate student comprehension, acquisition, and synthesis of these skills. The problems listed as Assigned MyStatLab Problems
Concepts for R&R Studies. Second Edition
 Concepts for R&R Studies Second Edition Also available from ASQ Quality Press: If Concepts for R&R Studies, Second Edition was of interest to you these publications may also be of value: An Introduction