City Power Johannesburg (SOC) Ltd Updated Business Plan
|
|
|
- Edwina Lucas
- 6 years ago
- Views:
Transcription
 Ltd Updated Business Plan 2015")
1 City Power Business Plan Draft 5.3 City Power Johannesburg (SOC) Ltd Updated Business Plan Final Draft 5.3 Page 1
2 Sign Off: CEO/MD Name: Signature: Date: Sector ED Name:.... Signature: Date:. Sector MMC Name:.. Signature: Date:. Company Details Company Name: City Power Johannesburg (SOC) Ltd Company Registration Number: Reg 2000/030051/30 Physical Address: 40 Heronmere Road, Reuven Postal Address: PO Box 38766, Booysens, 2016 Phone Number: (+27) Fax Number: (+27) Website: Customer Contact Centre: (+27) Draft 3 Page 2
3 TABLE OF CONTENTS: SECTION 1: INTRODUCTION... 5 SECTION 1.1: CITY POWER, HISTORY AND BACKGROUND... 5 SECTION 2: ENVIRONMENTAL SCAN... 6 SECTION 2.1: INTRODUCTION... 6 SECTION 2.2: HIGH LEVEL SWOT AND PESTEL ANALYSIS... 6 SECTION 2.3: EXTERNAL ENVIRONMENT... 7 SECTION 3: SHAREHOLDER ALIGNMENT TO GDS AND IDP SECTION 3.1: PROBLEM STATEMENT SECTION 3.2: GROWTH AND DEVELOPMENT STRATEGY 2040 (GDS 2040) SECTION 3.3: THE FOCUS AREAS SECTION 3.5: GDS IDP 5 YEAR PLAN SECTION 4: PERFORMANCE PLAN SECTION 4.1: STRATEGY MAP SECTION 4.2 COMPANY PERFORMANCE SCORECARE SECTION 5: BUSINESS OF TODAY SECTION 5.1: GAME CHANGER SECTION 5.2: FLAGSHIP PROGRAMMES SECTION 5.2.1: CORRIDORS OF FREEDOM SECTION 5.2.2: JOZI@WORK SECTION 5.2.3: GREEN/BLUE ECONOMY SECTION 5.2.4: SMART CITY SECTION 5.3: CORE MANDATE SECTION 5.3.1: REVENUE RECOVERY PLAN SECTION 5.3.2: SECURITY OF SUPPLY (LOAD SHEDDING) SECTION 5.3.3: INFRASTRUCTURE PLAN AND MAINTENANCE PROJECT SECTION ELECTRIFICATION OF INFORMAL SETTLEMENTS SECTIONS 5.4: SERVICE DELIVERY ENABLERS SECTION 5.4.1: INFRATRUCTURE PLAN: INFORMATION, COMMUNICATION AND TECHNOLOGY (ICT) 65 SECTION 5.4.2: DATA MANAGEMENT SECTION 6: BUSINESS OF TOMORROW SECTION 6.1 BUSINESS MODEL REVIEW SECTION 7: FINANCIAL PLAN SECTION 7.1: TARIFF PLAN SECTION 7.2: BUDGET SECTION 7.3: CAPITAL PLAN Draft 3 Page 3
4 SECTION 8: HUMAN RESOURCE PLAN SECTION 8.1: ORGANISATIONAL LEADERSHIP SECTION 8.2: THE HR PLAN SECTION 9: ENTERPRISE WIDE RISK MANAGEMENT SECTION 9.1: RISK MANAGEMENT PROCESS SECTION 9.2: STRATEGIC RISKS REPORT SECTION 10: CONCLUSION SECTION 11: BUSINESS ACRONYMS AND APPENDICES SECTION 12: COMPANY STRATEGIC RISK REGISTER Draft 3 Page 4
5 SECTION 1: INTRODUCTION SECTION 1.1: CITY POWER, HISTORY AND BACKGROUND Following the first democratic elections that took place in 1994, and the local government election that followed in 1995, eleven local authorities were amalgamated to form the Greater Johannesburg Metropolitan Council. By mid-1997 it became apparent that the new structures were not optimally effective and the Councils of Greater Johannesburg were facing a severe financial crisis. It was then agreed that a unified, metropolitan-wide initiative was necessary to focus specifically on the critical problems facing the City. This led to the inception of the i- Goli 2002 plan. i-goli 2002 was essentially a three-year strategic plan. It involved the structural transformation of Metro functions with the view to ensuring enhanced and more cost effective service delivery. It achieved this by reducing fragmentation, eliminating duplication, improving accountability, focusing on human resource development and improving performance incentives. From an organisational perspective, the i-goli 2002 Plan put in place sensible structures that delivered at greater levels of efficiency. The i-goli 2002 Plan envisaged that the City would work through a combination of new political governance structures, agencies and corporatised entities. A key element of the i-goli 2002 strategy for service delivery was the establishment of utilities, agencies and corporatised entities now called the municipal owned entities (MOEs). One of the entities established was City Power Johannesburg (SOC) Ltd, 100% owned by the City of Johannesburg, and established in terms of the Companies Act, on 30 November In line with the establishment of City Power Johannesburg (SOC) Ltd, the Council utilises an Environment and Infrastructure Services Department (EISD) to oversee the performance and Group Governance to oversee the governance of the company, as well as to regulate it. In this regard various agreements in principle were concluded during the establishment of the companies. These included the Sale of Business Agreement (SBA) and the Service Delivery Agreement (SDA). The relationship maintained with the Greater Johannesburg Metropolitan Council is one of Service Authority and Service Provider. City Power Johannesburg (SOC) Ltd is the preferred Service Provider for the Service Authority, the Council. City Power Johannesburg (SOC) Ltd is the Energy Distribution Service Provider to the Service Authority, Johannesburg Council. The core competency of the business is to purchase, distribute and sell electricity within its geographical footprint of business. The City of Johannesburg is the sole Shareowner. The Council, by means of a Service Delivery Agreement, regulates the service in respect of the following: financial issues (such as tariffs and capital expenditure), human resource issues (such as skills development), delivery targets (maintenance of assets and addressing assets), and standards of customer care. Draft 3 Page 5
6 SECTION 2: ENVIRONMENTAL SCAN SECTION 2.1: INTRODUCTION An environmental scan is a process which results in the identification and monitoring of factors from both inside and outside the organization that may impact the long-term viability of the organisation. For City Power, the Environmental Scan provides the Board and Management Team with information that assists them in decision making. This section of the business plan will provide a high level SWOT and PESTEL analysis, to identify City Power s Strengths, Weaknesses, Opportunities and Threats; and analyse the Political, Economic, Social, Technological, Environmental and Legal environment in which it operates. SECTION 2.2: HIGH LEVEL SWOT AND PESTEL ANALYSIS STRENGTHS WEAKNESSES ISO accreditation Communication (Internal and External) Good knowledge and Change management understanding of the Contracts management business Perceived low employee morale Well documented value Ineffective performance management chains Poor implementation of documented process Supportive stakeholder High vacancy rates and Board Inability to execute projects and follow through on benefit realisation Positions in Top Process leading up to decision-making is slow Management Team Revenue collection filled Reducing the average age of our transmission and distribution network Strategic Risks where it is in excess of 40 years through refurbishment and replacement identified and Obsolete and unreliable equipment for which we are no longer able to documented obtain spares Updated risk Addressing and improving safety on the network i.e. replacement of high management process in risk equipment place A network that, due to densification, has in many areas exceeded its firm Pockets of strong capacity and in some instances reached its installed capacity subject matter expertise Outages and slow restoration times to restore power following outages OPPORTUNITIES THREATS Expansion of supply Load shedding Security of supply Theft/vandalism, illegal connections leading Alternative energy sources to loss of revenue and damage to Community involvement/engagement (Jozi@work) infrastructure Smart Grid realisation High debt levels in South Africa leading to ICT upgrade inability to pay or reduced consumption Company image/reputation Dramatic increase in the cost of key Public-private partnerships resources i.e. labour and materials Off grid solutions Comply with the Cluster programs while Investment in energy management systems trying to refurbish and extend our network Time of use tariffs to pass on and recover peak Industrial action demand liabilities High levels of coal usage leading to Smart meters and tariffs to reduce load to address increased GHG despite pressures to present generation constraints (short to medium term) reduce Conversion of residential to gas cooking and heating People setting up their own off grid solutions and becoming independent of the power grid Draft 3 Page 6
7 EXTERNAL FACTORS POLITICAL GDS 2040 Mayoral PIP COJ IDP/GDS SOCA/SONA New Minister and ministerial focus ECONOMIC SOCIAL TECHNOLOGICAL LEGAL ENVIRONMENTAL Funding challenges Consumer spending pressures Increased cost of supply (Eskom tariffs) Kelvin pricing/ppa Load Shedding Service delivery Social media Company image/reputation Theft and vandalism Illegal connections Unemployment levels Social and economic inequality Spatial challenges New technologies e.g. smart grid Changing ICT landscape- cyber security Globalisation/interconnectedness Constitutional requirements ISMO Energy legislation ISO Legislation and regulation limiting (wrt energy and low carbon) Drive to reduce consumption Drive to reduce emissions IPPs/renewable energy Use of diesel : security of supply Reliance on coal for energy supply for the foreseeable future Climate change Natural resource scarcity EFFECT High Level strategic focus/alignment Changing priorities/funding Changing targets: knock on effect Promises made: refocus mandate Refocus of mandate; implications for service delivery and business model Limited funding Reduced revenue if people cannot pay Reduced margins; or pass on costs which make electricity expensive Locked into agreement negative impact on pricing Investor and economic impact Pressures to deliver Interconnectedness: challenge of maintaining a positive company image and responding immediately to issues Increased outages and service delivery pressures Inability to pay; increased crime (theft and vandalism) Increased demand on current network (old) or challenges to replace new network Inability to pay; workforce health New skills required Cyber security becomes a greater challenge CP must act quickly to be a world class utility Mandate to supply electricity Limitation on procuring from IPP s Accreditation requirements to maintain license Legislation hinders carbon reduction and use of new energy Less consumption, less revenue Pricing of renewables may be +ve or ve Security of supply through alternative means Coal usage = more emissions Limited resources = challenge to the business operating model SECTION 2.3: EXTERNAL ENVIRONMENT GLOBAL ENERGY CONTEXT The environment in which we operate is continually changing and growing. Populations are increasing and consumer behaviours are being driven upwards. There is an increased spend on and usage of resources natural and otherwise. Increasing population size is linked to all aspects in todays supply and demand based economy. Both the 2003 and 2008 State of Environment Report (SoER) indicate increasing population size and we can see this continuous trend today. This brings about pressures on the environment related to housing demands, energy requirements, waste management system, and land use planning. These are all aspects that the country as a whole is coming to grips with ensuring that they are managed in the most effective manner while making provision for those communities that do not have adequate access to services, and at the Draft 3 Page 7

8 same time planning for increasing demand associated with population growth and a growing economy. Population pressure, through the need for economic growth, drives the demand for energy ever higher. Also of importance is the effect of spatial planning from the Apartheid era. Low density sprawl with extensive low density suburban areas and townships on the outer edges of the urban area have given rise to a transport intensive and energy inefficient city form. Since the energy sector in the country is heavily dependent on coal-based electricity and liquid fuel imports, it can be expected that a high carbon footprint is likely to persist for some time yet. (Royal Haskoning DHV, COJ State of Environment Report 2013/2014) An overview of the global energy context shows that world energy consumption growth projections are 0.8% - 1.5% per annum until Fossil fuels such as coal, oil and gas are expected to remain dominant in the global energy mix until at least 2040, despite growth in low-carbon sources of energy such as solar, wind and biomass. Despite the advent and discovery of gas and other renewable energies, the world is still failing to put the global energy system onto a more sustainable path. Emissions remain high and it can be expected that at some stage in the future there will be at least a partially concerted global effort to avoid a long term average global temperature increase. This could manifest as a significant reduction in coal usage. Water requirements for energy production are set to grow at twice the rate of energy demand, while growing water constraints as a result of population growth and climate change impacts are set to impose additional costs on the energy sector and even threaten the viability of some projects. Coal is the largest single contributor to anthropogenic greenhouse gas emissions. Together, coal, oil and gas contribute 68% of global emissions. In a world that is becoming increasingly aware of the dangers of global warming, the pressures to reduce emissions from these fossil fuels can only increase. These pressures are at company, country and global levels. Draft 3 Page 8
, Exxon Mobil, Shell, BP and the World Energy Council show a consistent growth in energy demand towards 2040/50, with some")

9 Current contributions to GHG emissions follow below. A review of 10 major global energy forecasts and scenarios from the U.S. Energy Information Administration, the International Energy Agency (IEA), Exxon Mobil, Shell, BP and the World Energy Council show a consistent growth in energy demand towards 2040/50, with some range in the proportions coming from fossil fuels, nuclear and renewables like solar, wind and biomass. The IEA World Energy Outlook 2013 factsheet gives projections which are in the middle of the range, some of which Energy Demand o Global energy demand will grow to 2035 (in the New Policies Scenario, world electricity demand increases by more than two thirds over the period ) o The centre of gravity of global energy demand moves decisively towards emerging economies o The magnitude of future global coal demand growth is uncertain, particularly because of the varying stringency of environmental policies o Fossil fuels continue to dominate the power sector, although their share of generation declines from 68% in 2011 to 57% in 2035 Pricing/Costs o The market for natural gas gradually becomes more global, with potential implications for pricing o Rising energy prices across many regions have led to major shifts in energy and overall trade balances, as well as to energy expenditures taking a growing share of household income Carbon Emissions o As the source of two-thirds of global greenhouse-gas emissions, the energy sector will be pivotal in determining whether or not climate change goals are achieved o CO2 emissions from the power sector rise from 13.0 gigatonnes (Gt) in 2011 to 15.2 Gt in 2035, retaining a share of around 40% of global emissions over the period. Renewable Energy o Achieving universal access to modern energy remains imperative; fossil-fuel subsidies continue to distort energy markets o The share of renewables in total power generation rises from 20% in 2011 to 31% in 2035, as they supply nearly half of the growth in global electricity generation. The above indicates an overall trend towards increased energy demand; slow growth in the renewables sector to try and counter the dependency on fossil fuels; and pressure to reduce carbon emissions will continue to increase Draft 3 Page 9
10 Exponential large-scale urban growth has created a pressing need for more holistic planning and governance of city development to ensure sustainable solutions 1. The Brundtland Commission defines sustainability as development that meets the needs of the present without compromising the ability of future generations to meet their own needs. Recognising that there is ultimately a balance in resource availability and demand will bring a focus to replicating nature s processes in the built environment. Waste, heat, water, materials and energy can actually work together in an integrated way, with by-products from each benefiting the delivery of others. For example, waste can be used to create electricity and heat and water can be reused for cooling and irrigation 2. Sweden s SymbioCity framework has enabled them to reduce carbon emissions by 18% while GNP increased by 45%. 3 They have embraced smart grid technology to control electricity, save energy, reduce costs and increase reliability. District heating (energy systems produce steam or hot water that is piped underground to buildings for heating purposes) has reduced carbon emissions and increased energy efficiency. Waste (collected by automatic underground waste collection systems) and waste water is converted to biogas for transport; and super-efficient buildings make use of solar-powered hot water and electricity. LOCAL ENERGY CONTEXT The World Energy Council (WEC) bases its definition of energy sustainability on three core dimensions. Energy security, including the effective management of primary energy supply from domestic and external sources, the reliability of energy infrastructure, and the ability of participating energy companies to meet current and future demand; Social equity, concerning the accessibility and affordability of energy supply across the population; and Environmental impact mitigation, encompassing the achievement of energy efficiencies and the development of energy supply from renewable and other lowcarbon sources. Establishing and maintaining the balance between these dimensions is referred to as the Energy Trilemma. The WEC Energy Sustainability Index ranks the energy systems of countries on these three dimensions. Countries are also awarded a balance score. While the Index rank measures overall performance, the balance score highlights how well a country manages the trade-offs between the three competing dimensions: energy security, energy equity, and environmentalsustainability. South Africa s rankings are captured in the table below. 1 SymbioCity Sustainability by Sweden (Get More for Less) 2 Cities of the future, Worldview Issue /09 3 SymbioCity Sustainability by Sweden Draft 3 Page 10

11 WEC Energy Sustainability Index Rankings South Africa, one of the highly-industrialised countries, improved five places to 79 in the overall Index rankings. Typical of the highly-industrialised group, South Africa s stronger energy security and energy equity rankings have come at the high price of its poor performance on the environmental sustainability dimension, resulting in an imbalance between the three points of the Energy Trilemma. In energy security, South Africa s strongest dimension, performance remains average as a result of a homogenous electricity mix that relies heavily on coal. Energy equity remains low in South Africa, as gasoline and electricity prices become more expensive. South Africa ranks second-to-last globally on environmental sustainability and struggles with every indicator in this dimension. This is due to the country s almost sole reliance on coal for electricity generation, extremely high per-capita emissions rates, and a slow development of renewable energy sources, despite bountiful natural endowments of sun and wind potential. Draft 3 Page 11
12 SECTION 3: SHAREHOLDER ALIGNMENT TO GDS AND IDP SECTION 3.1: PROBLEM STATEMENT The problem statement for the City Power business plan is to assist the City of Johannesburg to address the South African challenge of security and quality of electricity supply i.e. enabling consumers who reside in the City of Johannesburg jurisdiction to obtain electricity at a defined quality and reliability at affordable rates and transparent prices. In parallel to this objective City Power will also be required to ensure the sustainability of the business through the achievement of certain agreed to financial, social and environmental goals. SECTION 3.2: GROWTH AND DEVELOPMENT STRATEGY 2040 (GDS 2040) The review of the Growth and Development Strategy 2030 was brought about by a shift in the light of climate change and natural resource scarcity. Natural resource scarcity affects both human and economic development. The emphasis has shifted in an important way, reframing economic and human development within the context of sustainability in the GDS2040. COJ Vision In the GDG 2040 of the COJ, the vision is to be a World Class African City of the Future a vibrant, equitable African city, strengthened through its diversity; a city that provides real quality of life; a city that provides sustainability for all its citizens; a resilient and adaptive society (Joburg 2040). GDS Outcomes There are four GDS outcomes in the GDS2040 these are outlined below: Outcome 1: Improved quality of life and development driven resilience for all Outcome 2: Provide a resilient, liveable, sustainable urban environment- underpinned by infrastructure supportive of a low-carbon economy Outcome 3: An inclusive, job-intensive, resilient and competitive economy Outcome 4: A leading metropolitan government that pro-actively contributes to and builds a sustainable, socially inclusive, locally integrated and globally competitive global credit rating. GDS Principles There are six GDS principles in the GDS2040 these are outlined below: Eradicating poverty Building and growing an inclusive economy Building sustainable human settlements Ensuring resource security and environmental sustainability Achieving social inclusion Promoting good governance Draft 3 Page 12
13 Mayoral Priories and City Power Alignment The ten (10) priority areas for the ten (10) years are divided in to the current and the next mayoral term of office as follows: Priorities: Current term of office: 1. Financial sustainability and resilience; 2. Agriculture and food security; 3. Sustainable Human Settlements; 4. SMME and entrepreneurial support; and 5. Engaged and active citizenry. Priority for the current term of office and beyond: 6. Smart City; 7. Resource Sustainability; 8. Investment attractions, retention and expansion; 9. Green Economy; and 10. Safer City In this business plan the organisation ensures alignment with the City s strategic direction and aligns to the GDS City Power is part of sustainable infrastructure cluster and the cluster has identified flagship sub-programs which are driven by different departments and MOE s. City Power is directly involved with some of the programmes while it has direct and indirect input on others. The table below shows the flagship programmes and City Power s involvement and input to these programmes: Lead and Influence Financial Sustainability and Resilience Resource Sustainability Sustainable Human Settlement Active Citizenry Smart City Green Economy SMME and Entrepreneurial Support Input To Human Capital Development and Management Strategic Communication and Marketing Urban Water Management Agriculture and Food Security Safer Cities Investment attraction, retention and expansion Draft 3 Page 13

14 SECTION 3.3: THE FOCUS AREAS In the midterm review of the IDP the following Strategic focus areas until 2016 were agreed on: The 5 year IDP is translated into one year plans which are called the Service Delivery Budget Implementation Plan (SDBIP). City Power s is aligned to programmes that ensure attainment of the SDBIP. Focus Areas Game Changer Flagship Programme COJ Program Communications & Stakeholder Management Corridors of Freedom Smart City Green/ Blue economy City Power Programme Stakeholder Engagement Infrastructure Plan & maintenance: COF Infrastructure Plan & maintenance: Smart Grid DSM City Power Projects City Power therefore needs to: 1.Communicate, promote and profile capital projects that the company is doing. 2.Communicate the value of smart meter projects in line with the development of a smart city 3.Inform customers about planned and unplanned power interruptions (through alerts) 4.Educate customers about the value of taking ownership of the electricity network within their communities. 5.Inform customers about the dates and times during which City Power will read or audit electricity meters. 6.Educate customers about the importance of paying for their services 7.Profile service delivery projects of the city within specific local areas. 8.Inform customer about community empowerment projects such as Jozi@work as well as community investment projects. Hursthill Sub Station Upgrade Sandringham Sub Station Perth Empire Corridor Distribution Networks Phase 1 Turfontein Corridor Distribution Networks Phase 1 Wemmer and Industria Feeder Boards Replacement Smart meter roll out ICT Network Upgrade to Telco Grade Last Mile Network Outage Management and Network Automation (ADMS) SAP HANA Upgrade with ISU Energy Management (Including DSM And SSM) Draft 3 Page 14
15 Focus Areas Core Mandate COJ Program Service Delivery Elevation City Power Programme Revenue Recovery Project Outage Management Security of Supply Projects City Power Projects Improve Service Charge Improve Meter Reading performance Reduce Non-Technical Losses Network conditioning of Transmission networks, MV networks, LV networks and OHL s, Street lighting and Secondary Plant Roll out of ABC Ripple Control Smart Meter - Load limiting Solar Water Heaters Demand Response - Large Customer Participation Domestic TOU Tariff Virtual Power Station: Photovoltaic Generation (IPP), Photovoltaic Generation (Own), Stand-by Diesel Generators, Co/Tri-Generation, Waste to Energy, Solar Water Heating & Battery Storage City Power is committed to the key focus areas however as a result of the high vacancy rate (more than 50%), service delivery is being affected adversely due to capacity shortages. Budget to fill these critical vacancies is not available which exacerbates the issue Draft 3 Page 15
16 SECTION 3.5: GDS IDP 5 Year Plan City Power is wholly own by the COJ. The KPIs that are monitored by the organisation have to be aligned to those of the shareholder. The 5 year IDP is translated into one year plans which are called the Service Delivery Budget Implementation Plan (SDBIP), SDA and the MMC scorecard. PIP CP IDP Programme Impact on Community KPI Unit Plan 2014/15 Budget 2014/15 Plan 2015/16 Budget 2015/16 Plan 2016/17 Budget 2016/17 Plan 2017/18 Budget 2017/18 Active engaged citizenry: Communication & Stakeholder Management: Communicati on & Stakeholder Management : Improve customer and stakeholder experience Customer Satisfaction Survey Achievement of SLA Index 65 Opex: R33. 9 mil Capex: R59 mil 70 Opex: R54.6 mil Capex: Capex: % R25 mil 80 R25 mil Opex: R64.6 mil 70 Opex: R75.8 mil Capex: R25 mil Flagship: Corridors of Freedom Refurbishme nt of ageing infrastructure Expansion and Strengthenin g of Network Improved network performance and quality of Supply More people with access to electricity, Economic growth Average age of infrastructure (HV) Additional Capacity Years 39 Opex: R579.5 mil Capex: R35 mil 39 Opex: R 280.8mil Capex: R 108 mil for COF Electrifica tion R276mil 38 Opex: R378.7 mil Capex: R mil for COF, Electrifica tion R75mil MW Electrification Number Provision of public Lights Number Opex: R353.2 mil Capex: R 120 mil for COF, Electrifica tion R75mil Jozi@Work Jozi@work Job creation, Poverty reduction R&M spent on % J@W Opex: Opex: Opex: R30.7 mil R37 mil R50.9 mil Capital spent on % 5 Capex: 5 Capex: 5 Capex: 5 J@W R18 mil R 24 mil R168 mil EPWP Number Opex R 64.9 mil Capex: R180 mil Draft 3 Page 16
17 PIP CP IDP Programme Impact on Community KPI Unit Plan 2014/15 Budget 2014/15 Plan 2015/16 Budget 2015/16 Plan 2016/17 Budget 2016/17 Plan 2017/18 Budget 2017/18 Socioecono mic Developmen t 50% black owned companies % % women owned company % Energy mix MWh 7 029, , ,25 Flagship: Green/ Blue Economy Security of supply/ Demand side management Improved security of supply Reduction in GHG t CO2e/MWh 7 892,30 Opex: Opex: Opex: 26105,30 R302.6 R211 mil R112 mil Solar water mil Number Capex: Capex: heaters Capex: R0 mil R 0 mil R20 mil Ripple relay roll Number our Opex: R112 mil Capex: R0.5 mil Flagship: Smart City Smart Grid Improved customer and stakeholder experience Meter rollout Number Opex: R 159 mil Capex: R928 mil Opex: R260 mil Capex: R 220 mil Opex: R268 mil Capex: R 145 mil 0 Opex: R280 mil Capex: R227 mil Core mandate: Sustainable Human Settlement Service Delivery improvement Improved Service Delivery Street lights TAT Days 2 Outage reduction MV (all) Outage reduction HV (all) HV Outages: NPR Number 76 Opex 74 Opex 74 Opex: 74 NRS 047 R1 033 R R1 200 % Compliance mil mil mil 95 NRS 048 Compliance % Restoration time: 1.5 hours % Restoration time: 3.5 hours % Number Number Opex: R mil Draft 3 Page 17
18 PIP CP IDP Programme Impact on Community KPI Unit Plan 2014/15 Budget 2014/15 Plan 2015/16 Budget 2015/16 Plan 2016/17 Budget 2016/17 Plan 2017/18 Budget 2017/18 Core Mandate: Financial Resilience and sustainability Revenue Revenue Recovery Programmes Improved customer and stakeholder experience Restoration time: 7 hours Restoration time: 24 hours No of households with access to basic electricity Number of prepaid customers Payment levels (current consumption) Meter reading performance Losses (technical & non-technical) % % Number Number % Opex: Opex: % 96 R Opex: R R589 mil mil mil % 13,5 13,5 13,25 13,25 Opex: R671.9 mil % of ESP customers with FBE provided % Resource sustainability, safer city, governance Business efficiency and effectiveness DIFR Ratio 1 ISO accreditation Attainment of a clean audit report Audit report Audit report Clean audit report Opex: R377 mil 1 Clean audit report Opex: R487.5 mil 1 Clean audit report Opex: R448.5 mil 1 Clean audit report Opex: R478.8 mil Draft 3 Page 18
 and the Gauteng 2055.")

19 SECTION 4: PERFORMANCE PLAN SECTION 4.1: STRATEGY MAP City Power strategic direction that is highlighted below is aligned to the GDS 2040 which is aligned to the National Development Plan (NDP) and the Gauteng The picture below shows the vision, mission, values, and business operating principles of City Power. Vision To be a world-class energy utility What Business Are We In? We are in the business of producing and distributing energy. Mission The mission of City Power Johannesburg SOC is to meet the expectations of our customers and stakeholders by: Providing a sustainable, affordable, safe and reliable energy supply Providing prompt and efficient customer services Being the preferred equal opportunity employer by developing and incentivising our employees Undertaking our business in an environmentally acceptable manner Aspired Values Resourceful Resilient Reliable Respectful Always with Integrity Business Operating Principles Customer-centric organisation Seamless value chain driven organisation Zero tolerance for poor performance Doing business in an ethical manner, zero tolerance for fraud and corruption Business case driven investment decisions Maximum technology enablement Doing it right the first time Strategic priorities People Service Service Infrastructure High Performing teams, customer centric, SHEQ Social transformation, quality of service, SHEQ Network refurbishment & development, asset maintenance, DSM, alternative energy sources, infrastructure security, SHEQ Draft 3 Page 19

20 Draft 3 Page 20
21 SECTION 4.2 COMPANY PERFORMANCE SCORECARE The Company Business Performance Compact is a comprehensive and balanced scorecard that allows the Board to monitor and review the Company s performance throughout the year, to ensure attainment of shareholder priorities and mandate. There are four perspectives in the scores which are Financial, Customer/Stakeholder, Internal Process and Learning and Growth Perspective. Financial Perspective The objective of this perspective is to increase financial resilience and sustainability of the business. The following two KPIs have been deleted from the scorecard: Net Cash generated from operating activities and Gross Profit %. They have been replaced by the Historical revenue recovery KPI in alignment with the prioritization of revenue recovery and protection strategic objective. PIP Value Proposition Outcome Scorecard Measure/ KPI Uom Weight Actual Targets Projects COJ Alignment 2013/ / /16 Financial Resilience and Sustainability Reduce Losses Improved Revenue Collection Optimise Capex Spend Reduce Total losses Recovery of Historical Revenue Total Capex Spend as % of Targeted Capex Spend Reduce Total losses Historical revenue recovery Total Capex Spend as % of Targeted Capex Spend % ,5 13,5 Revenue Recovery Rbn 10 New 1 1 Project % Infrastructure plan and maintenance Aligned to SLA and revenue protection and enhancement including Meter reading performance, Aligned to roll out of infrastructure as per approved plan and 95% Capex. Including Spent on: PL, SWH, COF, meters, Electrifications Draft 3 Page 21
22 Customer/stakeholder Perspective The objective of this perspective is to improve customer and stakeholder centricity and ensure active citizenry. The following KPIs have been elevated to ensure alignment with the outage management strategic objective: Street lights TAT, Outage Reduction, HV (All), Outage Reduction, MV (All), Restoration time: 1.5 hrs, Restoration time: 3.5 hrs, Restoration time: 7 hrs, Restoration time: 24 hrs. PIP Active engaged citizenry, green economy, sustainable human settlements, smme and entrepreneur development and support & Resource sustainability Value Proposition Improve customer and stakeholder experience Quality supply and service Promote Energy Efficiency Promote Energy Efficiency Outcome Scorecard Measure/ KPI Uom Weight Actual Targets Projects COJ Alignment Meet customer charter expectations on street light TAT Reduce number of outages Improve restoration time: % of outages restored with specified time Reduction in Green House Gases Reduce Energy Consumption 2013/ / / 16 Street lights TAT Days Infrastructure plan and maintenance Aligned to SLA and Customer Charter Outage Reduction HV (All) Number COJ Scorecard measures HV Outage Reduction MV (All) Network performance related only Restoration time: 1.5 hrs % As per NRS047 and Restoration time: 3.5 hrs SLA Restoration time: 7 hrs Restoration time: 24 hrs GHG t CO2e/ MWh , , ,3 Energy Plan Aligned to roll out of infrastructure as per approved plan and 95% Capex. Including Spent on : SWH Energy Mix MWh Draft 3 Page 22
23 PIP Value Proposition Improve Customer and Stakeholder Experience Socioeconomic Development Quality Supply and Service Quality Supply and Service Outcome Scorecard Measure/ KPI Uom Weight Actual Targets Projects COJ Alignment Improve Customer / Stakeholder Satisfaction Socioeconomic Development (SED) Maintain High Quality of Service Levels Maintain High Quality of Supply Levels 2013/ 14 Satisfaction Index % % Stakeholder Plan Aligned to Game Changer principles, SLA and Customer Charter. SED Index % 5 52, Jozi@work Aligned to R&M and Capital spent on J@W as per MMC Scorecard Maintain High Quality of Service Levels (NRS 047 Index %) 2014/ / 16 % 5 75, Infrastructure Plan and Maintenance NRS 048 Index % Ensures attainment of SLA and customer charter Satisfaction Index: This is calculated based on the weighted results of CoJ s Customer Satisfaction Survey, as well as an external media monitoring report. City Power will be conducting their own Customer Satisfaction Survey going forward. Socioeconomic Development Index: This is calculated on the weighted results of the following KPIs: 50% Black Owned; 30% Black Women Owned; and Jozi@work. This KPI responds to the socio economic needs of the country by focusing on community development and job creation. City Power will be awarding bursaries to deserving students in the Engineering fields; however other fields will be addressed in line with CP need. Youth development forms part of this KPI in that indigent learners will be assisted from Primary school to Tertiary. A concerted effort will be made to ring-fence positions for AA, GE and People with Disabilities Draft 3 Page 23
24 NRS047: The city measures performance of all services together, except technical failures. Electricity related performance is therefore not measurable. NERSA requires 95 % compliance for electricity services only. Since other services are included in the performance, the NERSA requirement cannot strictly apply and instead the target is informed by the actual calculated based on the previous years performance. NRS048: NERSA has introduced a new version of NRS048 standards which are comprehensive and more stringent than the previous version. Owing to this revision and increased stringency, the targets have been reduced to align with the NERSA 95% requirement, and are lower than past performance. City Power is in the process of reviewing our NRS 048 reports in line with the new requirements. (The new reporting format will be presented to internal approval authorities). Internal Process Perspective The objective of this perspective is to ensure efficient and effective processes and systems to meet Service Delivery and Compliance requirements. The DIFR KPI has been elevated in line with the prioritisation of SHEQ. PIP Value Proposition Outcome Scorecard Measure/ KPI Resource Sustainability, Safer City, Governances Manage Core Value Chains, Asset Management, Optimise ICT, Infrastructure, Data Management, Governance, Risk, Compliance Monitor and improve employee safety Monitor and Improve Compliance and Assurance Uom Weight Actual Targets Projects COJ Alignment Year 13/ / / 16 DIFR Ratio Data Quality Management Compliance and Assurance Index Number 70 2,5 3 3 Aligned to Governance and Compliance Compliance and Assurance Index: This KPI is calculated based on a weighted average of ISO accreditation and attain a sustainable unqualified audit. The target for this index is that the organisation keeps its ISO certification and obtains an unqualified audit. Draft 3 Page 24
25 Learning and Growth Perspective The objective of the perspective is to enable maximum employee productivity whilst conducting business in an ethical manner. PIP Value Proposition High Performing Teams Outcome Improve Team Performance Scorecard Measure/ KPI High Performance Team Index Uom Weight Actual Targets Projects COJ Alignment 2013/ / /6 % High Performing Teams Resource Sustainability High Performance Team Index: This KPIs is Weighted average of the following sub-metrics: Job Vacancy Rate %, Individuals PA Scores Submitted %, Satisfaction Survey Rating, Targeted People Trained as per Skills Plan %, Youth Development; EE: AA; EE: GE and EE: PWD. The rationale for this KPI is to ensure consistent and optimum level of performance at individuals, team and Company levels. The responsibility of HR is to empower facilitate the relevant processes and ensure common understanding. Youth development forms part of this KPI in that indigent learners will be assisted with bursaries. A concerted effort will be made to ring-fence positions for AA, GE and People with Disabilities. Draft 3 Page 25
26 SECTION 5: BUSINESS OF TODAY SECTION 5.1: GAME CHANGER Positioning/Problem Statement Citizens do not trust the city s ability to deliver services and commit to promises; we need to gain this trust and sustain it. Positive Experiences breeds confidence, confidence breeds trust, trust breeds advocacy, advocacy creates brand We need to leverage communication to improve the citizen s perception of delivery in order to drive a more pro-active citizen experience and perception of Johannesburg. To build confidence, reduce citizen complaints and increase satisfaction, delivery of these will require focus and acceleration. Current vs. Future Service Performance Basic Services Turnaround time Promises according to the charter (average) Actual value for for July/August 2014 (average ) No of citizens promises not met Estimated Improvement Targets by June 2014/15 Q Installation and Maintenance of 2 days >30 days Public Lights 2 Installation and Maintenance of 4 hours >30 days hours Infrastructure for Uninterrupted Power Supply 3 Removal of Illegal Connections 24 hours >30 days hours 4 Replacement of Faulty Meters 7 days >30 days days 5 Prepaid meter Conversion 5 days >30 days days 6 Meter Reading 95% 75.58% (domestic) 69% (LPU) N/A 95% 7 Installation of New Service 21 days >30 days days Connections Draft 3 Page 26
27 Failure in moments in truth damaging citizen perception Basic Service 1. Installation and Maintenance of Public Lights Moments of Truth Channel of Interaction Impact (examples of possible set-backs) Reporting a fault Apply for new public light Applying to fix Phone call centre Log a fault on the web Visit walk in centre Twitter Call centre: citizen might not be able to reach them The application process may cause a budget issue The time to fix may not be as promised 2. Installation and Maintenance of Infrastructure for Uninterrupted Power Supply Reporting a fault or notification of planned outage Phone call centre Log a fault on the web Visit walk in centre Twitter There is a risk that the citizen s power might still be off The citizen might not get the notification of planned outage The notification might be dropped at house at a time when the citizen is not aware 3. Removal of Illegal Connections Report illegal connection Phone call centre Log a fault on the web Visit walk in centre Twitter Turnaround time may not be promised The citizen is at risk of losing money (connection could have been stolen from their house) 4. Replacement of Faulty Meters Reporting faulty meter a Phone call centre Log a fault on the web Visit walk in centre Twitter The citizen is put at risk of security if they are found to be reporting faults that s have been tampered with illegally 5. Prepaid Meter Conversion Applying for prepaid meter conversion Walk in centre: Apply, get a quote, pay The citizens application may be lost during the process The citizens application may be incomplete The time taken to bring the meter may be longer than expected The new meter might not be working 6. Meter Reading Request meter reading Estimation of meter reading on account Phone call centre Log a fault on the web Visit walk in centre Twitter (meter readings) The message may not be convey which could lead to the request not being carried out The technician may not be polite The technician may not be a legitimate meter reader The reading could be set to high and the citizen will lose money 7. Installation of New Service Connections Application, quote, payment Walk in centre: Apply, get a quote, pay The citizens application may be lost during the process The citizens application may be incomplete The time taken to bring the meter may be longer than expected The new meter might not be working Draft 3 Page 27

28 Transformation plan to improve Citizen Experience Draft 3 Page 28
29 Communication Objectives The communication plan will: Promote a consistent voice, appropriate timing/frequency, and method of tracking message delivery Build initial awareness and understanding of proposed citizen Experience Transformation with targeted audiences Build Initial Awareness Engage the business to participate in Early Win validation Provide Executive Leadership with insight into project progress to-date and next steps Expand solid communications platforms that support business process and Provide Leadership Insight Empower the Project Sponsors Leadership to engage the business in productive conversations around the transformation Empower Project Sponsors Engage the Business Promote a Consistent Voice Expand Communications Platforms Objectives Empower project managers Increase awareness of City power projects Ensure that citizens are aware of company projects taking place in their communities and their value to citizens Engage citizens Engage citizens and communities in the projects taking place in their areas Engage employees Engage employees in the communications with fellow employees and citizens to ensure that they become company ambassadors Draft 3 Page 29

30 Communication guiding principles Timely and stakeholder specific messages, no communicating just for the sake of communicating Consider the regional communication needs and tailor where appropriate Use True Grit leadership communications no fluff Create consistency of voice one message, one voice Establish a communication advisory group representative of key constituents or those who lead them Engage the City Power leadership team as key communicators Leaders will always be in the information loop first before general communication, with as much advance notice as possible Provide communication training support and tools for the City Power leadership team Draw upon current communication tools and channels where possible Personalize communications e.g. What is in it for me? How does it impact me? Create High Touch Emphasize a more personal connection and team-building approach Two-way communication is essential at least 50% of communication should contain an opportunity for response or dialogue Communication and change continuum Draft 3 Page 30
31 Key stakeholders Internal Stakeholder External Stakeholders Change champions Group heads Group executive management committee meetings Depot managers meetings eam leaders meeting Local labor forum Employment equity forum The Executive Mayor The MMC The Managing Director Public Relations and Communications Group Heads Customer NERSA City of Joburg Key messages Listen to the citizens Be clear on what the citizens want Design a road map on what we are going to do about it Deliver on that road map Constantly keep the citizens informed Commitment to service delivery Be in touch with citizens in terms of products and services; smart meters, tariffs and projects We will take the promises we make seriously as per the customer chart Communication channels Internal to City Power Electronic media Notice boards Newsletters Kganya, Powerflyer and Scamto Bathroom notices; Road shows Knock & drops Street pole advertising Mobile trucks Print media Broadcast media Local media Social media Sms s Draft 3 Page 31

32 Draft 3 Page 32

33 SECTION 5.2: FLAGSHIP PROGRAMMES SECTION 5.2.1: CORRIDORS OF FREEDOM Bulk Infrastructure Programme In the electricity distribution business, the Bulk Infrastructure refers to expansion, refurbishment or reliability programmes undertaken to allow for downstream network developments. City Power has embarked on several programmes including aerial bundle conductor, smart meters and telecommunication network. The expansion in electricity infrastructure is driven by population growth, load increase and economic growth patterns. To determine demand growth scenarios, City Power meticulously studies various data sets such as: Socio Economic Model Census 2011 data Sustainable Human Settlement Urbanisation Plan Assessment of base loads and historic growth patterns Urban Development Boundary Regional Spatial Development Framework Both Eskom and City Power are responsible for supplying electricity to customers within City of Johannesburg. The map depicted in the diagram below shows the geographical footprint of Johannesburg with City Power supply areas shown in white, while the hatched areas represent Eskom supply areas. Electricity supply authorities within the City of Johannesburg Draft 3 Page 33


34 The demand in City Power s supply areas is expected to grow from the current 3500MVA to 5000MVA over the next 20 years. The 20-year master planning study conducted in 2012 suggests that the highest growth rate is to be expected in areas such as Randburg, Midrand, Mooderfontein, Roodepoort, Sandton and Ennerdale. Demand growth patterns in the City of Johannesburg Council The size indicators of City Power s electrical infrastructure are shown in the figure below. A total of approximately 420,000 customers are supplied via 268 substations and 8,342km of circuit length. The total asset value of City Power s sub-transmission network is estimated at R14 billion. City Power s electrical infrastructure in numbers Several substations and underground cable circuits are planned for constructed in the next 10 years, including Sebenza and Quattro substations with combined capacity of approximately 2000MVA. The graph below depicts investments in City Power s capital programme from Draft 3 Page 34
35 CAPEX Budget (R'000) Earlier Years 2004/5 2005/6 2006/7 2007/8 2008/9 2009/ / / / /14 City Power s capital programme City Power s infrastructure plan and maintenance programme on CoJ s Transit Oriented Development (TOD) has the following capital projects: New substation for the Westgate precinct at an estimated cost of R 110 M Sebenza will be situated in the North-East of Johannesburg adjacent to Kelvin Power Station and Quattro in the South West of Johannesburg in the vicinity of the old Orlando Power station site at an estimated cost of R2 billion combined Eskom s transmission networks will also need to be extended to supply our planned 275/88kV intake points at both Quattro and Sebenza. Hursthill Sub Station Upgrade New Sandringham Sub Station Perth Empire Corridor Distribution Networks Phase 1 Turfontein Corridor Distribution Networks Phase 1 Louis Botha Corridor Distribution Networks Phase 1 Wemmer and Industria Feeder Boards Replacement Public lighting and electrification programme Draft 3 Page 35
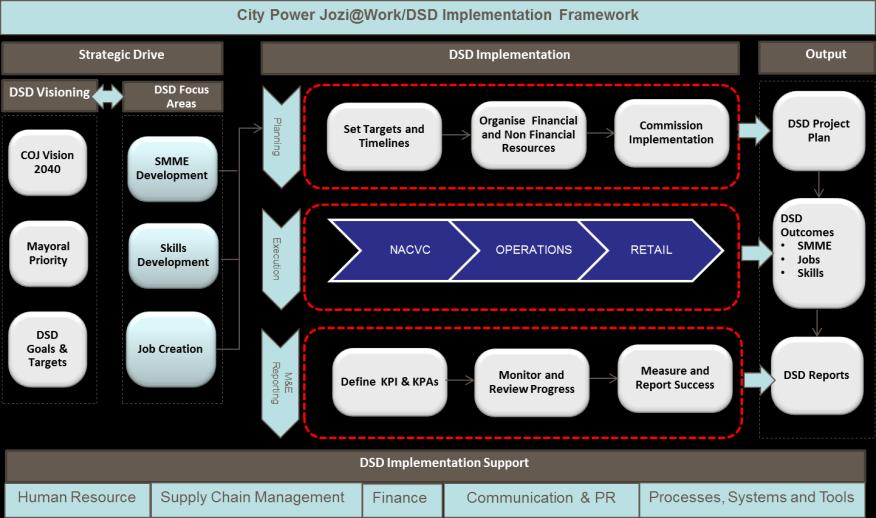
36 SECTION 5.2.2: is a new programme run by the City of Johannesburg. It aims to reduce poverty, inequality and unemployment across the City. It will change the way the City does business and also equip communities to respond to problems in their own back yards and be paid for doing it. The programme works through the City paying co-operatives and community-based companies for work packages which improve the delivery of CoJ services in their neighbourhood and the region in which they live. In this way, jobs /livelihoods will be created for those who are members of co-operatives, partners in micro-companies or workers employed by the co-ops or companies doing the work. For City Power, the objective of the Jozi@work programme is skills development, SMME development, localisation, industrialisation and job creation. The Jozi@work programme includes the Community One Stop Service (Motlakase project), energy efficient street lights and other job creation projects. Jozi@Work comprises of various Developmental Service Delivery initiatives that are key to enabling the success of the City of Joburg strategic imperatives. Key to these initiatives is the requirement to create jobs and uplift previously disadvantaged communities. In broad terms, Jozi@Work local development programmes are seen to have five objectives as follows: Skills Development enhancing/ uplifting the skills of the local communities in order to ensure benefit from City Power capital projects or any other new initiatives. This is the requirement that participating suppliers commit to train certain individuals in specified trades. SMME Development affording development opportunities for small and medium enterprises through City Power expenditure. Localisation define and enforce requirements for City Power suppliers and service providers to foster localisation of goods and services procured/sourced by City Power. Industrialisation investment in local manufacturing plants for sustainable local supply of long term physical requirements. Job Creation define requirements for City Power suppliers and service providers to create both temporary and sustainable jobs with the City of Joburg boundaries for goods and services sourced/procure by City Power. The ultimate goal for Jozi@Work initiatives is to ensure socio-economic upliftment of communities in which City Power provides services as well as development of small business enterprises through localisation and development of sustainable industry, through industrialisation. Against this background, the City Power Jozi@Work Vision is as follows: To achieve maximum and sustainable local developmental impact, through leveraging City Power s procurement spend and services, in a manner that embraces socioeconomic realities of local communities. Geographical Areas The priority areas for the Jozi@Work initiatives are areas that have less developed infrastructure as well as high population density. This is illustrated in the figure below. Draft 3 Page 36


37 Current Spread of Economic Activity The area with less economic activity and subsequently output is in the southern part of Johannesburg. This is further illustrated by the population density spread in the diagram below. Population Density Spread The area highlighted in red (Region G or South of Johannesburg) has the highest population density with the lowest levels of employment and relatively high potential for skills development. As a result, City Power will focus on such areas as priority for the Jozi@Work initiatives roll-out. City Power Jozi@Work Framework The City Power s Developmental Service Delivery framework and implementation approach are illustrated in the diagrams below. The model proposes possible areas of exploitation for social development within the scope of City Power department core functions, as well as proposes the high level operational workflow from conception, realisation and close out of the proposed interventions. The key elements of the model provide for: 1. a basis for City Power project managers to contract social development objectives with companies engaging in business activities with City Power; 2. a basis to uplift the communities serviced by City Power and a 3. a logical and sustainable approach to realisation of social development objectives Draft 3 Page 37
38 INPUTS CITY POWER DSD DRIVERS: DSD / Jozi@Work IMPLEMENTATION FRAMEWORK DSD Opportunity Identification & Pre-Feasibility Studies OUTPUTS - CoJ Vision Mayoral Priority - Strategic Objectives - DSD Goals & Targets DSD FOCUS AREAS / VALUE CATEGORIES: CONCEPT Define Project Objectives & Scope Identify DSD Opportunities within Project Align Opportunities to Policies & Strategic Objectives Validate & Classify Opportunity in terms of DSD Focus Areas DSD Opportunities Identified - Skills Development - SMME Development - Job Creation - Localisation - Industrialisation DSD OPPORTUNITIES DEFINITION Evaluate Execution Risks & Impact of previous lesson s learnt Develop a DSD Execution Plan from Identified Opportunities Define Solution KPI s & Performance Controls for Monitoring & Evaluation Develop DSD Execution Plan Validate / Refine Solution with Stakeholders & Set DSD Targets Compact / Contract DSD Targets DSD Execution Plan DSD IDEA HUB: Implement Project & Realise DSD Opportunity 1) CAPEX Projects 2) OPEX Projects 3) Green Energy Initiatives 5) Vendor Development 6) Employee Registrations 7) Bursaries, Learnerships 8) Apprenticeships 9) Mentorships 10) Training Courses (Internal & External) DSD ENABLERS CITY POWER DSD ENABLING AREAS: Eng. Services, Ops, Retail, HR, RAC, SCM, Core Value Chains EXECUTION CLOSE OUT Execute Project Evaluate & Quantify Project Benefit Realisation Monitor & Track Progress according to Compact / Contract Identify & Log DSD Execution Risks Close Out DSD Project & Consolidate Results Ensure Effective Project Closure Develop DSD Close Out Report Identify & Log DSD Lessons Learnt Report on Progress of DSD Target Realisation DSD Objective Realisation REPORTING Project Level Group Level Company Level Other Identified DSD Performance Reporting Platforms (Internal & External) Internal Controls: - Templates - ToR - Tools - Monitoring & Evaluation Governance: - DSD Idea Hub - DSD Policy - DSD Framework - DSD Structure IT Support - Data Management: - Data Sources - Data Repository - Data Capture Systems SUPPORT IT Support Information Systems: - Business Intelligence - Automatic Consolidation of Company Wide DSD Efforts Change Management: - Implement - Sustain - Improve Internal Capability Building: - Training - SME Development City Power DSD/Jozi@Work implementation approach Draft 3 Page 38
39 City Power Framework Draft 3 Page 39
40 The primary driver for the identification and implementation of (DSD) initiatives is the GDS 2040 vision, the Mayoral Priorities as well as the strategic imperatives. Thus City Power initiatives will be implemented to address these focus areas. The opportunities within City Power arise primarily from capital expenditure projects. Other opportunities can be exploited from operational expenditure projects as well as new initiatives which are aligned to the need to move towards sustainable sources of energy. Proposed City Power Initiatives The identification of initiatives is a process that aligns completely with the strategic imperatives of the City of Joburg. This is accomplished through the alignment of initiatives to the Priority Implementation Projects (PIP) categories. Core Business The tables below indicate the projections in terms of the Jozi@Work social development objectives. Capability Service Agent (CSA) 2013/14 Forecast 2014/15 Projections 2015/16 Projections Skills Development SMME Development Outcome Training of artisans and electricians by principal contractors during project construction (1) SMMEs trained in managing and growing business. (2) SMMEs developed to start participating in more intensive, specialised functions on capital projects Risks in Achieving the Outcome None None Activities New Initiatives City Power has seven new work packages presented to five of seven regions. On the 05 May 2015, region G steering committee will be hosting City Power and region B is still outstanding (no date as yet). CITY POWER ONE STOP SHOP (CONTROL CENTER) - ENERGY SPAZA - WORK PACKAGE No: CP/001 Estimated Estimated Jobs to Number Regions (Number of Jobs to be created) created of SMMEs 2014/15 (projected to increase by 5 10% in 2015/16) Minimum- Not less than Minimum- Not less than A B C D E F G TOTAL Estimated Jobs(Activity) Department Maintenance of SWH Maintenance ± 10 ± ±380 HR (Training) Online Fault Logging Retail ± 5 ± (Training) Electricity Theft (reporting) ± 5 ± ±70 Retail/ Revenue Protection Electricity Education ±10 ± ±210 Retail Communication (Ripple Relay) Draft 3 ±10 ± ±300 Execution/ Retail TOTAL Estimated- ±17 ± Page 40
41 Work Packages - From Installation of Protective Structure (CP/002) Installation of Ready Boards (CP/003) Sporting of fault Street Lights (CP/004) Removing of illegal electricity connections (CP/005) Trenching & Road drilling (CP/006) Cleaning of Substations depot - Vegetation (CP/007) Estimated Jobs to created Minimum- Not less than Estimated Number of SMMEs Minimum- Not less than CITY POWER WORK PACKAGE No: CP/002 CP/ 006 Regions (Number of Jobs to be created) 2014/15 (projected to increase by 5 10% in 2015/16) A B C D E F G ± 20 ± / ±534 ± 10 ± ±300 ± 5 ± ±10 ± /2 ±15 ±7 105 /3 100 /3 105 /3 100 /2 105 /3 X /3 105 / /2 105 /3 105 /2 X2 50 ±325 TOTAL Estimated Jobs(Activit y) Department Execution & Planning Execution & Planning (Elec -PL) Maintenance & PCM 100 ±417 Revenue Protection & Risk Control 105 /3 ±263 ±5 ± ±105 TOTAL Estimated- ± ±1,944 Execution & Planning Maintenance (Parks) As part of Jozi@Work, there are several initiatives that City Power is pursuing with intent to participate meaningfully in the green economy and to create sustainable jobs. These include distributed battery storage at substations, retrofitting government owned buildings with energy efficient equipment, photovoltaic plants and electricity generation from existing water reservoirs as well as socioeconomic upliftment in identified communities. The following are future City Power s proposed initiatives (City Power Jozi@work wave 2). Draft 3 Page 41
42 2016/17 Projections increase City Power Updated Business Plan Capability Service Agent (CSA) 2015/16 Forecast No of SMMEs Renewable Energy 7 5% Awareness Campaign (No to Corruption) 7 5% Security Services (pending approval) - - Welding of Street light Pole Covers 14 10% Re-painting of Load Centres and Poles 14 10% SMMEs to be trained on how produce underground protective structure plinth 7 3% Miniature substation plinth 5 3% Cable drums 3 5% Distributed Substation Storage Outcome Training of artisans and electricians by CSAs during project construction SMMEs trained in managing, reporting and growing business. SMMEs developed to start participating in more intensive, specialised functions on capital projects Reduced number of non-technical loss. Reliable and continuity of electricity supply. Cable theft and hotspots areas. SMMEs trained in community mobilisation on antistreet light pole covers theft awareness campaign. SMMEs developed to start participating in more intensive, specialised functions on new technology and innovations. Exiting load centres and poles which require repainting. Trained SMMEs through CSAs to provide the services. Trained communities in producing protective structure plinth. City Power to develop a service level agreement: to be signed with by CSAs, City Power and the suppliers (condition of supplying City Power with structures). SMMEs trained (By CSAs & Supplier) on how to produce miniature substation/ring main unit (RMU) plinth. City Power to develop a service level agreement: to be signed by CSAs, City Power and the suppliers Trained carpenters on how to produce cable drums. City Power to develop a service level agreement to be signed by CSAs, City Power and the suppliers. Risks in Achieving the Outcome None Support from internal stakeholders Delay in approving the concept (internally) None None Failure to agree on terms and reference - conditions (SLA) Failure to agree on terms and reference - conditions (SLA) Failure to agree on terms and reference - conditions (SLA) Battery storage plants are designed to store energy from intermittent sources of energy such as wind and solar photovoltaic (PV) to enable the grid or the load to use stored energy during times when the natural resource is not available. An opportunity exists to reduce the amount of energy purchased from Eskom during peak hours in line with the objectives of a virtual power station. The essence of the opportunity is as follows: During peak hours, a proportion of the energy purchased can be sourced from the battery storage plant The batteries can be charged during off-peak hours when the unit cost of energy is lower. The batteries can also be charged using solar PV to lower the charging costs even further. Draft 3 Page 42

43 A large penetration of these distributed storage plants has potential to substantially reduce City Power s demand. In addition, battery storage plants can be installed selected customer categories to delay the impact of an outage on the customer. The figure below illustrates the potential applications of distributed battery storage facilities. Potential applications of battery storage facilities Community One Stop Service ( Motlakase ) The City of Johannesburg in-line with the Kyoto Protocol and the summit started with initiatives to make the City greener. This would create a significant reduction of carbon emissions. One of the initiatives was to roll-out Solar Water Heaters in the City Power area of supply. Over Solar Water Heaters have been installed in different areas. In Devland, 3500 solar water heaters were installed. Devland also has 320 street lights. Participating residents will have the opportunity to maintain solar geysers, control vegetation and perform the spotting duties to maintain public lights. The objective of the project is to train and empower the participating residents in the following disciplines: Solar Geyser Maintenance Vegetation control Identification and reporting of faulty public lights (spotting) Reporting of illegal connections Vending of prepaid electricity tokens In alignment with COJ PIP on Sustainable Expanded Public Work Programme; City Power Johannesburg is embarking on up-skilling and empowering the participating residents of Devland. This new skill will enable communities to play a partnership roll with the entity and the City. The skills gained will empower residents to become competent in maintaining solar geysers. Additionally spotting of street lights and vegetation control will also be in their area of influence. The development will result in improved sense of ownership and pride as residents will be appointed to areas in which they are competent. This will reduce unemployment in the community and promote economic activity in the area. Draft 3 Page 43
44 New Initiative Project Description Current Project Stage Community One Stop Service ( Motlakase ) Energy efficient street lighting Solar Park at City Power Reuven Offices Conduit Hydropower Battery Storage Empower Community co-op companies to perform 1 st line & 2 nd line maintenance on SWHs, streetlights, report illegal connections and sell prepaid vouchers Change conventional street lighting luminaires to energy efficient lighting combined with automated streetlight monitoring Demonstration site at Reuven offices. Convert parking to a solar farm for internal use Small-scale hydropower systems for self-use, isolated demand or grid export. The generation opportunity lies at inlets to service reservoirs or in the distribution network where excess energy is dissipated (typically with pressure reducing valves) Reduce City Power s demand through local supply during peak hours in line with the objectives of the virtual power station concept Devland pilot has been developed Development of specification Conceptual study Supported Work Objectives Job Creation - 5 community members per deployment Skills Development - Certify 10 trainee's per deployment. Job Creation Logistics, installation & maintenance Job Creation Maintenance of Solar Park Conceptual study Job Creation manufacturing, logistics & maintenance Conceptual study Industrialization attract investment in local manufacturing (potential new market). Job Creation manufacturing, logistics & maintenance 2014/15 Targets Expand the concept to 30 wards Roll out project in 40 streets Feasibility studies (±R5 million) Detailed studies (±R6 million) Detailed designs (±R2 million) 2015/16 Targets Expand the concept to all 110 wards 100 streets 1 pilot site (±R20 million) 1 pilot site (±R8 million) 1 pilot site (±R12 million) Draft 3 Page 44
45 SECTION 5.2.3: GREEN/BLUE ECONOMY The Blue Economy principle is a pro-active approach showcasing initiatives within the City that has the power to create sustainable livelihoods through the generation of income and jobs using local resources within the City. Although the use of Direct Current (DC) technology is not common practise in South Africa, the concept provides many opportunities. Under this category, there following interventions need consideration: Developing a framework for Direct current (DC) distribution in the City of Johannesburg; Approaching the standards authorities to initiate discussions on which specifications are likely to be required for the application of this technology; and Partnering with Academia to look at opportunities to explore business cases and taking advantage of the information available with Blue economy partner institutions. City Power will focus on a number of applications that will echo the Blue economy principles and the promotion of energy efficiency technologies. Within this project, the following programmes will be explored: Identified sites for the deployment of these technologies as pilot studies (eg. Retrofitting buildings and rooms at City Power, installations in upmarket sectional titles using the PV panels and USB-C applications as well as in areas that have no electricity); The use of DC power systems within substations, The use of DC systems to integrate distributed generation sources as DC technology; The use of DC systems for the bread ovens in identified business hubs; and The application of providing a DC solution to traffic lights in the event of load shedding. As a way forward City Power and the shareholder with the assistance of the ZERI will Table a report with the City Power board and the City of Johannesburg s Mayoral Committee; Finalised the business case for the bread oven concept; Further investigate the standards for DC via the IEC and SABS groups Develop pilot studies/cases will be developed further for identified projects In all initiatives, the principle of local manufacturing opportunities must be brought in. Draft 3 Page 45
46 SECTION 5.2.4: SMART CITY City Power influences two parts of the Smart City Programme: International Electrotechnical Commission (IEC) Systems Smart Grid INTERNATIONAL ELECTROTECHNICAL COMMISSION (IEC) SYSTEMS EVALUATION GROUP-1: WORKING GROUP ON SMART CITIES Plans The South African National committee of the IEC (International Electrotechnical Commission) invited the president of (AMEU), to nominate a national representative to the newly formed System Evaluation Group on the topic of smart cities. Essentially this group would be investigating the standards work that needs to be initiated or co-ordinated on an international level among organisations like International Electrotechnical Committee (IEC), International Standardization Organization (ISO), International Telecommunication Union (ITU) and others in order for the orderly and efficient development of smart cities to be facilitated through appropriate standards. The Managing Director of City Power was then nominated from the Electricity utility of City of Johannesburg as one of the cities that has, or is developing a smart city strategy. A proposal to the IEC s System Evaluation Group on Smart Cities, to establish a working group using the City of Johannesburg as a model city for the development of a framework for smart city implementation. The IEC approved the proposal to form Working Group 7. The recommendations made by this working group will form part of the IEC s deliberations concerning whether a Systems Committee should be established to further work on a set of Electrotechnical Standards for Smart Cities. City Power, as representatives of the conveners of Working Group 7, is working with the City of Johannesburg s Strategy Department to align efforts of the working group with those of the City. It has been agreed that information and outputs of the project will be shared to ensure that the benefits of the work being undertaken in the area of smart cities can contribute to the progress of initiatives already underway. 4 Mayoral Smart City priority programmes have been identified by the City as part of its Smart City Strategy (Universal Access, Smart Technology, Smart Institutions, and Smart Citizen), these programmes will be overseen by a Smart City Steering Committee, with each programme championed by the respective City s entities for implementation. City Power will play an active role in supporting both the deliverables of the IEC to produce a framework for implementing smart cities and concurrently participate in the delivery of the 4 Mayoral Smart City programmes. The ultimate objective of the Working Group7 is to collate learning points at an international arena; support and act as a catalyst for the Smart Cities implementation for the City of Johannesburg. City Power s is currently involved in the Smart Technology Programme with its various projects such as the smart grid automation and smart metering discussed in the following sections of this report. Draft 3 Page 46

47 Programme Status IEC WG7 and CoJ Smart City Alignment Progress to date on this important programme includes: Working Group 7 has been constituted and the introductory meeting has been held A digital portal has been established to allow for collaboration by the working group members in terms of submissions of relevant use cases and other information that will guide the work of the working group. A meeting has been held with the City of Johannesburg s Director of Innovation and Knowledge Management Unit in order to ensure alignment with the City s Smart City strategy Planned activities: A workshop will be held at the end of November for members of the working group to consolidate their findings. A draft report outlining the Working Group s findings and recommendations will be issued to the IEC on the 1 st of December 2014 A final report outlining the Working Group s findings and recommendations will be issued to the IEC on the 12 th of January 2015 Challenges and mitigations Challenges 1 Coordination and integration of activities across the various entities involved 2 Buy in from various stakeholders Mitigations WG7 could assist by providing a feedback loop that may highlight issues and problems and allow for these to be addressed Backing by the City for WG7 s activities will help to ensure alignment and buy in. Draft 3 Page 47
48 SMART GRID Plan The Smart Grid journey for City Power is a key aspect of the COJ Smart City Realisation Journey. For City Power to be able to effectively embark on the Smart Grid journey, it is essential to objectively establish the as-is state and to define the aspiration / to-be position. This implies that a Smart Grid maturity assessment must be conducted and that this assessment and the defined City Power business strategy should amongst others be used to define the Smart Grid aspiration. City Power is in the beginning stages of the Smart Grid journey and target dates for the maturity assessment are in the process of being set. The following points reflect potential Smart Grid application considerations to complement the City Power Strategic Plan: SHORT TERM Strong core communications network Full SCADA coverage down to satellite stations Improved network security Reduced technical and non-technical losses Improved revenue collection Improvement in network availability and reliability Facilitation of energy management Improved customer interface Data accuracy and data availability Technology enabled data conversion into management information MEDIUM TO LONGER TERM Grid self-healing Grid security Optimised asset and resource utilisation Advanced capability to accommodate alternative energy options e.g. renewables and storage in the current electricity grid Ability to facilitate advanced customer participation and communication Project Status The smart grid plan and terms of references were completed and signed off in June. Below is the detailed status update per project. Project Category Meters Description Prepaid metering Of the meters planned for installation, 3709 was installed and commissioned Status There is some resistance towards the project from the communities where the projects are being rolled out such as Rabie Ridge, Alexandra and Devland. Engagement with relevant stakeholders is in progress in the areas where project is being rolled out including political solutions. The annual target is meters. It is planned to install , and meters for Quarter 2, 3 and 4 respectively. Smart metering Of the meters planned for installation, 738 was installed and commissioned Draft 3 Page 48
49 Project Category Telecommunicat ions SCADA Description Status The start of the roll out of the smart meters was delayed due to preaudit exercise that needed to be undertaken to verify and prioritise the areas. The plan for mass roll-out of domestic smart meters is being finalized including stakeholder identification, communication, resource allocation and focus areas. The ramp up of the roll out will be realised from the second quarter as most of the audit has been completed. The plan for the remainder of the year is to install , and meters for Quarter 2, 3 and 4 respectively. This project is in the commercial stage, and the value of the project is R200m over 3 years. The telecommunication strategy has been presented to the technical evaluation committees. In addition, the last mile telecommunications solution is being investigated, to allow for connectivity to domestic, LPU s as well as ring main units and BMK s. Work is underway to roll-out RTU s to 20 substations in this financial year. The value of the project is R200m over 3 years. R52m is expected to be spent in the current financial year. Challenges and mitigations Challenges Mitigations The high rate of A phased approach has been introduced for the installation of modern theft and vandalism security measures. City Power is also investigating other security measures of infrastructure to secure its underground cables and overhead systems. Casting of concrete over cable trenches where cables are regularly stolen has begun. Installation of vibration alarms on transmission lines pylons has commenced. Installation of load centre alarms has commenced. Communication and awareness as well as public engagement is on-going. The high number of Root cause analysis of faults that have occurred are investigated to MV outages The limited SCADA coverage Faulty and inaccessible domestic meters The high number of bypassed or faulty prepaid meters Sourcing of electricians specializing in metering technology determine what action needs to be taken and to prevent repeat trips. A project has been awarded to install remote terminal units to all substations. Site visits of the installations sites have recently been completed. Installation of RTU's is set to commence in early October. Additionally a fibre optical cable project has been compiled and is at the Bid evaluation phase. Execution of this project is estimated to begin in September It shall interconnect all of City Power substations. These combined projects shall ultimately yield 100% SCADA coverage. The Master Station infrastructure has been identified as a risk, and therefore there is currently a specification being compiled to replace the existing Master Station. Estimated to go out on tender in October The identified inaccessible meters are being converted to Smart meters by Capital Execution. The technical audit and normalisation of prepaid meters is on-going. Its objective is to ensure that all meters are fully functional Accept this situation as a nationwide problem and institutionalize training of electricians in metering technology Draft 3 Page 49
50 SECTION 5.3: CORE MANDATE SECTION 5.3.1: REVENUE RECOVERY PLAN As part of City Power business of buying and selling electricity, the calculation of losses is always based on the difference between the electricity that is bought and electricity that can be accounted for (e.g. Electricity Sales, Streetlights, and free basic electricity). During analysis the losses are then separated between technical and non-technical. Technical losses Technical losses describe energy losses in the network encountered through the transmission cables and transformer, due to network design and materials of construction. In essence, technical losses result from differences in voltages and longer feeder lines from substation or transformer, to the consumption end-point at the customer s premises. Non-technical Losses Non-Technical losses define lost or uncollected revenues relating to the incomplete and inaccurate customer billing and poor management of metering operations in the distribution network. As a result, non-technical losses may be considered to be revenue losses due to the theft of electricity and inability to measure customer energy consumption accurately for billing. The following are common factors that contribute to non-technical losses: Illegal Connections: Energy theft such as in non-proclaimed/ informal settlement, own-connections before the meter or tampering with the meter to bypass readings dials. Illegal connections are compounded by the inherited challenge from Eskom of poor customer addresses and meter locations managed. This challenge also created a scenario where ghost prepaid vending became possible. Bypassed Meters: Emergency calls out after hours, often result in power restorations where a customer s meter is bypassed and the necessary meter change-out does not happen. This is caused by lack of job card data which electricians do not close, in order to enable metering operation to replace the bypassed meter. Meter Tampering: Meter tampering is often a problem with prepaid customers that do not have split meters. Customers on AMR meters are also known to tamper with the communications modules by stealing sim cards, or removing fuses on meters. The result is an online meter that can be detected, but does not transmit customers consumption data, due to communication failure. Poor management of meter installations and maintenance: Meter installations and trouble-shooting conducted by poorly skilled technicians often results in situations where a meter detected as online, but the necessary configurations, especially for AMR and Prepaid are not which leads to failure in communication to transmit meter data, or failure in vending. Poor maintenance of customer data (Addresses, account Number, etc.): Lack of customer data quality management and associated system updates leads to various challenges as follows: Draft 3 Page 50
51 o Un-located addresses for manual read meters: Inability to respond swiftly to detected energy theft, and inability to fast-track maintenance of meter change out for customers who logged queries o Poor data capturing of meter readings: Meter readers often capture data that throws exception during the validation phase. Some of these errors are not resolve within the meter reading window and therefore impact on accurate billing of customers. Meter readers must face penalties for poor data capturing. o Inaccurate and incomplete billing of customers: Inaccurate and incomplete billing tends to promote the culture of non-payment with disgruntled customers. Inefficient management of meters or not fulfilling work orders often leads to customers been billed on estimates rather than actual consumption. There are cases where customers on prepaid are still billed and invoiced for some time after they have been converted to prepay. Inaccurate billing is a major contributor for customers having negative sentiments about the organisation. Corruption and fraud on the side of utility or distributor s employees: A number of City Power employees and electricians have been in the past found to be guilty of illegally connecting customers, where employees have wilfully swopped registered meters for unregistered ones. Proper processes and controls must be introduced that dictate meter handling and issues at stores Current Losses Perfomance The primary responsibility of the City is to deliver services through infrastructure development, efficient and effective management of resources and improve operational efficiencies. To execute this responsibility the City must be financially sustainable and have adequate financial resources to fund infrastructure development and operations. Total revenue at 3 rd Quarter is below budget by R9.93billion due to an increase in nontechnical losses. The non-technical losses of 1, 356, 698,391 KWh were reported in the 3 rd Quarter as the area out of which the additional revenue could potentially be generated. During early 2014/2015 Financial Year, the MD uncovered major irregularities in the business which led him to raise awareness of the challenges with key stakeholders such as the Board Chairperson, the Audit Committee Chairperson, the MMC, the Mayor and the City Manager. In August of 2014 a Special Board Ad-hoc Sub Committee: Revenue Recovery was created to oversee the revenue recovery initiatives. Revenue Recovery Programme was established with the following as the main objectives; reduce non-technical losses by accurately measuring and recording consumption of customers Increase revenue Service Charges Improve meter reading performance Clear unread meters for 3 consecutive months Revenue Recovery Programme strategy map and approach is depicted below; Draft 3 Page 51

52 The Programme Milestones are described in the following Table: No Milestone Description Target Date M1 Clean Audit and some Losses Recovered 2015/06/30 M2 Holding Meter Management Operating Unit Established 2015/08/29 M3 AMR Mass Rollout Completed 2015/08/29 M4 Losses Recovery Targets met 2015/12/18 M5 Programme Close-out 2015/12/30 Programme targets to deliver the milestones are described below; Unit February 2015 June 2015 December 2015 Non-Technical Losses % 19,8% 10% 4,5% Service Charge Losses Rm LPU Ghost No 27,000 20, Domestic Ghosts No 77,000 70,000 17,000 Domestic Manual Reads 146,000 76,000 0 Domestic Manual Reads Success % 67% 95% Na Rate Domestic AMR No 47, , ,000 Domestic AMR Success Rate % 75% 95% 98 Business Customers Manual No 2, Reads Business Customers Manual % 50% NA NA Reads Success Rate LPU AMR No 34,000 37,000 37,000 LPU AMR Success Rate % 65% 98% 99% SAP Estimates % 31 5% 2% Suprema Success Rate % 43% 55% 70% WMC-m No 1 ReconCent-m No 1 Draft 3 Page 52
53 Data Quality % RM-PCM No 1 RM-Procedures No TBD Value Chain Governance No 1 Project Support Office 1 Draft 3 Page 53
54 SECTION 5.3.2: SECURITY OF SUPPLY (LOAD SHEDDING) Due to growth in electricity demand over the years, Eskom s reserve margins have depleted to levels below the international norm of 15%. While electricity users have done a lot to keep load shedding off it remains a reality, especially with the delays that are being experienced in the Eskom Build Programme. City Power therefore needs to have a plan in place that will be embarked upon in the event that Eskom announces load shedding. Under this scenario the City of Johannesburg through its distribution entity, City Power is expected to contribute a specific quota (based on Stages) which is proportionate to normal demand in relation to the total regional / national demand. This is aligned to the Security of Supply GDS outcome. In line with the mandate of distributing electricity and related services City Power has to ensure specific level of performance around the quality of electricity and security of supply. While load shedding would on the one hand if implemented be done to save the grid from collapsing, it certainly introduces a number of dynamics for both the distributor as well as end users in the manner that negatively affects the economy of Johannesburg. City Power as an electricity distributor procures its electricity mainly from Eskom and an Independent Power Producer, Kelvin Power Station. This electricity is further distributed throughout the City of Johannesburg on various independent networks up to the point of end use. Within Johannesburg there is a wide range of customers ranging from (low income) Domestic, Business or Commercial, Agricultural and Industrial or Manufacturing on the top end. From a load curtailment point of view, City Power has several options that are used to avoid load shedding. This is done by either reducing load or by generating electricity equivalent to the reduction quota required by Eskom. Through this mechanism, we believe load shedding will continue to be averted and Johannesburg will not face rolling blackouts. The City will not be required to totally shutdown in order to make this contribution, but continue operations at a reduced rate in terms of production over the duration of the constraint. The curtailment options will cater for stage one (curtailment of 5%) and stage two (10% curtailment) only. Should a greater depth of load shedding be required, stage three (20%) or beyond, City Power will have no option but to revert back to rolling blackouts to meet the curtailment necessary to avoid a national collapse of the grid. Below are the details of the options that are utilized. The table below shows various interventions that City Power has identified as means towards mitigating load shedding. While other required further work in terms of allowing City Power to unlock any value on them, others are considered quick hits as benefits will be extracted in the short to medium terms subject to funding availability. Draft 3 Page 54
 City Power s Energy Management Plan is aimed at highlighting area within which the utility")
55 Items 3 & 7.1b is not in approved budget, additional funding will be required Energy Management (Including DSM and SSM) City Power s Energy Management Plan is aimed at highlighting area within which the utility can leverage on to ensure sustainable electricity supply and enhance the achievement of a reduced carbon footprint in Joburg. The achievement of its objectives is referenced from two main pillars of this plan which are Measure and Conserve. This is critical for the attainment of the COJ Key Priority of Resource Sustainability. On the sustainability part the issue of security of supply is also important for City Power. This is in the context of ensuring continuity of supply even under challenging circumstances (Load shedding) as this is a reality in South Africa. City Power procures the majority of its power from Eskom and a very small contribution from Kelvin Power Station. Almost 98% of this power is produced from coal which is one of the major contributors of CO 2 emissions. The country has committed itself to A Green Economy, to reduce certain amount of emissions and through participation in Integrated Resource Plan 2010 (IRP2010). City Power has to come up with meaningful contribution to the goals of IRP2010. These initiatives will be confined within the useful renewable resources within the City of Johannesburg. Under this category, there are interventions which need consideration and these include: Tariff support for Photovoltaic Installations by NERSA Alternative Energy Technologies compatibility and viability in relation to the current Business Model City Power will focus on a number of applications that will ensure that a culture of conservation is instilled. Within the Energy Efficiency arena the following interventions need to be explored: Energy efficient street lighting program Draft 3 Page 55
56 Building retrofit program Building performance rating system Waste to energy programmes Low pressure solar water geyser program update Virtual Power Station Innovative Product Pricing Tariff support for distributed generation sources Tariff support for photovoltaic systems Promotion of gas cooking to replace electric stoves Natural gas electricity generation From a security of supply point of view City Power has mechanisms that are being deployed as a way to mitigate or avert load shedding. These can be categorised as follows: Demand Side Management Currently Available Ripple Control System Demand Response Programme Low pressure solar water geyser programme Future options (to be explored) Energy efficient street lighting program Building retrofit programme Photovoltaic Generation with proper tariff Diesel Generator Partner Programme Residential Time of Use Tariff Promotion of Gas cooking and Solar Water Geysers Implementation Date July 2014 July 2014 Domestic Load Limiting July 2015 Comments July 2014 Subject to NERSA approval To explore for inclusion on DR Programme Nov 2014 July 2014 Subject to NERSA approval Customer Education Programme Supply Side Management Kelvin Power Station Voltage Reduction System Open Cycle Gas Turbines Natural Gas electricity generation EO to advise Nov 2014 EO to advise July 2015 All these options put together provide a pool of energy within which City Power can tap on in order to demonstrate reinforcement of security of supply. This is City Power s equivalent of a Virtual Power Station with the exclusion of the Supply Side Options. City Power is currently in the process of reviewing its business model to fully comprehend the impact of potentially changing from a one-directional, traditional electricity distributor paradigm with revenues reliant on increased sales and margins to maintain its financial sustainability to an energy company. This change implies a transition to a bi-directional, smart grid concept that facilitates and supports the inclusion of renewable energy sources and actively promotes energy efficiencies Draft 3 Page 56
57 Risks in achieving Set Target Impact and Outcome 2015/16 Projections 2014/15 Plan and Targets 2013/14 Projection 3rd Qtr Performance City Power Updated Business Plan Key Projects Cost [R 000] & Physical Quantities Demand Response Program Ripple Control System Cost Number of customers participating Cost MWH Ensure security of supply and averting load shedding. Reduce City Power s demand through limiting the ampere on the meters during peak hours in line with the objectives of the virtual power station concept This is optional for customers Budget reallocation Kelvin Power Station Open Cycle Gas Turbines Smart Meter Load limiting Streetlight Maintenance & Energy Efficient Lighting Solar Park at City Power Reuven Head Office Conduit Hydropower Cost Ensure security of supply and averting load MWH shedding. Cost MWH Cost Linked to AMI installation - - Detailed Designs 1 Pilot Site Cost Number of Streets Cost Physical Deliverables - - Feasibili ty Study Cost Physical Deliverables - - Feasibili ty Study Detailed Designs Detailed Designs Operate Gas turbines Reduce City Power s demand through limiting the ampere on the meters during peak hours in line with the objectives of the virtual power station concept. Change conventional street lighting luminaires to energy efficient lighting combined with automated streetlight monitoring. Replacement of luminaires and old generation timing circuits Solar PV demonstration site at Reuven offices. Convert parking to a solar farm for internal use. Small-scale hydropower systems for self-use, isolated demand or grid export. The generation opportunity lies at inlets to service reservoirs or in the distribution network where excess energy is dissipated Budget reallocation Budget reallocation None Budget reallocation Budget reallocation Budget reallocation Draft 3 Page 57
58 Risks in achieving Set Target Impact and Outcome 2015/16 Projections 2014/15 Plan and Targets 2013/14 Projection 3rd Qtr Performance City Power Updated Business Plan Key Projects Cost [R 000] & Physical Quantities Distributed Battery Storage Cost Physical Deliverables - - Detailed Designs 1 Pilot Site (typically with pressure reducing valves) Reduce City Power s demand through local supply during peak hours in line with the objectives of the virtual power station concept None Draft 3 Page 58


59 SECTION 5.3.3: INFRASTRUCTURE PLAN AND MAINTENANCE PROJECT Outage Management The reduction of outages and the associated response in terms of restoration times is a top priority and focus area for the company. The condition and age of certain portions of the transmission and distribution networks results in a disproportionate number of unplanned outages. City Power has recognised that this is an unacceptable situation and has embarked on a number of initiatives to mitigate these issues. A program to replace obsolete equipment and circuits is an on-going initiative aimed at bring down the average age of the network infrastructure to acceptable limits. As an example aged transformers are being replaced with new modern units. A further example is the program to replace bare LV overhead line conductors with insulated aerial bundled conductor. In terms of restoration response the Dispatching processes are being scrutinised and improvements introduced. A pilot to implement Mobile Data Terminal (MDT) communications has been successfully completed and the full roll-out of MDT s is scheduled for the first quarter of In the company s performance compact several KPI s, associated with monitoring outages and response times, have been included to reflect performance and progress in these strategic aspects. Aerial Bundle Conductor (ABC) programme A large proportion of City Power s low voltage (LV) network is strung with bare copper conductor. The networks were built approximately 30 years ago when the residual value of copper was negligible. Over the past 5 years, there has been a steady increase in the number of incidents related to theft and vandalism of copper conductor. The high frequency of theft incidents does not only cause outages but also result in over voltages that damage equipment and appliances. To reduce the frequency of theft incidents on the LV networks, the most cost effective solution is to replace bare conductor with insulated aerial bundle conductor (ABC). In addition, ABC is much more resistant to flashovers caused by inclement weather, birds and contact with trees. The figure below shows a low voltage overhead line strung with bare conductor and an ABC installation. LV Network with bare conductor and ABC Draft 3 Page 59

 and Asset Disposal.")
60 The aerial bundle conductor programme has been rolled out in areas such as Witpoortjie, Horizon Park, Franklin, Roosevelt Park, Linden, Crosby, Mayfair, Mayfair West, Blairgowrie, Turffontein, Rosettenville, Forest Hill and Bryanston. Asset Management City Power has made a commitment to strive towards ISO accreditation in the next three to five years. The ISO standard encompasses best practices in managing assets from planning to disposal, and includes asset risk management, systems, processes, asset care, guidelines and asset data. City Power s asset management approach is depicted in the process map below. The key asset management phases are Plan & Budget, Asset Creation, Operation & Maintenance (O&M) and Asset Disposal. Each of these phases contains processes and artefacts enabled by various systems and practices. Asset management approach The table below summarizes the quantity of City Power s transformer fleet. In total, there are 243 power transformers installed in the network. The equipment ratings, type, application and risk profiles of power transformer form a critical set of inputs into the emergency response strategies and maintenance regimes. Draft 3 Page 60
61 Transformers Power transformer population POWER TRANSFORMERS Voltage (kv) Quantity One of the most critical components of the asset management approach is the emergency response strategy that seeks to improve response time to equipment failures. The emergency response strategy encompasses contingency plans, strategic equipment spares and their location, logistics study and support teams all aligned to activate the strategy in the event of a trigger. Such a strategy is preceded by a detailed assessment of network conditions and high risk equipment. In the case of City Power, emergency response equipment includes: Mobile transformers Mobile MV (medium voltage) boards Mobile substations Mobile DC (direct current) trailer 243 Draft 3 Page 61
62 SECTION ELECTRIFICATION OF INFORMAL SETTLEMENTS The Council pronounced its intention to electrify and install basic services on settlements whose formalization may not take place in the foreseeable future. OBJECTIVE The electrification projects are traditional funded by Department of Energy (DoE) through the programme called integrated national electrification programme (INEP). The purpose of the report is to provide an outline of projects to electrify informal settlements. Illegal connections affects the surrounding areas, causes overload, interruptions, revenue losses, unaccounted electricity usage, electrical losses and compliance to NRS 047, NRS 048 and NRS 034. Section 101 is also affected; complaints and petitions are also received from the affected areas. LEGAL AND CONSTITUTIONAL IMPLICATIONS Section 26 (2) of the Constitution identifies the rights to basic needs and the provision are found in the Bill of Rights, entrenches the right of each citizen to adequate housing, healthcare, food, water, social security and education. Section 27 (1) (a) (b) and (c) endorses that each citizen has the right to access proper services and infrastructure such as health care services, water, electricity and social security. Section 24 (a) (b) confirms the rights in a live a suitable environment free of harm to health or wellbeing, Bill of Rights (Chapter of the Constitution). A Section 25 children s right in terms of the housing right, shelters, basic health care and social services (Sustainable environment). Section 152 (1) (b) and (d) ensure the provision of services to communities in a sustainable manner. (d) to promote a safe and healthy environment. Section 9 and 25 of the 1996 Constitution equitable access to land, and to promote equality: The South Africa Housing Act 107 of 1997 and Housing White Paper of 1994 (livelihoods) Section 2 (1) (iii) Eradicate informal settlements through, demolitions, evictions, controlled transit camps and criminalization of land invasions. The programme on its current form seeks to comply with Section Principles of the programme : qualification for benefits, stand sizes, suitable land, and demolition of shacks: from Department of Housing (2004b) National Housing Programme. Upgrade of Settlements Currently majority of these informal settlements are illegal connected (electricity theft), exposed bare wires, unsafe and not conform to electrification standards and specifications (NRS, SANS, Section 101, CoJ etc.) Safety & Capacity: City Power in conjunction with JPMD constantly removes these illegal connections. Illegal connections to infrastructure and non-payment of rates account diminish the revenue base of the City to provide services. National Environmental Management Act, 2004 (Act 10 of 2004) (NEMA), services should be 32meters from a river, tidal lagoon, lake, in-stream dam, floodplain or wetland in the one in Draft 3 Page 62
63 ten year flood line river, stream or wetland, or with 32meters, which is greater, from the bank of a river, stream or wetland. FINANCIAL IMPLICATIONS The electrification programs for each financial year are shown in the tables below. The programme tabulated below were not included during the City Power internal project budgeting process, demand plan, acquisition plan and three year rolling plan. Not part of the Network Development plan and projects, with that said: budget re-allocation will be required for commencing with the 2014/15 informal settlements electrification projects. FUTURE PLANS South Africa is under a severe electricity supply pressure and CoJ is advocating for alternative source of energy as a solution to this problem. Electricity is one of the key contributors in developing country and its economic growth. City Power in-conjunction with CoJ Housing department are in a process of developing a working document for hybrid systems. The document will form part of the tendering papers or scope of work for the informal settlement solar power panel and gas cylinder bidders. The solar panel (PV), roof tops will complement the current stressed electricity network and fed back into grid during load shedding. In an attempt to ensure security of electricity supply, the City is pursuing alternative energy as a solution. The initial report didn t cover the hybrid system and City Power would like to utilise the budget to install the hybrid systems (grid tie). Since Helen Joseph, M1 Madala Hostel are done and energised. Princess Transit Camp, Setjwetla and Lawley Station are about to start (refer to table below). City Power would like to use the budget for both grid and non-grid solutions. Programme 1: Electrification of informal settlements 2014/15 Financial Year Financial Year Project Name 2014/15 Setjwetla 2014/15 Princess Transit Camp 2014/15 Lawley Station Number of Stands Electrification of 4300 shacks/ dwellers (phase 1: 848) Electrification of 1000 dwellings Electrification of ±1900 Household Amount Total Project Cost Phase /15 Phase /16 R54,000,000 R10,000,000 R44,000,000 R15,000,000 R5,000,000 R10,000,000 R47,500,000 R10,000,00 R37,500, /15 Northern Farm Electrification of 120 R3,000,000 R3,000, / /15 Vukani Informal Settlement ( Near Helen Joseph Women Hostel) M1 Informal Settlement (near Madala Hostel) Electrification of 844 units R21,100,000 R 2,000,000 R19,100,000 Electrification of 727 units R9,000,000 R2,000,000 R7,000, /15 Elias Motsoaledi Electrification of 1289 R32,225,000 R3,000,000 R19,225, /15 Thembelihle ± 7000 households R75,000,000 R5,000,00 R70,000,000 TOTALS 17,180 R 256,825,000 R 40,000,000 R 216,825,000 Draft 3 Page 63
64 Programme 2: Electrification of informal settlements 2015/16 Financial Year Financial Year Project Name Number of Stands Amount 2015/16 Plot 08 Lindhaven Plot Phase 1 Electrification & provide public lighting to 2000 households R50,000, /16 Kliptown Ext 11 Electrification of 2400 R60,000, /16 Princess Plot dwellings R50,000, /16 Freedom Charter Square 2691 dwellings R67,275, /16 Ruimsig Portion dwellings R14,750, /16 Westgate Development Princess Electrification of 2800 dwellings Plot TOTALS 12,891 R70,000,000 R312,025,000 This is not in the budget, additional funding will have to be sourced to current budget. We have 61mil in 2015/16 Programme 2: Electrification of informal settlements 2016/17 Financial Year Financial Project Name Number of Stands Amount Year 2016/17 Kya Sands Electrification of 3000 dwellings R75,000, /17 K60 Rabie Ridge Electrification of 3150 dwellings R78,750, /17 Ghanda Square Electrification of 1250 dwellings R31,250, /17 Slovo Park (Nancefield) Electrification of 3000 dwellings R75,000, /17 Lindhaven Plot Phase 2 Electrification of 1200 R1,450, /17 Mountain view Electrification of 150 R 3,370, /17 Organic Market Electrification of ,000,000 TOTALS R274,820,000 Draft 3 Page 64

65 SECTIONS 5.4: SERVICE DELIVERY ENABLERS SECTION 5.4.1: INFRATRUCTURE PLAN: INFORMATION, COMMUNICATION AND TECHNOLOGY (ICT) Vision, Mission, Goals City Power has a vision and mission to become a leader in the Smart Grid implementation inline with the City of Joburg Smart City initiative. Smart Grid enabled electrical network provides City Power with ability to provision dynamic and flexible energy solutions to the Johannesburg citizens. Aligned to this vision, City Power continues to invest in innovative techniques and technologies that will improve the overall performance and management of its entire ICT environment. In order for ICT to realise this vision, we have linked our vision to the mission statement that will enable us to align our goals into outcomes that brings the enables the execution of the mission. Key strategic themes for the ICT environment To prioritize ICT initiatives and prepare for future trends, City Power conducted a detailed audit on the ICT infrastructure, applications, service continuity and the ability to maintain business continuity in the event that a disaster takes place. The overall approach when assessing ICT covered a number of key areas which included ICT Governance Business Architecture and Applications Architecture Business Continuity (ICT Continuity) and Risk Management ICT Service Management ICT Programme and Project Management The outcome of the assessment in addition to consultation services that were undertaken by ICT to ascertain the effectiveness of the assessment report, has led to the development and implementation of a solid programme for the revival of ICT Ecosystem to support the Smart Grid business requirements. Draft 3 Page 65


66 The industry trend indicates that the Energy sector is becoming more dependent on the ICT solutions. We can easily observe high growth in the Mobility, AMI, Grid Automation, Distributed Generation, IT/OT Convergence and Big Data. Our roadmap is aligned to the industry trend as outlined in this business plan. We have mapped out the ICT goal implementation in a simplified illustration below A number of initiatives have to be implemented across the City Power ICT Ecosystem as depicted below in order to achieve the set goals and realise the benefit. This affects multiple components of the Ecosystem that has to be enhanced using additional solutions and in some cases the existing point solutions will have to be upgraded to optimise the efficiency and Draft 3 Page 66

67 robustness of the total solution. The picture below depicts the comprehensive City Power ICT Ecosystem of the future. City Powers ICT environment is 14 years old and was built to cater for less than 500 users and less than 50 application servers and systems. Today, we are running more than 200 applications with more than 250 servers. The current ICT Ecosystem was not scalable at all levels from infrastructure components to services. In order to align to City Power s business, we have developed a business plan with strategic outcomes based on a realistic rollout plan that will be executed over three years. This plan will adequately provide for City Power s future current and business requirements. The key focus area of the ICT business plan are as follows: A. ICT Governance including Risk Management B. ICT Service Management including Demand Management and SLA Management & Reporting C. ICT Monitoring and Control including private cloud implementation with auto-healing D. Smart Grid ICT infrastructure upgrade including ICT network upgrade to Telco grade network, datacentre upgrade, virtualisation upgrade, last mile rollout and secured ICT infrastructure and data asset. E. Core business systems upgrade for Smart Grid including ADMS, MDMS and SAP ISU Revival POC and SAP Upgrade to HANA. F. Web Portals with integrated Business Analytics Draft 3 Page 67


68 ICT Governance City Power ICT adopted the DPSA Corporate Governance of ICT Policy Framework for the implementation of good governance of ICT. The framework clearly outlines what needs to be implemented and the associated compliance standards and guidelines thereby making it easy for City Power ICT to rollout the framework and evaluate compliance. This approach will enhance the maturity level of ICT thereby making it ready for the Smart Grid enabled organisation. ICT Service Management The implementation of a service orientated ICT has necessitated the slight restructuring of the organogram in order to mature the ICT organisation and increase the service efficiency required by the business, today and in the future. The new organogram is depicted below which support the Plan-Build-Run methodology. Draft 3 Page 68
 Business Controls Demand Management & Business Analysis Project Management Applications Service Level Reporting Evaluation & Compliance ICT Contract Management Specialised")
69 Director Engineer Services GM:ICT GM:Telecoms ICT Governance & Compliance (Gugu) ICT Architect (Lawrence) Business Management (Efti) Programme Management (Mike) ICT Operations (Thembekile) Service Management (Vacant) Business Controls Demand Management & Business Analysis Project Management Applications Service Level Reporting Evaluation & Compliance ICT Contract Management Specialised Services Infrastructure Monitoring ICT Asset Management Security Service Desk Third Party Management The service management methodology adopted is ITIL as prescribed in the CGICTPF. Over and above the policy framework prescription, City Power has implemented solutions that support ITIL thereby enabling ICT to enhance the service management implementation as indicated below. Telco grade network The City Power with the rollout of fibre, the communications network will cover all the major substations, bulk intake substations and switching stations including all office areas. In order for City Power to leverage the investment on the fibre network rollout and the related multiplexer projects, it becomes critical for the Enterprise Network (ICT) to be aligned to the Telco Grade infrastructure created by the fibre and multiplexer environment. Draft 3 Page 69

70 City Power in-line with the Smart Grid initiative and the industry approach to converged telecommunications, has a requirement to build an MPLS telecommunications network that will support the electrical network, security network, ICT network and the business network including the public network. These different networks will have services that support the business as an integrated Smart Grid solution based on the MPLS architecture. ICT is proposing the upgrade of the current ICT network to be aligned to this Smart Grid initiative and implement the Telco Grade MPLS network. This requires the implementation of the network solution as depicted below. The high level design for the converged network is illustrated with an architecture diagram below. The diagram represents the five major substations and the two datacentres forming the core backbone of City Power Electrical and ICT data transportation network. The implementation of this network has influence on the organisational structure indicated under the service management initiative. This will assist with the consolidation of the Telco services under one unit in order to provide the specialised skills, processes and technology solutions that will support all business units of City Power so as to achieve Smart Grid Power Utility. Draft 3 Page 70


71 Datacentre Core Telco Grade MPLS Metro Ethernet Rings Draft 3 Page 71
72 Draft 3 Page 72


 City Power ICT has undertaken a project for the implementation of virtualisation upgrade whereby the server and storage capacity and technology were")
73 Datacentre Upgrade (Business Continuity) In order to address the business continuity requirements of City Power, ICT will be implemenating Teier III datacentre with two high availability sites and one disaster recovery site. The picture illustrates the high availability setup between Reuven and Roodeport whereby all critical core business systems will with in-sync all the time, whereby when one site fails the other one will continue seamlessly without the end user experiencing any outage thereby reducing outage for business systems and electrical network systems. This will have direct positive impact on revenue systems. Virtualisation Upgrade (Server and Storage) City Power ICT has undertaken a project for the implementation of virtualisation upgrade whereby the server and storage capacity and technology were enhanced to accommodate the current business needs. ICT has successfully implemented the procured virtualisation infrastructure and has migrated the critical virtualised systems. ICT is still embarking on a project to migrate the physical systems and also to upgrade the virtual systems that need to be migrated into the new environment but with enhanced new features that will increase efficiency and reduce system outages. This approach has been designed to work well with the planned Telco grade network upgrade and the datacentre upgrade. The approach will also establish the required infrastructure for the private cloud implementation which will deliver auto-provisioning of services and auto-healing. Storage and Backup Server (Processing and Memory) Draft 3 Page 73
74 MDMS and ADMS City Power is aligned to the industry and the City of Joburg initiative of Smart City with the objective of increasing revenue and reducing outages. The Meter Data Management System (MDMS) and the Advanced Distribution Management System which includes Outage Management as an embedded capability. City Power ICT will be implementing a turnkey Advanced Distribution Management System (ADMS). The system shall incorporate a SCADA system, Distribution Management System (DMS) and an Outage Management System (OMS) complete with hardware, software, documentation, training, licensing, and integration to existing systems. The data acquisition, transformation and enrichment processes are included as well as the provision of human resources for a period of three years post implementation. Existing systems include, but are not limited to, a SAP Enterprise Resource Planning (ERP) System, a SAP Customer Relations Management (CRM) System, a Siemens Supervisory Control, and Data Acquisition (SCADA) master station, an ArcGIS Geographic Information System (GIS), and home grown erespond and Fault Reporting System (FRS). The existing SCADA Master Station, erespond and Fault Reporting Systems have been utilised by City Power for many years and are in need of replacing. The intention is for City Power ICT to implement a tightly integrated solution. The proposed ADMS should have the ability to function as part of a wider Smart Grid architecture as envisioned by City Power over the medium term. The reference architecture developed by the IEC Smart Grid Strategic Group TC 57, indicates the recommended interfaces, software products, standards, communication protocols, and infrastructure used within the design of a smart grid. Smart Grid Reference Architecture - IEC Smart Grid Strategic Group TC 57 Draft 3 Page 74


75 Business Architecture of MDSM Business Architecture of ADSM Draft 3 Page 75

76 City Power is conducting feasibility study in the implementation of additional solutions that would enhance the service delivery and governance of ICT to City Power. The initiatives include the following: Data Archiving and Security Infrastructure Service Management Institutionalisation Risk and Governance Process and Technology Implementation Private Cloud Implementation Draft 3 Page 76
77 Risks in achieving Set Target Impact and Outcome 2016/17 Projections 2015/16 Plan and Targets 2014/15 Projection Q2 / Midyear Information City Power Updated Business Plan Infrastructure Plan (ICT) Key Project Cost [R 000] & Physical Quantities Application Refresh ICT Business Continuity Upgrade of ICT Network to Converged Telco Grade MPLS Network Cost Physical Deliverables ADMS Planning and Functional Base Module Install MDMS Upgrade and New Module Implementation Web Portal Publishing Platform (Sefoleng Project) ADMS Rollout to Designated Site MDMS Operationaliz ation SAP-ISU- POC Additional Reports Publication and Additional Web Sites ADMS MDMS SAP-ISU BI / Analytics Enhanced Web Publishing Platform Cost Physicals Deliverables Additional Mobile Datacentre at Reuven for Primary DC Capacity Replacement of Roodepoort Datacentre with Mobile Datacentre for High Availability DC Additional Datacentre in Randburg for Disaster Recovery DC Cost Physicals Deliverables Telco network implemented for Office Network and Five Sub Station Networks and network security with segregation Extend VoIP integration and application prioritisation with solid management platform Extend coverage to other substations Increase Revenue ADMS Support and Maintenanc e MDMS Support and Maintenanc e SAP-ISU Support and Maintenanc e Conversion of critical web pages to mobile apps Main servers to have realtime recovery in case of failure and restore in case of data or system corruption - all critical servers, war seats Operational Support and Maintenanc e of the Telco Grade Network Recovery data accuracy Reduce Outage Management Improve Customer Satisfaction Manage and Control Billing Information Accurate and Integrated Automated Reporting Mobile Apps for critical web sites thereby increasing customer satisfaction High Availability of all critical systems to avoid outages and Disaster recovery [DR] site to recovery. DCs and server rooms were audited and found to be noncompliant to industry standard, compromising ability to respond a disaster or system failure. Converged ICT/OT network on common media with multiple class of service and quality of service to prioritise critical electrical network applications in realtime. Enable VoIP (voice over internet protocol). Improved application response time and access to data in substations from any office. Tender Adjudication Timelines None None Draft 3 Page 77
78 Risks in achieving Set Target Impact and Outcome 2016/17 Projections 2015/16 Plan and Targets 2014/15 Projection Q2 / Midyear Information City Power Updated Business Plan Key Project Cost [R 000] & Physical Quantities Implement Converged Telco Grade Network with Last Mile Network ICT Microsoft Platform Infrastructure Upgrade and Enhancement Cost Physicals Deliverables Planning and Design of the Last Mile with Functional Base Module Installed and a designated site Rollout of additional Last Mile sites including mini-subs and metering environment coverage Operational ization of the Converged Last Mile Network Cost Physicals Deliverables Upgrade of Server O/S, Desktop H/W and O/S, AD, Exchange and SCCM Implemented Lync and Service Manager with SCOM, HVVCM, Orchestration DB Clustering Stabilisation of Microsoft Enhancement modules Operational ization of Upgraded Systems Operational Support and Maintenanc e of the Telco Grade Network with Last Mile Support and Maintenanc e of the Implemente d new platform Converged ICT/OT network on common Last Mile media with multiple class of service and quality of service to prioritise critical electrical network applications in real-time Reduce Outage of Communications Systems Reduction of communications costs Stable Microsoft Platform in preparation for the ADMS, MDMS, Last Mile and City Power Public Service Portal Collaboration System Database consolidation Reduced Outages of ICT Systems Cost Reduction on communications cost Community Participatio n. None IT Budget 2015/16 _- R33mil, 2016/17 R36.5mil, 2017/18 R48.6mil Draft 3 Page 78
79 SECTION 5.4.2: DATA MANAGEMENT As part of the MD s top 10 step targets City Power aims to achieve 90% data accuracy by 2016 and attain an unqualified audit in a sustainable manner. To achieve this City Power has established the Data & Process Governance department within the Risk, Assurance and Compliance group. The mandate of the department is to ensure governance and compliance of all data from source to the business intelligence level. All of the data and business intelligence governance deliverables and the recommendations for improvement are driven from the MD s top 10 step targets. The data improvement initiatives are aligned to the Business Plan and Balanced Scorecard as reflected in the table below: Segment KRA Objective Measure Impact Data & Process Governance Project/s and Strategic Initiatives Financial Sustain Revenue Growth Increase Revenue Sales Revenue Rand Value Direct Pre paid data quality assurance audits. Customer, Meter, Meter Location (Customer to Network Link) Conventional: LPU & Domestic data quality assurance audits (CNL) Data Governance & Compliance Alignment with the MD s Step Targets Attaining an unqualified audit in a sustainable manner Reduce Losses to 10% by Dec 2015 Internal Processes Reduce Losses Improve revenue collection Data Management Reduce Non- Technical Losses Reduce bad debt Develop and manage Customer to Network Link Develop and manage detailed Network Model Improve accuracy of Employee Data Non- Technical Loss % Bad debt per sales revenue (%) * Customer to Network Link Completeness (%) Network Model Completeness (%) Actual Assets vs Expected Assets (%) SAP HR standards compliance (%) Direct Data completeness (Data Collection & Verification). Implement metering data standards. Direct Create metering data repository Customer, Meter, Meter Location (CNL) Direct Implement GIS Web based planning tool. Develop & Implement network data standards Customer, Meter, Meter Location (CNL) Provision of Geospatial data Direct Implement NAC Building Blocks first 4 phases Develop & Implement asset data standards. Develop NAC PPPS Direct Update GIS with as built asset data. Align network model data across SAP, GIS, FRS and asset register Direct Implement Employee & Vendor PPPS and data standards. Org Management data quality assurance audits Employee Personal data quality assurance audits. Achieving 98% meter reading by June 2014 (100% Compliance to the By-law) Achieving 90% data accuracy by 2015 Draft 3 Page 79
80 Segment KRA Objective Measure Impact Data & Process Governance Project/s and Strategic Initiatives Data Governance % Adherence to set standards and policies Direct Active Directory data quality assurance audits Implement data and BI Governance frameworks. Automation of business reporting Develop data policies and standards. Capacitate DG&C department. Implement data and BI Governance forums Establish data COE Conduct data quality assurance assessments & audits Value Chain and process development & implementation across all data domains Automation of business processes. Data Governance & Compliance Alignment with the MD s Step Targets The City of Johannesburg faces numerous challenges relating to customer relations and service delivery of which one of the root causes has been attributed to inaccurate and incomplete data. In providing efficient service to its customers the City of Johannesburg and City Power needs to maintain accurate and up to date customer data as far as possible specifically for metering, consumption reconciliations and correct billing purposes. As part of City power strategic planning the areas below have been identified as critical challenges in service delivery within the organization: 1. Meter reading data accuracy: 2. Meter location data 3. Response time to address queries 4. Human Resource capacity Data Quality cycle incorporates data completeness, accuracy, correctness and integrity which ensure operational efficiency throughout the organization and thereby allowing management to make informed decisions about the organization s current status and future. Overall, the City Power data quality sits at 45.3% and the objective is to achieve 90% data accuracy by In order to provide assurance of the data within the organization and respond to the set KPI of 90% data accuracy by 2015, the Data & Process Governance department has set out to implement a structured data management approach. Within the financial year 2013/14 the RAC group focused on delivering on the following KPIs for data quality assurance: 4 HR data audits, 1 pre-paid data audit against the agreed standards and 1 LV Network data assessments were conducted to ascertain the alignment of network data amongst SAP, GIS and FRS system which yielded the results as shown below. Draft 3 Page 80
81 Intervention Plan 2013/14 Current Status Target 2014/15 Target 2015/16 Target 2016/17 HR: Employee Data and Org 50% 55% 70% 85% 90% Management Data Quality improvement CNL Prepaid Data Quality 35% 40% 60% 90% 90% improvement CNL LV Network Data Quality improvement 35% 41% 50% 55% 60% CNL-LPU data accuracy 50% (LPU Not 60% Quality improvement only) started MV Network Data Quality Not in scope 50% 60% 65% SCM Data Quality Not in scope 50% 60% 85% Asset Management data Not in scope 50% 55% 70% Quality Data standards for HR, Pre-paid data management and BI Governance have been signedoff. Value Chain and Process have been developed for: i. HR Business Support ii. HR org effectiveness iii. HR Learning academy iv. HR Employee Relations v. Network Asset Creation vi. Public Liability Claims Management vii. Internal Auditing viii. Data Auditing ix. Smart Metering x. Pre-paid management xi. Business Report Automation In order to ensure business reporting data auditability, a KPI master list was developed which was in turn used to automate business reports for the company score-card, group reports at a strategic, tactical and operational level using PowerPivot tool. To improve the quality of meter data and location data, the auto-finalization of meter conversion process was automated; an address table on SAP was developed. Draft 3 Page 81
82 Specific interventions, targeted areas and prioritisation Key Initiative 2013/ / /16 Budget Develop Standards, including training & implementation R500k Pre-paid data X Conventional meter data (LPU & X Domestic) Network Asset Data X SCM data X HR data X Business Reporting data X Develop Value Chains & Business Processes R300k HR x x Retail Services x x Eng. Operations x x x Risk, Assurance & Compliance x x Eng. Services x x x Finance x x Acquire data and modelling tool x R2m Conduct Assurance Audits R11m HR x X Meter data x x X LV Network Data X x x Conventional meter data X (LPU only) x x SCM Data x x MV Network Data x Provide Geospatial Data x x x R2m Automation & Governance of Business x x R1.5m Reporting Implementation of Web based Network Modelling tool (GIS) x x R3m Risks and Mitigations Risks Meter Data Quality Corruption of data on SAP R/3 prepaid during system updates Lack of field Audit Resources Unavailability of stakeholders HR Data Quality Stakeholders misunderstanding project deliverables Misrepresentation of source data by stakeholders Delays/availability of employees submitting required documentation Mitigations Training of affected stakeholders on SAP R/3 systems updates Acquire Field audit resources Intervention of PMO on unavailability/non-cooperative stakeholders Change management to ensure efficient communication Gain direct access to source data. Follow up with the relevant employee at least twice and then escalate the matter to superiors Dependencies Dependencies Meter Data SAP R/3 prepaid data Landys & Gyr Suprima data Asset Register Network model accessibility Field Auditors Billing data Deeds and LIS data Smart cities strategy implementation Stakeholders availability (COJ, Revenue Nerve Centre) HR Data Quality Participation from IT, Telecoms, HR, Finance and general employee cooperation Availability of employees with relevant information within stipulated timelines Draft 3 Page 82

83 SECTION 6: BUSINESS OF TOMORROW SECTION 6.1 BUSINESS MODEL REVIEW The City of Johannesburg has embarked upon journey to become a sustainable and smart City of the future in line with the principals of the Growth and Development Strategy Energy will be a critical component in realising this aspiration. Whilst energy is key to unlocking the economic and socio-economic development objectives, unchecked consumption of coalbased power will increase carbon and energy intensity, threaten economic and environmental sustainability and the quality of living within the City. As shown in the figure below the focus will be to move from the Business of Today that mainly focus on Security of Supply to finding a key new focus in relation to the business of Tomorrow. Moving from Business of Today to the Business of Tomorrow The energy industry is evolving rapidly and many 4 believe it will undergo greater change in the next five to 10 years than it did during the previous fifty. This is due to the convergence of some of the following factors: a. The falling cost of distributed generation and other distributed energy resources b. Increasing customer, regulatory and political interest in Demand Side Management c. Government programmes to incentivise selected technologies d. The global decline in the cost of Natural Gas prices e. Slowing economic trends f. The continuous rise of electrical energy prices Consumers, energy companies and governments will all struggle with uncertainty in making decisions in this environment. Central to good decision-making is the need to understand how policy, regulation, economics, technology, customer needs and markets create future opportunities, impact the future financial viability and organizational performance. One example of a maturing Distributed Energy Resource is Photo Voltaic systems. This impact of 4 Disruptive Challenges: Financial Implications and Strategic Responses to a Changing Retail Electric Business, Peter Kind, Energy Infrastructure Advocates Draft 3 Page 83


84 this technology needs to be proactively accessed as it creates opportunities but also pose a threat of further accelerating the decline in revenues. The electricity sector changes are creating exciting opportunities with regards to new products and services, new market players and new business models. The National Renewable Energy Laboratory (NREL), stated that system flexibility can be increased using a broad portfolio of supply- and demand-side options, and will incorporate technology advances, new operating procedures, evolved business models, and new market rules. The industry transformation can therefore greatly benefit the utility, if the opportunities and benefits can be leveraged. In this context, City Power has commissioned a review of its business case to reassess its critical role in the City of the future as well as it continued relevance as a business. A framework to move from the Business of Today to the Business of Tomorrow Burning questions relate to whether there is even a place for a traditional power distribution utility or a new energy company in this changing environment? With consideration of this environment, how does a utility position itself to weather the storms of change and to successfully meet their customer, community, shareholder, regulatory, reliability and environmental goals. To inform the review of the business model, an evaluation of the current and changing environment has been done and structured around a review of the policy context and direction and the energy value chain. As indicated in the figure above the study focussed on the following aspects: 1. A comprehensive review of the Electrical, Natural Gas and Automotive fuels environment. For each of these energy types the following four components were addressed: Draft 3 Page 84

85 a. An aspirational vision or ideal future; b. Visible trends and market dynamics supporting this direction; c. An assessment of the current as is situation; d. Identification of the gap between as is and to be; e. Consideration of options for closing the gap; 2. Based on the energy assessment a view of the City s energy needs can be constructed; 3. An evaluation of potential business structures will be done 4. Based on the review in 1,2 and 3 the optimal future business structure of the City s energy business can be designed; 5. This structure will be submitted for EXCO and Board approval and; 6. Once approved an implementation roadmap will be developed. Further the study not only looked at electrical energy as currently supplied by City Power but also the short, medium and long term outlook of Natural Gas as an energy source. The study will also include a review of the anticipated liquid petroleum (Diesel, Petrol) market within the City. With relation to Electrical energy the figure below indicates by way of example a set of optimum technology outcomes that will lead to the most efficient supply of electrical energy to the City in the future. Optimising the supply of electrical energy Key findings from the environmental analysis that should be critical in informing the business review include: The policy and regulatory environment is comprehensive and gives clear direction at a high level, especially as it pertains to the uptake of Renewable Energy, SSEG and liberalization of the energy sector, but much of the detail are untested and conflicting; Blackouts are hurting the local economy and steps must be taken to assure customers that City Power is doing all that it can to secure the system; The City has to consider the optimal mix of solutions to balance the City s power and financial needs. For this purpose, a comprehensive assessment of available and emerging options and trends have been compiled to guide decision-making; Draft 3 Page 85
86 Electricity losses, technical and non-technical, are too high at 30% and this requires urgent attention. This should contribute to both alleviating supply constraints and revenue recovery and is something that City Power can address directly; The energy landscape will change profoundly with the rapid market penetration of cost effective, distributed generation solutions. The change is inevitable and likely to accelerate with resolution of policy issues, electricity price increase, downward technology prices and frustrations with national supply constraints. Opportunities to embrace and leverage the change are key to survival; Consumers are increasingly empowered to become involved in their own supply needs; Consumers, especially large users, are not only reducing their electricity consumption but they are starting to expect value added services. Failure to provide these may result in them disengaging by decreasing their reliance on the system or extracting themselves from it entirely through distributed energy solutions; The changing environment is bringing enormous operational and market uncertainty. A capable, flexible and robust distribution platform will be essential for successful navigation in the dark - Smart grid implementation must be prioritized and accelerated; Cost reflective tariffs and price signals are already considered and must be pursued. Although City Power has started installing smart meters it is essential that these start adding value to operations by facilitating new distributed generation options and through the collection and analysis of data; The old business model of volumetric sales is becoming obsolete and the new paradigm is value. In fact the industry has a new mantra: from volume to value. This can only be achieved by building a robust IT platform which facilitates transactions and ensures the system remains balanced; The City of Joburg is evolving and moving to a less energy intensive future, which is good given its high pollution and congestion levels. The shift from manufacturing to services and high population densities is already under way. For this reason we believe that it aligns more closely with other developed cities around the world and will be one of the first metros in South Africa to face the challenges being faced in developed countries; and To survive the focus will have to be on building new relationships with customers and partners, balancing the growing complexity of supply and demand requirements, for which it will have to rely on more sophisticated grid intelligence. Finally, most international utilities are realising that the anchor in the value chain is no longer generation but distribution. City Power will theoretically take centre stage and needs to prepare for this transition to ensure that it can maximise the opportunity Without a strong demand (anchor project), uncertainty in the Karoo Fracking and limitations in supply and exploration no new Natural Gas resources is expected in the city in the next 8 to 15 years. Importation of gas is likely to be at Coastal Regions (Western Cape, Koega, Mossel Bay, Richards Bay and Durban). In the growing uncertainty, the business will require the right focus on deliverables to stakeholders (the right plan/vision/strategy), meticulous execution of the selected plan and great flexibility supported by sound contingencies. Draft 3 Page 86
87 SECTION 7: FINANCIAL PLAN SECTION 7.1: TARIFF PLAN City Power as a distribution utility sells electricity that is procured from Eskom and Kelvin Power Station. City Power therefore has the role of providing a network within which the megawatts / electrons from the point of connection from suppliers to point of end use. Therefore the sustainability of the business largely depends on a business model whereby the product is packaged and sold to customers within Johannesburg at a mark-up. City Power has over customers which differ in behaviour and location in the network. This necessitates for categorisation of customers based on a number of features including the ones above. Current tariff categories are Industrial, Commercial, and Agricultural to Domestic customers. The National Energy Regulator of South Africa has the role of making sure that customer interests are protected. NERSA has designed guidelines and benchmarks within which electricity distributors should be designing their tariffs. Ideally, City Power is currently conducting a cost of supply study. This is expected to provide a clearer indication on what the total costs are to supply each customer category. Currently City Power uses an approach that takes into account NERSA benchmarks in deriving tariffs. Bulk purchase energy costs as percentage of total costs: 58% - 78% (expected mean of 73%) Surplus as percentage of electricity sales: 10% - 20% (expected mean of 15%) Total system losses: 5% - 12% (expected mean of 10%) Average sales price ratio to average purchase price set at 1.58 Repairs and Maintenance to be at least 6% of sales revenue Debt collection rate of 95% It is generally accepted that tariffs should reflect costs as far as possible and that crosssubsidisation of domestic consumers by commercial and industrial customers would be preferred, as long as it remains within set benchmarks. It is expected that in the next couple of years, as part of the tariff journey to achieve all other management objectives, City Power should have tariffs that are within the national norms, competitive and reflective of the City s expectations. Bulk purchases City Power continues to procure electricity and related services from both Eskom through the Electricity Supply Agreement and Kelvin Power (an IPP) through a 20 Year Power Purchase Agreement. City Power currently experiences a decline in total demand which can be ascribed to a slow economic recovery, energy efficiency improvement, reduced consumption base, and a variety of other factors. The growth rate in total volumes is evident from the following table: Draft 3 Page 87
88 Year (GWh/a) Growth FY2005/ % FY2006/ % FY2007/ % FY2008/ % FY2009/ % FY2010/ % FY2011/ % FY2012/ % FY2013/ % FY2014/ % FY2015/ % The total volumes are expected to continue declining during FY2015/16. The volume growth rate is expected to be -1% while no growth is expected for FY2016/17 and FY2017/18. COJ Tariff Policy The COJ has a policy for tariff setting by utility its entities (MOEs). The principles for electricity tariff setting are captured in the following summary: Social norms o Tariffs should be equitable and affordable; o Tariffs must allow provision of basic services to everyone; o Tariffs must provide for transparent cross-subsidisation of poor households where necessary and feasible; o The tariff structure and levying process should be simple and easy to implement. Economic norms o Tariffs should encourage local economic development in line with the GDS of the COJ; o Tariffs should have a positive influence on economic input factor costs for industrial and commercial firms; o Tariff setting should be aligned with economic policies of the country. Financial norms o Whenever feasible the tariffs should be cost reflective and cost effectively link into the COJ financial framework; o Tariffs should be linked to unit costing and efficiency improvements; o Tariffs should promote sustainability and extension of service provision. Current Tariff Structure The current tariff structure consists of the following categories: Domestic tariffs o Prepaid (5 inclining blocks) Draft 3 Page 88
89 o Post-paid (single-phase seasonal and non-seasonal, 5 inclining blocks) o Post-paid (three-phase seasonal and non-seasonal, 5 inclining blocks) Agricultural tariffs o 50 kva maximum demand o 50 kva maximum demand Business tariffs o All business facilities consuming 100 kva (5 inclining blocks) Demand tariffs o All business facilities consuming > 100 kva (5 inclining blocks) Large power user tariffs o Low voltage (400V) o Medium voltage (3,3-11 kv) Time Of Use tariffs o Customers with installed capacity exceeding 500 kva o Domestic customers that have a preference for time-of-use tariff saving opportunities Special tariffs for electricity resellers o Resellers with business customers on either prepaid or conventional tariff structures o Resellers with residential customers on either prepaid or conventional tariff structures Tariffs normally consist of four types of charge, i.e. Energy reflecting direct consumption of electricity Service reflecting cost of access to the grid Network connection - reflecting network transmission costs Demand reflecting network transmission costs All categories are subject to an energy charge. All consumption categories (except prepaid) are subject to a service and network connection charges. Only large power users are subject to demand charges. Current Process for Tariff Structuring The tariff structuring process needs to contain the following major activities and milestones: Analyse the NERSA guidelines for the average tariff escalation rate for the next term; Consider the revenue requirements for the next term; Confirm the socio-economic goals to be achieved through the tariff structure; Consider national legislation; Consider the requirements of the COJ growth and development strategy; Consider local economic development requirements; Determine and evaluate escalations per user category and charge type; Clarify distribution of tariff increases across the various user categories and the implication of adjustments to the tariff structure; Draft 3 Page 89
90 Submit the proposed new tariff structure to the COJ Council and NERSA for approval this may be done in more than one round. Current Market Segmentation The following table indicates the current (FY2014/15) consumption and revenue contributions of the various categories: TARIFF CATEGORY Contribution Consumption Revenue Large Customer - TOU 10.2% 9.7% Large Customer 56.8% 55.1% Business Conventional 4.8% 6.9% Business Prepaid 0.5% 0.7% Agricultural 0.0% 0.0% Domestic TOU 0.1% 0.2% Domestic Conventional 21.9% 22.2% Domestic Prepaid 5.2% 4.8% Resellers Conventional 0.0% 0.0% Resellers Prepaid 0.5% 0.4% 100% 100% Current Cross-Subsidisation Levels The following table summarizes the levels of cross-subsidization for the current financial year (2014/15), based on an average price (corrected for technical losses) estimation principle: TARIFF CATEGORY Contribution R/kWh Rm/a Large Customer - TOU Large Customer Business Conventional Business Prepaid Agricultural Domestic TOU Domestic Conventional Domestic Prepaid Resellers Conventional Resellers Prepaid Positive values indicate a positive contribution towards subsidization, while negative numbers indicate the receipt of subsidies. It is evident that the Large Customers and Business still contribute to subsidizing the domestic (including resellers) market categories. The crosssubsidization estimates are based on a proxy cost-of-supply profile as generated by Eskom in Once the cost of supply study at City Power has been completed, the profile will be amended to reflect City Power s situation more accurately. However, the above contribution situation for the various tariff categories is not expected to change substantially. Draft 3 Page 90
91 Cost Reflective Charges City Power has launched a formal cost of supply study which should be completed before the end of April One of the aspects covered in the cost of supply study is the allocation of specific cost items to (i) customer services (to warrant the recovery of service charges), (ii) network related costs (to warrant the recovery of capacity and demand charges) and (iii) energy costs (to warrant recovery of energy charges). The allocation layout in the following table supports the derivation of a reasonable design of the tariff structure for 2015/16. CITY POWER HIGH LEVEL COST ALLOCATION (FY2014/15) Services Network Energy Fixed expenses Salaries & wages Overhead (services, mgmt, etc.) 1.8% Billing 0.5% Revenue collection 0.2% Customer services 0.2% Network staff 3.8% Administration Meter reading 0.5% Vending 0.1% Info services 0.1% Customer services centre 0.2% Billing infrastructure 0.3% Meter capital depreciation & amortisation 0.2% Network asset depreciation 2.0% Financing costs 2.4% Bad debt 3.6% Maintenance Network operations 0.2% Network maintenance 0.8% Control room & fault centre 0.7% Vehicles 0.7% General overhead expenses Professional fees 0.7% Internal charges 1.5% Other costs 1.7% Bulk purchase Admin charge 0.2% NA charge 6.0% Demand charge 3.5% Demand charge 2.3% Variable expenses (related to energy sales volume) Bulk purchase Energy charge 63.3% Engineering operations (repairs) 2.5% DSM levy (credit) Total 2.2% 22.7% 75.1% The proxy indicators specify that 2,2% of the total recovery needs to be allocated to service charges, while 22,7% of the total recovery needs to be allocated to network related charges (capacity and demand ). The remainder of 75,1% has to be recovered from energy charges. Draft 3 Page 91
92 Besides this guideline for charge allocation, other constraints are also considered in the design, i.e. The service and capacity charge combination should be about 12,2% increase as proposed by NERSA as any substantial deviation from this guideline would upset the current balance. A design load factor of 30% is prescribed by NERSA, while indications are that City Power s average demand load factor is ± 60%. This results in a significantly reduced demand charge allocation. City Power prefers to not have any fixed charges in the prepaid structure for domestic, commercial and reseller prepaid tariffs. This leads to an artificial conversion of potential service and capacity charges to be allocated to the energy component (the only component of this tariff). Although the abovementioned allocation guideline was considered as the basis for charge allocations, the additional constraints forced the eventual distribution of charges to be 1,7% for services, 20,8% for networks and 77,5% for energy. Design Principles for 2015/16 and beyond The following design principles dictate the tariff setting required for the 2015/16 financial year: Use the high level cost allocation guideline which distinguishes between services, network and energy related costs, combined with the listed constraints (section 3.7) to determine recoveries through service, capacity, demand and energy charges in the proposed tariff structure; Reduce the gap between the TOU and Large power user (LPU) tariffs in order to enable easy conversion of LPU to TOU; Cross-subsidy generation by industrial and commercial should be normalized high-end consumers should generally contribute more than low-end consumers; Cross-subsidy of domestic customers should be normalized lower income categories should receive more than high-income consumers; Assume load factors of LPU and TOU customers at 59,5% (City Power s best estimate); The Eskom Megaflex differentials between high and low demand seasons, as well as peak, standard, off-peak categories are applied to all seasonal and TOU categories where applicable; Allow reasonable targets for non-technical losses recovery; Review the current discount of 4c/kWh to resellers who purchase conventional and/or prepaid electricity from City Power. A variety of other aspects could also be listed in order to rationalize the overall tariff structure, but the above reflect the changes that would be considered for FY2015/16. However, City Power is committed to introduce further rationalization of tariffs over the next two years. Draft 3 Page 92
93 Proposed Tariffs Overall Revenue Increase from Sale of Electricity It is to be noted that the overall weighted average increase from sales expected to be derived from the proposed tariff escalations is estimated to be 12.19% which is below the guideline (12,20%) issued by NERSA. A summary of the expected escalations for the next three years is presented in the following: Overall Tariff Escalation Rates Category Type FY15 FY16 FY17 FY18 TOU MV 9.73% 12.19% 12.19% 12.19% TOU LV 0.17% 12.19% 12.19% 12.19% LPU MV 7.41% 12.19% 12.19% 12.19% LPU LV 7.37% 12.19% 12.19% 12.19% Commercial Conventional 4.79% 10.73% 12.19% 12.19% Commercial Prepaid 9.40% 12.19% 12.19% 12.19% Agricultural 7.17% 12.19% 12.19% 12.19% Domestic Conventional 7.36% 12.19% 12.19% 12.19% Domestic Prepaid 7.45% 12.19% 12.19% 12.19% Reseller Commercial 5.79% 10.73% 12.19% 12.19% Reseller Domestic 2.37% 12.19% 12.19% 12.19% Average sales price increase 7.05% * 12.09% 12.19% 12.19% * Approved escalation rate Bulk purchase GWh/a City Power intends to reduce total losses in supply to a level of 13,5% in the financial year 2015/16. Domestic Tariffs The following graph indicates the total charge in the domestic consumption category expected for FY2015/16. Note that the total conventional domestic tariff is always higher than that for the prepaid segment at consumption rates less than ±4 210 kwh per month. This is aligned with the current view that there should be an incentive for consumers at the lower consumption rates to convert from conventional to prepaid accounts. All accounts are reset at the end of the month and all customers will receive the initial consumption at the low tariffs and then progressively step through the inclining consumption blocks. Draft 3 Page 93
94 Total expense (R/Month) City Power Updated Business Plan EXPECTED MONTHLY EXPENSE: DOMESTIC CUSTOMERS (FY15/16) Conventional Prepaid Energy consumption (kwh per month) Inclining Block Tariff Structure All stepped tariff structures reflect inclining tariff increases with increasing consumption levels. This applies to commercial and domestic energy charges, both conventional and prepaid. Commercial Tariff Category The deviation between the proposed commercial tariffs and that suggested by NERSA will be addressed in the strategy to normalise the commercial tariffs. In this strategy the differential between the commercial and other tariff categories needs to be normalised and the objective is to reach the suggested NERSA differential by Although the proposed tariff structure for FY2015/16 does not address this anomaly in a satisfactory manner, the differential will be reduced further in years 2016/17. Prepaid Tariff Category City Power follows the CoJ guideline to stimulate the conversion of customers from a conventional tariff structure to prepaid tariffs. Due to the fact that prepaid tariffs are not directly subjected to fixed charges, it is necessary that the slope of increases in block levels be higher than that of the conventional structure. This results in a cross-over (break-even) of prepaid and conventional tariffs to occur. For FY2015/16, the cross-over points are expected to be at a consumption rate of ±4 210 kwh per month for domestic customers and ±2 350 kwh per month for commercial customers. Large Power Users Tariff Comparisons with other Municipalities The following graph indicates a current view on large power user tariffs at 17 large municipalities: Draft 3 Page 94
.")
95 The tariffs relate to customers that have demand capacities of just over 1 MVA and experience load factors of about 0,58. The yellow bars indicate the magnitude by which the specific tariffs exceed the current Eskom Megaflex charge (in blue). It is evident from this comparison that the LPU tariffs of City Power is the third highest of the group. The official guideline provided by NERSA is to have these tariffs at 120% of Megaflex. City Power s tariff in this instance is currently substantially higher at 176,4%. While the above reflects a comparison of a specific tariff to customers with a specific consumption capacity and profile, the average ratio of City Power s demand customers to that of the Megaflex tariff is currently estimated at 1,54. This implies that City Power currently charges 154% of the equivalent Megaflex tariff that demand customers would have been charged by Eskom. This ratio is expected to reduce to 148% for the 2016/17 financial year. Embedded Generation Tariff Until NERSA produces specific guidelines regarding the tariffs to be set for embedded generators, the following will apply at City Power: Grid connection charge A grid connection charge of R0,50 per kw capacity installed per day will apply. Customers who would have embedded generation production capacity higher than that required for own consumption, and who are connected to the grid, will be offered a negotiated price up to a maximum of the Eskom Megaflex energy tariff for supply at 132kV, for excess energy fed back into the grid. Rules applicable to this item Draft 3 Page 95
96 This tariff will only apply to existing customers that have been net consumers at City Power and who have decided to invest in embedded generation capacity. Any other parties that are not current City Power customers, who would offer to sell energy to City Power will be treated as an additional supplier under a negotiated power purchase agreement. Customers with embedded generation capacity are required to register with City Power. All customers who would be willing to invest in embedded generation with the purpose to have that as an alternative to the electricity supply from City Power will have to be on a conventional tariff structure, or if they are currently on a prepaid structure, will be required to migrate to a conventional structure. Embedded generators that would need to feed energy back into the grid will require meters with bidirectional metering capability. DSM Levy All electricity consumed will attract a DSM levy of 2 c/kwh. Only Domestic consumption of below 500kWh will be exempted from this charge, meaning that domestic consumption beyond 500kWh per month will be subject to this levy. Draft 3 Page 96


97 SECTION 7.2: BUDGET The City of Johannesburg issues guidelines to all CoJ departments and MOEs on the process to be followed that is aligned to the MFMA. The following guidelines were used for the 2015/16 budget: The 2015/16 budget was prepared based on zero based budgeting principles The budget covers the Operating and Capital budgets. The Shareholder guidelines below were used to compile the 2015/16 budget Guidelines Shareholder CPI 6% 6% Salaries and Allowances 4% 4% Repairs and Maintenance 8% (at least) 60% General Expenses 0% 90% Loan Interest 11,96% 11,96% Guidelines Guidelines NERSA Applied by City Power City Applied Tariff 12,2% 12.19% Power The following assumptions were made on Bulk Purchases and Revenue Eskom increased by 13,8% Kelvin Output is down by 15.6% as there s no indication of an Eskom PPA yet for the period Kelvin Average unit cost is up by 15.3% Turnover is based on an average selling price increase of 14.3% Losses at 13.25% The key drivers of financial performance were used as a basis for analyzing primary problem areas as well as identifying and prioritizing strategic actions Draft 3 Page 97
98 The above guidelines, assumptions and key drivers, lead to the following income statement Description Approved Adjust- Revised Approved Adjust- Draft Draft Draft R millions Budget ments Budget Budget ments Budget Budget Budget 2014/15 R m 2014/ /16 R m 2015/ / /18 R m R m R m R m R m R m Property rates - - Service charges Gov operating grants Other revenue Interest Income Other Internal Revenue - - Total Revenue Employee related cost Debt impairment Depreciation Repairs/maintenance Interest paid Bulk purchases Contracted services General Expenses Internal Charges Total Expenditure Surplus / (Deficit) before Tax Taxation Surplus / (Deficit) after Tax Draft 3 Page 98

99 Revenue Revenue is 10, 6% or R1,4 billion higher than the revised budget of R13,573million. Revenue budget for 2015/16 is R15 billion and has been computed based on the following assumptions: Units sold based on purchased units of GWh Losses estimated at 13,25% Average selling price increase of 14,3% Grants and DSM Decrease of R330 million from the original 2014/15 budget of R570,1 million is mainly due to a decrease in DSM levy from 2c to 1c and also the fact that a certain portion of the customer base no longer qualify to be charged the levy. Direct cost The budget has increased by R1,2 billion from the 14/15 approved budget of R9,4billion to R10,5billion Bulk purchases budget computation was based on the following assumptions: Eskom tariff increase is 13.8% Kelvin Output is down by 15.6% as there s no indication of an Eskom PPA yet for the period Kelvin Average unit cost is up by 15.3% 2015/16 FY - Proposed Bulk Purchases Description Eskom Ekurhuleni Kelvin OCGTs TOTAL 14/15 FY Revised Budget 15/16 FY Propose d Budget Variance Variance % R' millions % GWh % R c/kwh % R' millions #DIV/0! GWh #DIV/0! R c/kwh #DIV/0! R' millions % GWh % R c/kwh % R' millions % GWh % R c/kwh % R' millions % GWh % R c/kwh % Draft 2.4 Page 99
100 Salaries and Allowances Salaries and Allowances has increased by 11% which amounts to R89 million which include annual increase as well as provision for the filling of vacancies, medical aid contributions and shift allowances. Repairs and Maintenance Repairs and Maintenance budget has increased by 60% which amounts to R308 million from the original budget of R512 million to R819 million in 2015/15 financial year. General Expenses General expenses budget has increased by R657,9 million from the 2014/15 approved budget of R738,5 million to R1,3 billion million. The increase is mainly due to increase in Contracted Services and Other General Expenses. Contribution to Bad Debts Increase of R48 million from R452,5 million to R500,6 million based on current collection levels and previous years trends. Depreciation Increase of R110 million due to increased capital investment to be undertaken in 2015/16 financial year. Interest paid There has been a decrease of R111,8 million is due to reduced loan funding from the City. Taxation Decrease in tax payable is due the decrease in taxable income. Draft 2.4 Page 100
101 Balance Sheet City Power Johannesburg (SOC) Limited Annual Financial Statements - With ESKOM - Revised sales and capex R'000's Projections to June 2025 Budgetted Projected Projected Projected 2014/ / / /2018 BALANCE SHEET CAPITAL EMPLOYED Share capital Share premium ACCUMULATED SURPLUS Opening balance Post year adjustment Surplus for the year NON CURRENT LIABILITIES Loan from shareholder - Opening balance Add: New loans Loan from shareholder - Closing balance Finance lease obligation Employee benefit obligation Deferred income Deferred tax Consumer deposits EMPLOYMENT OF CAPITAL NON-CURRENT ASSETS Cost - Opening balance Add: Additions Less: Disposals Cost - Closing balance Accumulated depreciation - Opening balance Add: Depreciation Less: Disposals Accumulated depreciation - Closing balance Property, plant and equipment Intangible assets CURRENT ASSETS Inventories Loans to shareholder Trade and other receivables Consumer receivables Cash and cash equivalents CURRENT LIABILITIES Loans from shareholder Finance lease obligations Trade and other payables VAT payable Provisions NET CURRENT ASSETS Draft 2.4 Page 101
102 SECTION 7.3: CAPITAL PLAN City Power is currently faced with the enormous task of addressing the following challenges: Reducing the average age of our transmission and distribution network where it is in excess of 40 years through refurbishment and replacement Obsolete and unreliable equipment for which we are no longer able to obtain spares Addressing and improving safety on the network i.e. replacement of high risk equipment A network that, due to densification, has in many areas exceeded its firm capacity and in some instances reached its installed capacity Reduction in outages and restoration times to restore power following outages Increased economic activity which will lead to increased demand on our networks Extending the transmission and distribution networks in support of new development, the electrification programme and projected 9% growth rate Dramatic increase in the cost of key resources i.e. labour and materials Meeting the Mayoral priorities i.e. Inner City, BRT Comply with the Cluster programs while trying to refurbish and extend our network Alignment with the City GDS Upgrading of the networks to ensure reliable supplies Increasing backlogs due to insufficient capital Long Term Capital Budget Indicatives Measure 13-Dec 14/15 15/16 16/17 17/18 Unit 13/14 Plan Indicator Plan Plan Plan Plan Plan Network Assets Other Assets Total R m x , ,704,480 1,487,970 1,424,870 R m x , ,000 30,000 30,000 R m x , CAPEX Requirements The key drivers below were used to develop the Capex requirements Draft 2.4 Page 102

103 The proposed budget for 2015/16 financial year is R1.5 billion Capital Source of Funding Results 2012/13 R 000 Approved Budget 2013/14 R 000 Revised Budget 2013/14 R 000 Proposed Budget 2014/15 R 000 Proposed Budget 2015/16 R 000 Loan funding CRR and cash National grant funding Other / Public contribution Total capital City Power has made provision for: Revenue enhancement projects Projects to reduce non-technical losses Draft 2.4 Page 103

104 CAPEX Fund Allocation The table below shows the approved long term capital budget: PROGRAMME CATEGORIES 2013/ / / / /18 Reliability , , ,090 Capacity ,219,298 1,074, ,505 Revenue , ,315 Generation 257,274,5 DSM TOTAL ,734,480 1,487,970 1,424,870 The allocation of funding is largely driven and prioritised by the City s Capital Investment Management System (CIMS). This looks at Mayoral initiatives i.e. Inner City, Bus Rapid Transport (BRT), Gautrain, Social Projects etc. From a City Power perspective we also use the following criteria: Quality of Supply Safety Return on investment Interdependence Increasing network availability visible reduction in outages Decrease in maintenance costs Social benefits of project Revenue generation Risk CAPEX Allocation Impact Draft 2.4 Page 104
105 Major impact on projects not funded comes from the network and bulk infrastructure related projects which, in turn, impose a significant contribution towards service delivery. Therefore, there is no doubt that this reduction will have a significant impact on service delivery and, due to the nature of these projects, natural load growth and network deterioration. The required investment will have to be made sooner or later. It is most likely that this reduction will put pressure on future capital budget allocations. The following are some of the areas which will see the negative impact in the near future: Impact in the reduction of unplanned outages Impact in the improvement of restoration times Provision of new service connections will be negatively impacted There will be an increase in OPEX (R&M) due to emergency repairs Stock Levels will be impacted negatively (most likely to be high) Township developments will slow down due to capacity constraints N-1 contingency will be violated, impacting negatively on network reliability Deferred budgets will place additional burden on future financial year budgets Draft 2.4 Page 105
106 Focus Areas when compiling the budget The construction / upgrading of substations to alleviate loading problems and the elimination of non-standard voltages Upgrade of all transmission and/or distribution equipment in order to alleviate the current overloading situations Upgrade all equipment where safety of personnel is jeopardised Upgrade / replace all un-maintainable cable networks Upgrade of protection systems with modern technology equipment The expansion of the SCADA system to make it possible to monitor / operate substations remotely Roll out of DSM / Load Management Upgrade metering to improve revenue collection. Major Infrastructure Initiatives Major Intake Points Two new Eskom intake points are being planned to provide security of supply and to provide the capacity required to support development into the future. These are major projects, and will take approximately four years each to complete. Sebenza will be situated in the North-East of Johannesburg adjacent to Kelvin Power Station and Quattro in the South West of Johannesburg in the vicinity of the old Orlando Power Station site. The identification of funding for these two projects is now critical. The tender for Sebenza substation has been adjudicated and currently with Legal department. The estimated cost is approximately R 900 M over the four to five year construction period. This cost cannot be funded from the allocated budget only. External funds/grants will have to be sourced. A site has been identified in conjunction with Eskom for Quattro intake station. The detail design of the station is complete and the two 88 kv switchyards at Mondeor and Pennyville are in the tender commercial phase. Eskom Upgrades To support immediate and future capacity upgrades our load projections have been communicated to Eskom. Eskom have indicated that to provide the capacity required they will have to upgrade their transmission networks. Initial payments have been made to Eskom for some of these upgrades. Further upgrades have to be done especially in the South. Eskom s transmission networks will also need to be extended to supply our planned 275/88kV intake points at both Quattro and Sebenza. Sustainable Services Cluster Draft 2.4 Page 106
107 Transport Orientated Development (TOD) Program There are significant funds required to provide electricity for the development of the TOD precincts. At this stage we cannot fund this from our normal capital budget allocation and alternative sources of funding will be required.. (Note all of the projects below are in the next 3 year capital budget approval from the City) High level budgets are as follows: New substation for the Westgate precinct R 160 M Sebenza in the North East of Johannesburg adjacent to Kelvin Power Station Quattro in the South West of Johannesburg, in the vicinity of the old Orlando Power Station site Eskom s transmission networks will also need to be extended to supply our planned 275/88 kv intake points at both Quattro and Sebenza Project Status This section highlights the status of payments for applications made to Eskom for the upgrade of their substation and backbone infrastructure in order to cater for additional backbone capacity requirements. Eskom payments towards the Infrastructure upgrade for additional capacity Project Name Total(Budget quote) Amount Paid Outstanding Vorna Valley 7,619,439 7,619,439 0 Allandale 21,286,281 21,286,281 0 Lufhereng 24, ,000, ,333 Lehae and Trade Route 30,011,877 30,011,877 0 Vlei (Tshepisong) 11,613,822 11,613,822 0 Lutz 40,098,380 16,039,352 24,059,027 Klipfontein View AEL Substation TBA Grand Central Upgrade Total 134,950, ,571,363 23,378,695 Substations Upgrade of Existing Substations The upgrading of substations which commenced in previous financial years has been completed. Two new upgrading projects, Cydna and Observatory substations, commenced in 2012/2013 and will be completed in the course of 2014/2015. New Substations The construction of 10 new substations will commence in 2014/2015 and will be completed in 2017/2018. The new Longlake Phase 2, Nirvana and Roodepoort Substations started earlier this financial year. Project Status The table below indicates the status of upgrade and new substation projects, aimed at addressing capacity constraints and refurbishment backlog as alluded to above. Draft 2.4 Page 107
108 No. Substation Area to Benefit Progress 1 Cydna substation Birdhaven, Melrose, Oaklands area Execution stage 2 Sebenza 275 kv intake substation All areas Execution Phase 3 Quattro 275 kv intake substation All areas Design complete 4 Mulbarton substation Mulbarton, Glen Vista. Liefde en Vrede, Bassonia Execution stage 5 Parkhurst substation Parkhurst, Linden, Victory Park, Greenside, Design stage 6 Sandringham substation Sandringham, Linksfield, Fairvale, Glenkale Design stage 7 Cleveland substation Cleveland, Herriotdale Execution stage 8 Vlei substation Tshepisong Execution stage 9 Lutz substation Alsef, Ruimsig, Honeydew Tender stage 10 Kloofendal substation Kloofendal, Allens Nek, Little Falls, Execution stage 11 Longlake substation Phase 1 Longlake, Modderfontein Complete 12 Fleurhof substation Fleurhof, Robertville Tender stage 13 Lufhereng substation Lufhereng, Doornkop Execution stage 14 Lehae and Traderoute Lehae, Nirvana, Lenasia Execution stage 15 John Ware substation CBD Planning stage 16 Haggie Rand and PPC Haggie Rand and PPC Execution stage 17 Mondeor substation and switchyard Southern areas of Jhb Execution stage 18 Westgate substation Westgate, Selby Design stage 19 Pennyville switchyard Southern areas of Jhb Execution stage 20 Pritchard Substation CBD Design Complete 21 AEL Substation Modderfontein Tender stage 22 Upgrade Roodetown Substation Durban Deep, Florida, Roodepoort Execution Phase 23 Upgrade Nirvana Substation Southern Areas of JHB Execution Phase 24 Longlake Phase 2 Modderfontein Development Execution Phase 25 Industria Feeder board upgrade Industria Execution Phase 26 Wemmer Feeder board repairs Wemmer Tender Phase 27 Waterval Feeder board repairs Midrand Tender Phase 28 Replace 20/6.6kV trfrs with 11/6.6 units CBD Tender Phase 29 Roosevelt Park Trfr upgrade Roosevelt Planning Phase 30 Upgrade Allandale Substation Midrand Planning Phase 31 Upgrade Vorna Valley Substation Midrand Planning Phase 32 Upgrade Nancefield Substation Southern Areas Execution Phase 33 Upgrade Eldorado Substation Southern Areas Execution Phase 34 Additional trfr at Hursthill Substation Perth Corridor Design Phase 35 New OHL to Grand Central Substation Midrand Design Phase 36 Upgrade Transmission OHL All Execution Stage 37 Convert Wilropark Substation Wilropark,Helderhruin, Roodekrans Execution Phase 38 Refurbish Observatory Substation Observatory, Bruma, Yeoville, Cyrildene Design Phase 39 Lenasia South Lenasia Design Phase 40 Bellevue Bellevue, Houghton Design Phase 41 Roosevelt Substation Northcliff, Roosevelt Design Phase 42 Ridge Substation Partktown, Emmerentia, Forrest Town Design Phase 43 Fort Substation CBD Design Phase 44 Parkhurst Substation Parkhurst Design Phae Draft 2.4 Page 108
109 Overhead and Underground Transmission networks We are currently experiencing transfer capacity problems on our transmission line networks and significant upgrades are required to support capacity upgrades at existing and new substations being planned. These upgrades need to be undertaken before the load reaches a critical level, when we will no longer be able to take these lines out of service to do the upgrades. Live reconductoring with high temperature conductor is already being done in selected areas In areas where we are no longer able to get servitude corridors, underground cables are being planned. The cost of underground networks is two to three times that of overhead lines. Where new overhead lines are being planned the acquisition of land and the environmental process that has to be followed has proven to be a major challenge and is delaying projects. Refurbishment of the Transmission Networks The refurbishment of existing substations and replacement of high risk transformers and switchboards will continue to be implemented, in order to bring the network within the acceptable average age. In many instances these transformers are replaced as part of planned upgrades. A transformer condition model was developed to assist with the prioritization of transformer replacements. Upgrading & Refurbishment of the Medium & Low Voltage networks This still presents a major risk and is where the majority of outages occur. However, due to limited funds being made available and the need to first upgrade the transmission networks with the majority of the available funds, the backlog on refurbishment and upgrading of these networks is growing each year. As soon as the transmission networks have been upgraded the focus will change to the refurbishment and upgrading of the medium and low voltage networks. Township Establishment, Densification and New Service Provision This remains our single biggest risk, and a source of frustration for City Power staff, developers and consultants. Considering that City Power has seen an overall natural growth in maximum demand of approximately 5% over the last few years, our networks in a growing number of areas have been placed under severe strain and have become overloaded. This has been further compounded by the demand for housing which has resulted in an exponential boom in many areas due to densification and natural load growth. In many areas, particularly the Midrand, Randburg and Roodepoort areas, the growth has been in excess of 30%. As a consequence we have no capacity to support further development, and have for some time now been forced to turn down applications for densification, township establishment and the provision of new service connections. This will have to continue until these networks have been upgraded. This will ensure that our networks are not further overloaded and will protect the existing customer base. Draft 2.4 Page 109
110 SECTION 8: HUMAN RESOURCE PLAN SECTION 8.1: ORGANISATIONAL LEADERSHIP Board of Directors City Power has a unitary board, which consists of two Executive Directors and eight Non- Executive Directors. The Board is chaired by a Non-Executive Director: Rev. Frank Chikane. The Board meets regularly, at least quarterly, and retains full control over the Company. The Board is accountable to the City of Johannesburg Metropolitan Municipality (the Company s sole shareholder) and its stakeholders, the Citizens of Johannesburg. A Service Delivery Agreement (SDA), concluded in accordance with the provisions of the (Municipal Systems Act) (MSA) governs the Company s relationship with the City of Johannesburg. The Company provides monthly, quarterly, bi-annual and annual reports on its performance and service delivery to its parent municipality as prescribed in the SDA, the MFMA and the MSA. Such reports are submitted within the stipulated timeframes. The Non-Executive Directors contribute an independent view to matters under consideration and add to the depth of experience of the Board. The roles of Chairperson and Managing Director of the Company are separated, with responsibilities divided between them. The Chairperson has no executive functions. Members of the Board have unlimited access to the Company Secretary, who acts as an advisor to the Board and its Committees on matters including compliance with company rules and procedures, statutory regulations and best corporate practices. The Board, or any of its Members, may, in appropriate circumstances and at the expense of the Company, obtain the advice of independent professionals. A Board evaluation is undertaken on an annual basis by the Shareholder. The Memorandum of Incorporation provides that the Directors of the Company shall be appointed in accordance with the COJ Group Policy or any policy determined by the Shareholder from time to time. The Board membership of the Directors is reviewed at the Annual General Meeting of the Company. The Managing Director is appointed by the Boardin consultation with the Shareholder. Board Members The Board currently consists of nine Non-Executive Directors and two Executive Directors who are the Managing Director and the Director: Finance as indicated in the table below: Member Rev. F Chikane (Chairperson of Board) Mr. N Galawe Mr. Q Green Mr. N Hlubi Mr. V Lukhele Ms. S Makotoko Ms. N Mohlala Mr. K Mokhobo Mr. D Naidu Mr. T Sithole Mr. S Xulu Portfolio Non-Executive Director Non-Executive Director Executive Director Non-Executive Director Non-Executive Director Non-Executive Director Non-Executive Director Non-Executive Director Non-Executive Director Non-Executive Director Executive Director Executive Directors are regarded as contract employees in terms of the Company s conditions of service. Draft 2.4 Page 110
111 Qualifications and skills of City Power Board The table below details the qualifications of the Board at City Power. Name Rev F Chikane (Chairperson of the Board) Qualifications *MPA Masters in Public Administration; * M.A. Masters in Theology; *Snr Managers in Government Programme; *Corporate Governance Training Course; *Diploma in Theology Mr. N Galawe Mr. Q Green (Director: Finance) Mr. N Hlubi Mr. V Lukhele Ms. S Mokotoko *B-Tech Extractive Metallurgy *Bachelor of Commerce degree *Certificate in Theory of Accountancy *Qualified as Chartered Accountant (S.A.) in (Resigned from SAICA ) *B Juris Degree (Law); *LLB Degree (Law); *MAP (Business); *CFP (Financial Planning); *Cert in Compliance Management; *MBA * BScEng (Electrical) * BSc (Science) * Project Management * Professional Engineer (ECSA) *Cand Construction Project Manager (SACPCMP) *Masters with Honours in Economics & Management *Executive Leadership Programme *Higher Certificate in Business Management Ms. N Mohlala *Post Degree Diploma in Management; *Diploma in Municipality; * Management Development Programme; *Licensed Accountant; *Certificate IAC; *Accountant Technician Mr. K Mokhobo *BCom; *BAcc; *CA(SA); *ACMA(UK); *Certificate in International Business Mr. D Naidu Mr. T Sithole Mr. S Xulu (Managing Director) *B Paed Science; *ND Work Study; *NHD Industrial Engineering; *Management Development Programme *MBA; *BSc in Engineering (Electrical); *Project Management; *Strategic Management *National Diploma: Electrical Engineering; *B. Tech in Electrical Engineering; *B. Sc Honours with specialization in Applied science: Electrotechnics; *Executive Developmental Program Board Sub-Committees The following Committees have been formed, each of which is chaired by a Non-Executive Director: Audit Committee Human Resources Committee Risk, Assurance & Compliance Committee Quarterly Review Committee Social and Ethics Committee Special Ad Hoc Committee Revenue Recovery Project a. Audit Committee The role of the Audit Committee is to assist the Board by performing an objective and independent review of the functioning of the Company s finance and accounting control mechanisms. It exercises its functions through close liaison and communication with senior Management and the internal and external Auditors. The Audit Committee operates in accordance with a written charter authorised by the Board, and provides assistance to the Board with regards to: Ensuring compliance with applicable legislation and the requirements of regulatory authorities; Matters relating to financial accounting, accounting policies, reporting and disclosures; Draft 2.4 Page 111
112 Matters relating to risk management; Internal and external audit policy; Activities, scope, adequacy and effectiveness of the internal audit function and audit plans; Reviewing and recommending the approval of external audit plans, findings, reports and fees; Compliance with the Code of Corporate Practices and Conduct; and Compliance with the Code of Ethics. Recommend approval of the GRAP Demand Plan Recommend and provide input into the multi-year Business Plan The Audit Committee has independent audit committee members, whose qualifications are listed below: Name Designation Qualifications Ms. L Fosu Mr. W Hattingh Ms. M Shongwe Independent Audit Com. Member Independent Audit Com. Member Independent Audit Com. Member b. Human Resources Committee *B.Com (Accounting); *Post Graduate Diploma in Management (Financial Accounting); *Honours Bachelor of Accounting Science; *Chartered Accountant *M.Com (Specialising in Performance Audits); *B.Com (Hons); *MBA; *B.Com; *National Diploma in Management Services *Bachelor of Accounting *Charted Accountant The Human Resources Committee advises the Board on remuneration policies, remuneration packages and other terms of employment for all Directors and senior Management. Its specific terms of reference also include recommendations to the Board on matters relating to general staff policies, remuneration, performance bonuses, executive remuneration, Director remuneration and fees and service contracts, performance compact, and compliance with relevant legislation and strategic alignment with the objectives of the Company. c. Risk, Assurance & Compliance Committee The Risk, Assurance & Compliance Committee assist the Board in fulfilling their responsibility of ensuring that there is an effective and embedded risk management process in place throughout the Company. The Committee s specific terms of reference also include recommendations to the Board on matters relating to internal control systems in compliance with the provisions of, inter alia, Sections 95 to 99 of the MFMA, the effectiveness of the system for monitoring compliance with laws and regulations and the results of Management's investigation and follow-up (including disciplinary action) of any instances of non-compliance with the MFMA, the annual Division of Revenue Act and any other applicable legislation. The Committee s responsibilities relating to regulatory compliance are to monitor compliance of quality of supply in terms of NRS 048 and quality of service in terms of NRS 047, oversee and monitor any other licence and/or reporting requirements of NERSA. The Committee further advises the Board and assists the Board in discharging its responsibilities for information technology (IT) governance. The Committee maintains oversight over the implementation of the Company s Supply Chain Management Policy in terms of the Local Government: Municipal Finance Management Act Draft 2.4 Page 112
113 (56/2003): Municipal Supply Chain Management Regulations (Gazette no / 30 May 2005), Section 6(a). In addition to the above the Board has delegated the Committee to: Monitor any sourcing strategy for Acquisition Management for all items over R10 million. Monitor any spend planned outside of the approved Business Plan/Demand Plan. Monitor implementation and progress of spend against the approved budget and Business/Demand plan. Monitor deviations and exceptions from supply chain policy and procedures. Monitor all emergency procurements. The Committee ensures that the Company has a Fraud Prevention Policy which outlines the Company s focus and commitment to the reduction and possible eradication of incidences of fraud and misconduct. It also confirms the Institution s commitment to legal and regulatory compliance. The Committee also ensures, on behalf of the Board, that the Company has an enterprise content management policy with data management controls, and advise on policies and procedures for enterprise data sharing and management. The Committee ensures that data, information and intellectual property are protected and managed effectively to ensure their confidentiality, integrity and availability, and that Management has taken steps to protect such data. d. Quarterly Review Committee The main role of the Committee is to monitor and assess the achievement of the Key Performance Areas as set out in the Company Compact, including any special projects relevant to the performance of the Company on a quarterly basis. The Committee also ensure that information is appropriately and effectively shared between the various Committees of the Board and align reporting and integration of internal and external reporting requirements. e. Social and Ethics Committee The Social and Ethics Committee was formed pursuant to the new Companies Act (no. 71 of 2008) and its regulations which require that all state-owned companies must have a Social and Ethics Committee. The Social and Ethics Committee advises the Board on the institutionalisation of ethics in the internal structures, systems and processes of the company. The Social and Ethics Committee ensures that there is strong emphasis on the responsibility of the Company towards the communities in which the company operates, social transformation within the workplace, and the protection of the safety, health and dignity of employees. The mandate of the Social and Ethics Committee, as per the regulations that accompany the Companies Act, is threefold: the Committee has to monitor whether the Company complies with relevant social, ethical and legal requirements and best practice codes; the Committee has to bring to the attention of the Board any relevant matters within the scope of its mandate; and the Committee has to report to shareholders on matters that fall within the scope of its mandate. Section 43(5) of the Regulations of the Companies Act set out the areas of social responsibility and standards against which the Committee should measure the Company against. The areas of responsibility and relevant standards are listed explicitly as: Draft 2.4 Page 113
114 Social and economic development (relevant standards: United Nations Global Compact; OECD recommendations on corruption; Employment Equity Act; Broad-based Black Economic Empowerment Act). Good corporate citizenship (including promotion of equality, prevention of unfair discrimination, reduction of corruption; contribution to community development; sponsorship, donations and charitable giving; environment, health and public safety). Impact of the company's activities, products or services on communities. Consumer relationships (including advertising; public relations; compliance with consumer protection laws). Labour and employment (including employment relationships; contributions towards the educational development of employees. Relevant standards: International Labour Organization Protocol on decent work and working conditions). f. Special Ad Hoc Committee Revenue Recovery Project The purpose of the Special Ad Hoc Committee is to exercise effective oversight and monitoring of the Revenue Recovery Project. The main objectives of the Revenue Recovery Project are: to reduce non-technical losses by accurately measuring and recording consumption of customers to ensure accurate monthly billing for customers to improve revenue performance and to recover losses The main role of the Committee is to monitor City Power and the City of Johannesburg s plan to recover Revenue in a sustainable manner through: Resolving LPU meter (app 37K) performance. Resolving Pre-paid meter (app 72k) performance. Resolving inaccessible meters, faulty meters and unread meters affecting revenue recovery. Resolving accurate billing of LPU customers. City Power High Level Organisational Structure In September 2011, the Managing Director was appointed. Upon his appointment, in alignment with shareholder changing course and institutional renewal, the Board approved a new structure which is outlined below: Draft 2.4 Page 114


115 SECTION 8.2: THE HR PLAN Human Resources overall objective as set out in its policies is to ensure that the Company s employment practices and remuneration policies motivate and retain talented employees and create an attractive environment for all employees. The Human Resources policies are periodically reviewed to ensure that it remains relevant and practical for the changing needs of current and potential employees. Resulting from strategic introspection sessions and the recognition that City Power is at a strategic inflection point, several bold decisions were made by the business which culminated in the decision to re-design the business in its entirety. This was a purposeful effort to align the organisational structure and processes so as to make City Power more effective. This initiative is referred to as the Structural Alignment Programme. The Structural Alignment Programme is a planned change from a deliberate decision to alter the current state, improve business performance and enhance service delivery. The organization redesign initiative (structural alignment) which began to be visible with effect from 1 December 2012 broadly covered the following key aspects as depicted in the framework below: Draft 2.4 Page 115

116 During the 2012/2013 financial year, the strategic partner role of HR was to focus on aligning the organisation structure to the organisation strategy as outlined in the following action plan which was put in place. During the 2013/2014 financial year, the Company s Local Labour Forum adopted an agreement entered into between Management and Samwu, as the majority Union. This agreement entailed the following matters: Travel Allowance Cell phone Allowance Data Card Allowance Hot Skills Allowance Structural Re-Alignment Acting Allowance 50th Percentile / Pay Progression Essential Services / Rules of Engagement Shift Policy / Overtime Annual Leave Gratuity / Performance Management Draft 2.4 Page 116
117 The Local Labour Forum Agreement sought to address the inconsistencies and unfairness that existed in the Company with regard to the implementation of benefits, allowances and compliance with Conditions of Service and related legislation. As is status within City Power Issue Status Expected Outcome Allowances (Travel, Cell phone, Data Card, Hot Skills) Structural Re- Alignment Acting Allowance 50 th Percentile / Pay Progression Essential Services / Rules of Engagement Shift Policy / Overtime Annual Leave Gratuity / Performance Management Travel Top-up, Cell phone and Data Card Allowances were implemented with effect from June Hot Skills Allowance was discontinued in June Structural related deliverables such as the approval of structures were achieved as mapped out in the HR Journey Map. The acting provisions as stated in the Conditions of Service were enforced with effect from 1 July 2013 The framework, principles, criteria, methodology were finalised with all key stakeholders and approved by the Board Pay Progression was implemented in October 2014 The Company is still engaging with Organised Labour in an attempt to finalise the Essential Services Agreement and the Rules of Engagement. Shift Work was implemented on 1 February Leave plans are being managed by Line Managers to ensure the control of accumulated leave. Gratuity was implemented as a once off incentive. The Integrated Performance Management Policy was approved by the Board in February Consistent implementation of Allowances and compliance to the Remuneration Policy Right people in the right place Compliance to existing acting provisions Retention of key skills Availability of essential service staff in event of labour unrest Accelerated Service Delivery Reduction of accumulated leave to ensure compliance with the Conditions of Service High Performing Culture The challenges that prevailed have largely been addressed and institutionalised through the implementation of remuneration aspects contained in the Local labour Forum Agreement as indicated below: Structural Re-Alignment Tools of trade allowances (Travel Allowance, Cell phone Allowance, Data Card Allowance, Hot Skills Allowance) Acting allowance Shift implementation Gratuity / Performance Management Draft 2.4 Page 117
118 The following items are still outstanding; however, it is envisaged that they will be finalized by 30 June 2015 : Essential Services / Rules of Engagement Annual Leave (Accumulated) Targets Year 1 : 2015/2016 Measure the implementation of the LLF Agreement of 30 May 2013 Year 2 : 2016/2017 On-going review and alignment of policies Year 3 : 2017/2018 On-going communication of policies The above targets will be implemented within the approved budget. Risks and Mitigations Risk Legal action for not implementing the Agreement Mitigation Ensure full and consistent compliance with the LLF Agreement of 30 May 2013 The HR Value Chain comprises of the following : Talent Management Learning Academy HR Business Support Employee Relations Organizational Effectiveness TALENT MANAGEMENT The purpose of Talent Management is to ensure that the Company is resourced with the right talent in the right positions and within the right time. Talent Planning and Acquisition The purpose of Talent Planning is to plan the human resource requirements that underpin and align to the business s operational and strategic plan. City Power, as at 31 December 2014, had a vacancy rate of 52.06% as indicated in the table below. As a result of this high vacancy rate, service delivery is being affected adversely due to capacity shortages: Establishment Complement (warm bodies) Vacancies To lay the foundation for proper talent planning, Human Resources has partnered with line managers to identify critical vacancies that will be filled in the next financial year in line with the availability of the budget. Draft 2.4 Page 118
119 Risks in achieving Set Target Impact and Outcome 2015/16 Projections 2014/15 Plan and Targets 2013/14 Projection 3rd Qtr Performance City Power Updated Business Plan Targets Year 1 : 2015/2016 Approval of the Workforce Plan in line with Employment Equity imperatives Year 2 : 2016/2017 Timeous filling of critical vacancies in line with the available budget Year 3 : 2017/2018 Measure performance levels of appointed employees Risks and Mitigations Risk Inability to attract and retain key skills Mitigation To implement an effective Attraction and Retention Strategy Talent Management Cost Analysis Key projects Cost [R 000] & Physical Quantities Operationalise the structure R5000, % 100% 100% Job Profiling and R5000,000 80% 100% 100% Grading R ,00 over Filling of critical three years for the vacancies filling all vacancies 20% 50% 70% Right people in the Budgetary right place constraints Aligned Lack of budget and performance to the skills Business Plan Resourced workforce Budget constraints Remuneration Alignment Remuneration is generally considered as an important driver of organisational strategy, operational performance, employee engagement/commitment, job satisfaction and retention. It is against this background that City Power, during the structural alignment exercise, focussed on the alignment of remuneration practices. Broadly remuneration alignment seeks to ensure that remuneration practices are transparent, defensible, applied consistently across the business and can easily withstand the strict corporate governance test. The Remuneration, Benefits and Recognition Policy which covers the above was reviewed and approved by the Board on 19 September The Remuneration, Benefits and Recognition Policy which was approved by the Board on 19 September 2014 covers all factors of Pay Progression, i.e. Qualifications, Tenure and Draft 2.4 Page 119
120 Performance. The approved policy provides guidelines which City Power uses to move an incumbent within the pay scale of their job grades. The latter factors are used annually in October to calculate the size of the pay progression increase. As part of the policy review process, Human Resources will identify gaps, review and communicate the approved policy to the business. Targets Year 1 : 2015/2016 Ensure that new qualifications, tenure and relevant performance scores are updated on the SAP HR system. Payment of Pay Progression Review of the Remuneration, Benefits and Recognition Policy Year 2 : 2016/2017 Automation of Pay Progression Year 3 : 2017/2018 Continuous improvement LEARNING ACADEMY The purpose of the Learning Academy is to train and develop employees in line with their roles and responsibilities as well as the strategic direction of the business to ensure a skilled and competent workforce. To meet alignment with City Power s business plan, the Human Resources KPI s are: To develop youth in line with the HR Youth Development Plan To train employees on technical and non-technical interventions in line with Personal Development Plans In order to have a skilled and competent workforce, the following objectives are to be met: As part of Youth Development, bursaries are granted to eligible students in line with City Power s business and budget Offer Learnerships and Experiential Learnerships to successful candidates Ensure that training (technical and non-technical) is aligned to Personal Development Plans Evaluate and assess learning and competence Ensure competent instructors, registered assessors and moderators; Targets Year 1 : 2015/2016 Procure and equip the Learning Centre Year 2 : 2016/2017 Review and communicate relevant policies Year 3 : 2017/2018 Assess the return on investment and measure the benefits of the Learning Centre Learning Academy Cost Analysis (see following page) Draft 2.4 Page 120
121 Intervention As is Plan going forwards Budget 2014/15 Budget 2015/16 Budget 2016/ /15 Plan and Targets 2015/16 Projections Impact and Outcome Risks Bursars Learnership/ Apprenticeship The bursar programme is governed by a Bursar Policy ( HR/LA/BURSARY/POL/01) In the Operational Budget of City Power, under the Managing Director s budget, an amount is budgeted for educational support for deserving students to obtain their degrees or diplomas in electrical engineering, accountancy or a field of study that will be to the benefit of City Power and the student (bursar). The Learnership/Apprenticeship programme is governed by the Apprenticeship, Experiential Learning, Internship and Learnership policy (HR/LA/APP/POL/02). The number of bursars to be taken in on an annual basis will be determined by the budget that is set aside for this purpose The Learning Academy will identify the needs in conjunction with the role players of City Power, and the programme to be followed and then apply to the relevant SETA for approval. A tripartite agreement will then be drawn up and signed by the learner, the relevant SETA and City Power. Challenges: To coordinat e the training when shifts are being worked, R 3,000,000 R 7,200,000 R 6,670,000 R 8,000,000 R 6,670,000 R 8,800, Right people in the right place Application of practical and theory Budget ary constrai nts Draft 3 Page 121
122 Intervention As is Plan going forwards Budget 2014/15 Budget 2015/16 Budget 2016/ /15 Plan and Targets 2015/16 Projections Impact and Outcome Risks Mentorship City Power has currently 2 Engineers in Training being mentored by an external appointed mentor from SAIEE. City Power has currently 3 Technicians-in-Training on this programme. The technicians are mentored by an external appointed mentor from SAIEE. City Power is currently hosting 4 Graduated Engineering Technicians on a three year program with the intention for them to be registered with the Engineering Council of South Africa. The sponsor is the Dept of Treasury through their ISDG initiative. The lack of staff to guide and support the processes Graduates will be given the opportunity to do their practical training (P1 and P2) under the guidance of supervisors at City Power. A comprehensive mentorship programme will be followed and this is governed by the Training & Development of Engineers-in-training and Engineering Technicians-in-training policy (HR/EIT & ETIT/POL/01). Further support will be given to the candidates that wish to register with ECSA (Engineering Council of South Africa). This is done in conjunction with the SAIEE (South African Institute for Electrical Engineers) and CESA (Civil Engineers of South Africa). R 1,500,000 R 1,600,000 R 1,700, Readily available skills to ensure business continuity Page 122
123 Intervention As is Plan going forwards Budget 2014/15 Budget 2015/16 Budget 2016/ /15 Plan and Targets 2015/16 Projections Impact and Outcome Risks Skills development, conferences seminars and workshops Currently all training in terms of attending conferences, seminars and workshops are carried out as indicated in the Personal Development Plans of the employees. The Learning Academy will be accountable to ensure that mandatory training providers are appointed to ensure compliance to relevant legislation, especially the OHSA, (Occupational Health and Safety Act), 1993 as amended. R 4,000,000 R 4,400,000 R 4,800, Well informed employees Training will be planned in a coordinated manner by the Learning Academy and the end users are expected to give their full support in attending the planned training programs. Educational Assistance Programmes Attendance of all training events, seminars, conferences and workshops shall be coordinated by the Learning Academy. The Travel, Accommodation and Subsistence policy will guide the processes to be followed when travel and accommodation is required. To financially assist permanent employees to further develop and R 500,000 R 600,000 R 600, Obtain qualificatio ns and Page 123
124 Intervention As is Plan going forwards Budget 2014/15 Budget 2015/16 Budget 2016/ /15 Plan and Targets 2015/16 Projections Impact and Outcome Risks Green Power Programmer Upskill Programme Mandatory Training ORHVS and electrical safety training Currently we are training staff to understand and install smart metering systems through our OEM s. No planned training in terms of Green Power (Energy) is currently taking place. This will only take place when we have resources internally to perform the function. Very little upskilling is taking place currently. Compliance to legislative training is achieved. Training of internal and external staff is taking place. acquire qualifications. The policy on Subsidized Educational Assistance will be used to govern the programme. To ensure staff are trained to understand, maintain and install Smart Electricity Systems. This includes smart metering, smart networks and green power as alternative sources of energy. To train and develop low skilled staff we need to finalize the upgrade of the Training Centre and resource it with staff. To ensure that employees are adequately trained to meet legislation we need to ensure that training plans are in place and training providers are contracted to assist. Training at Roodepoort Centre should be extended to include a High Voltage Switching Bay. This is planned to take place in the new FY. R 1,000,000 R 3,000,000 R 2,000,000 R 1,300,000 R 1,200,000 R 3,300,000 R 2,400,000 R 350,000 R 1,400,000 R 3,600,000 R 2,800,000 R 400,000 apply the knowledge in the workplace To anticipate future skills to be applied to green energy Selfsustainabili ty beyond retirement Complianc e with legislation Lack of budget and skills Page 124
125 Risks and Mitigations Risk Mitigation Inadequate budget to train employees Make budget available Misalignment of training to Company Strategy Ensure that training is aligned to Personal Development Plans HR BUSINESS SUPPORT The purpose of HR Business Support is to ensure that a dedicated HR person is deployed to each Group to support with people related issues and to ensure that HR related information is readily available and accurate in line with legislation. A data verification exercise will be conducted annually to ensure that all employee data and qualifications are updated on the system. Targets Year 1 : 2015/2016 Review and communicated HR Business Support processes Year 2 : 2016/2017 Identify areas for reconfiguration in partnership with ICT Year 3 : 2017/2018 Continuous improvement Risks and Mitigations Risk Incomplete and out-dated data on SAP HR will result in inaccurate reporting and remuneration Mitigation An aggressive program to be put in place to ensure that all data on the system is regularly reviewed and updated EMPLOYEE RELATIONS The purpose of Employee Relations is to ensure sound and sustained employee relations that will result in a productive workforce. To achieve the above, the Local Labour Forum is used as a vehicle for consultation and negotiation between Management and Organised Labour on employee related matters. Targets Year 1 : 2015/2016 Review and communicate Conditions of Service Year 2 : 2016/2017 Training of Presenting and Presiding Officers Year 3 : 2017/2018 Monitoring and evaluation of compliance Risks and Mitigations Risk The non-functioning of the Local Labour Forum may lead to labour unrest Mitigation To ensure that the Local Labour Forum resolves all labour issues in a structured manner Draft 3 Page 125
126 ORGANIZATIONAL EFFECTIVENESS The purpose of Organizational Effectiveness is to ensure a conducive environment that enables a productive workforce by implementing structured programmes and interventions in line with employee satisfaction survey results. Job Profiling & Grading Job Grading is a process of determining as systematically and objectively as possible the worth of one job/role relative to another without regard of the person occupying the position or incumbent. The approved and verified positions profiles were used as a basis for the grading process. The purpose is to achieve and maintain an equitable distribution of basic salaries according to level or position. Quality, competence and scarcity of skills were taken into account when grading each position. Human Resources will continuously review the job profiles to ensure alignment with the strategic direction of the Company. Change Management & Communication Change Management is an ongoing process that supports all business imperatives and changes to ensure the business responds to the environment in which it operates. Targets Year 1 : 2015/2016 Revisit the Organizational Structure to re-align with the strategic direction of the business Enhance the change network structures Conduct Employee Satisfaction Survey Automation of the Integrated Performance Management System Year 2 : 2016/2017 Retrain line managers and Organised Labour on job profiling and grading Develop an HR Communication Strategy Year 3 : 2017/2018 Following governance structure for approval of grades and effect changes Year 3 : 2017/2018 Measure the impact of change Risks and Mitigations Risk Lack of common understanding and buy-in of changes Mitigation Enhance the change network structure Draft 3 Page 126
127 Risks in achieving Set Target Impact and Outcome 2015/16 Projections 2014/15 Plan and Targets 2013/14 Projection 3rd Qtr Performance City Power Updated Business Plan Change Management Cost Analysis Key projects Cost [R 000] & Physical Quantities Performance Management 100% 100% 100% 100% PDP Alignment 100% 100% 100% 100% R5000,000 Employee Satisfaction Survey (CoJ & CP Dipstick) Productivity Improvement Initiatives High performance culture Management / Employees failure to comply Attainment of correct / additional skills Employee satisfaction levels that will result in a conducive working environment R5000, % 100% 100% 100% Poor PM Sound working relationships Pay Progression R11000, % To achieve internal and 100% 100% 100% external pay parity Budget Development programmes that are not in place or attended Poor response rate Draft 3 Page 127
128 SECTION 9: ENTERPRISE WIDE RISK MANAGEMENT Enterprise Risk Management (ERM) is the holistic management of all risks. It is a structured, consistent and continuous process across the whole of City Power for risk identification, assessment, evaluation, decision making and reporting. The Enterprise Risk Management Framework is the set of components for designing, implementing, monitoring, reviewing and continually improving risk management throughout City Power. ERM is a process, effected by City Power s Board of Directors, management and other personnel, applied in strategy setting and across the business aimed at identifying potential events that may affect the company and manage risk to be within the approved Risk Appetite and to provide reasonable assurance regarding the achievement of City Power s objectives. The Risk Management Policy, Strategy and Methodology were developed and approved by the Board in January The Policy, Strategy and Methodology are in line with: Municipal Finance Management Act 56 of 2003; King III report on Corporate Governance; Enterprise Risk Management and Control Framework COSO; CoJ Risk Management Framework; COJ Group Governance Framework 2013; City Power Leadership Charter; and National Treasury Risk Management Framework. In implementing the approved ERM Strategy, the Board has been monitoring the EM Processes since approval of the policy, strategy and methodology. In ensuring the accreditation to the below ISO Management Processes, City Power went through ISO gap analysis on May 2014 and in terms of the Gap analysis conducted by SABS, the Enterprise Risk Management framework for City Power is in compliance with risk management principles and guidelines prescribed in ISO 31000:2009. The results of the gap analysis report indicate that conformity was achieved in the implementation of ERM Policy, outline accountability and roles, integration of ERM in organizational processes, risk monitoring and review, continual improvement of the process, communication and consultation. Processes are underway in ensuring full implementation of the ERM processes within City Power. Draft 3 Page 128


129 SECTION 9.1: RISK MANAGEMENT PROCESS The company has adopted an ISO accredited Risk Management Process of Risk Identification, Monitoring and Review, Communication and Consultation as depicted in the diagram below: ISO within City Power is to be applied within existing management systems to formalize and improve risk management processes and as part of strategic management implementation. Subsequently, when implementing ISO 31000, attention is to be given to integrating existing risk management processes in the new paradigm addressed in the standard. The focus of ISO will be centered on: Transferring accountability gaps in enterprise risk management; Aligning objectives of the governance frameworks with ISO 31000;; Embedding management system reporting mechanisms Creating uniform risk criteria and evaluation metrics. Risk Identification On 24 February 2014, the Board approved the Risk Management Policy which included the Risk Management Strategy and Methodology. The approved policy documents provide the company with a strong foundation for an efficient and effective ERM program. In March 2014, a risk assessment was undertaken as part of the process of Identifying Group Operational Risks for 2014/15; Identifying and assessing Strategic Risks for 2014/15; and Setting the risk appetite and tolerance levels The Strategic Risk Assessment focused primarily on risks that are strategic in nature, that have an impact to the achievement of the strategic intent and value propositions as per the business plan. Workshops and brainstorming techniques were implemented as part of the risk assessment process. This allowed collection, sharing of ideas and strategic discussions of the events that could impact the achievement of objectives, stakeholder expectations and key dependencies. Draft 3 Page 129
130 The process of ERM matured not only to assessment and monitoring of Strategic Risks (Top down approach) but to a (bottom up approach) with the following processes implemented: Operational Risk Assessment Fraud Risk Assessment Revenue Management Risk Assessment Outage Management Risk Assessment Compliance Risk Assessment Risk Assessment and Treatment Once risks have been identified, they must then be subjected to a consistent assessment process to ensure that City Power achieves an objective and holistic result that can inform its risk profile. Risk is measured in two ways: By the likelihood or frequency of the risk occurring By the severity / impact on City Power of the risk occurring The developed methodology for has a two-stage assessment process to assess and quantify the identified risks. Stage One Impact and likelihood The first stage involves an assessment of the potential impact (or severity) of each risk, and then the likelihood of the event actually occurring. Each risk is scored on a scale of one to five. Table below shows the criteria used to assess the potential Impact / Severity of each risk occurring Assessment of impact / severity Rating Financial Reputation Stakeholders Customers Event would Contained within individual Employees may Customers may have have little service area. From a regulatory have suffered been minimally financial impact perspective, minor fines or minor first aid impacted. Event may 1 on either penalties may have been injuries. Event impact minimally on income or suffered. may have achieving a budget resulted in performance target. localised staff 2 3 Not significant Minor Moderate Event would have moderate financial impact (>2% on budget/income or >2%) on either income or budget. Event would have serious financial impact (>4-6% on budget/income or >4%) on either income or budget. Affects significant number of service areas but with likely short-term impact on public memory. From a regulatory perspective, fines or penalties >R50k may have been suffered. Customers may have been impacted resulting in complaints with media coverage (suburban newspaper). Regulator inquiry with mediumterm impact on public memory. From a regulatory perspective, fines or penalties >R100k may have been suffered. Customers may have been impacted resulting in complaints with media coverage (local newspaper not front page). morale problems. Employees may have suffered temporary disabling injuries. Event may have resulted in staff loss causing minor to moderate consequences. Employees may have suffered multiple temporary disabling injuries. Event may have resulted in staff loss, causing serious consequences. Event may impact on achieving a performance target where a major milestone was missed by more than 1 month, impacting on a client segment. Event may impact on achieving a performance target where a major milestone was missed by more than 3 months and subsequent interruption over several days to customers. Draft 3 Page 130
131 Assessment of impact / severity Rating Financial Reputation Stakeholders Customers Event would Medium-term public impact with Employees may Event may impact on have very minor political implications. have suffered achieving a serious From a regulatory perspective, multiple performance target financial impact fines or penalties >R150k may permanent where a major 4 (>8% on have been suffered. Customers disabling injuries. milestone was budget/ income may have been impacted Event may have missed by more than or >8%) on resulting in complaints with resulted in staff 6 months, resulting in either income media coverage (national TV loss, causing a major customer or budget. headlines) and loss of service very serious impact. 5 Major Catastrophic Event would have catastrophic financial impact (>15-25% on budget/income or >15%) on either income or budget. >1 month. Long-term impact on public memory and major political implications. From a regulatory perspective, fines or penalties >R500k may have been suffered. Customers may have been impacted resulting in complaints with media coverage (national TV headlines) and loss of service >6 months. consequences. Employees may have suffered fatalities. Event may have resulted in staff loss, causing catastrophic consequences. Event may impact on a performance target, where a major milestone was missed by more than 8 months to over 1 year. The table below shows the criteria used to assess the likelihood of the risk occurring: Rating 5 Likelihood Descriptor Almost Certain 4 Likely 3 Possible 2 Unlikely 1 Rare Description Event has occurred within the last year repeatedly. Event has occurred within the last financial year. The event has a probability of occurring at some time, in the next year. Very few recorded or known incidents. Reasonable opportunity to occur or has occurred within other organizations within sector. Event may occur in exceptional circumstances. No recorded incidents or little opportunity for occurrence. Probability The event is certain to occur within this financial year. The event is likely to occur within this financial year. Event has been recorded within organization as well as within the sector in the last 2 years. The event may occur at some time, within the next 2 years. No event recorded in the last 3 years. The product of this stage one assessment of impact and likelihood is an "Inherent Risk Score", which can range from a minimum of 1 to a maximum of 25, by multiplying the frequency and impact scores. Residual Risk Residual Risk (RR) is the remaining risk after controls are put in place. In order to determine the Residual Risk Rating, management must rate the effectiveness of their controls in mitigating the risk. Control Effectiveness Assessment Excellent Qualification Criteria Rating Control addresses risk, is officially documented and in operation 0.20 Draft 3 Page 131
132 Good Control addresses risk, but documentation and / or operation of control could be improved 0.40 Fair Poor Risk Measurement Control addresses risk, at least partly, but documentation and / or operation could be improved At best, control addresses risk, but is not documented or in operation; at worst control does not address risk and is neither documented nor in operation Inherent risk and residual risk will be measured by the following calculation Categories of Risks Inherent Risk X Control Effectiveness = Residual Risk Risks will be categorized in terms of their Inherent Risk (IR) and Residual Risk (RR) risk score as per the table depicted below. CATEGORISATION Impact X Probability = Inherent Risk Rating Risk Score Colour Very High Red High Amber Moderate/ Medium 6-10 Yellow Low Below 5 Green Stage two Development of Risk Drivers and Risk Casual Model Risk drivers are those elements which tend to be the cause of the risk occurring. Risk drivers are a key process in risk management as they provide an in-depth understanding of the risk. Analysis of the drivers lead to the effective monitoring of the risk as well as the development of control measures to mitigate or manage the risk. These will be measured and monitored as per the next phase of this project. The formulation of risk drivers is to assist with the understanding of the risk (i.e. make the risk more tangible) and in the formulation of controls, both pre- and post and to manage / minimise the risk drivers, which in turn reduces the overall headline risk. If the drivers are not identified, then the process only provides a snapshot of the risks at a point in time. Monitoring and Reporting Continuous monthly, quarterly and annual reporting on progress with status of action items is in place. Non-technical losses and theft and Vandalism of the Network remain very high in terms of the Inherent Risk. Urgent interventions are required in addressing and reducing the impact of the risk to an acceptable level. As risks are assessed on a continual basis, emerging risks are also identified and brought to management attention for mitigation strategies to be developed. Draft 3 Page 132


133 Failing to validate performance information Load shedding and its impact on City Powers reputation Emerging Risks Implementation of the New Buisness Model Management of the above risks is underway in ensuring City Power achieves its strategic objectives Auditing This process will be audited continuously, with a firm focus on continuous improvement. The diagrams below depict the heat map of the top 10 Strategic risks at both inherent and residual levels. Draft 3 Page 133
City Power Johannesburg (SOC) Ltd. Business Plan. Final Draft: Subject to NERSA Approval of the Tariffs
 Ltd. Business Plan. Final Draft: Subject to NERSA Approval of the Tariffs") City Power Johannesburg (SOC) Ltd Business Plan 2018 2019 Final Draft: Subject to NERSA Approval of the Tariffs 0 Official sign-off It is hereby certified that this Strategic Plan: Was developed by the
City Power Johannesburg (SOC) Ltd Business Plan 2018 2019 Final Draft: Subject to NERSA Approval of the Tariffs 0 Official sign-off It is hereby certified that this Strategic Plan: Was developed by the
Title of presentation
 Title of presentation Dr Willie de Beer Chief Operations Officer EDI Holdings Are the REDs Dead? Presentation Outline Current Electricity Supply Industry Structure Current Situation Supply / Demand : In
EMBEDDED GENERATION: THE CITY POWER EXPERIENCE
 EMBEDDED GENERATION: THE CITY POWER EXPERIENCE 19 April 2016 Contents 1 City Power at a glance 2 Evolution of distributed generation 3 City power approach 4 How to engage? CITY POWER AT A GLANCE City Power
business, government and civil society. It is also providing energy at rapidly decreasing cost to the consumer.
 Speech by the Minister of Energy, Hon Jeff Radebe, MP at the Renewable Energy Independent Power Producer Programme (REIPPPP) Bid Windows 3.5 and 4 Contractual Close signing ceremony 4 April 2018 I would
SECTOR ASSESSMENT (SUMMARY): ENERGY 1
: ENERGY 1") Country Partnership Strategy: Azerbaijan, 2014 2018 SECTOR ASSESSMENT (SUMMARY): ENERGY 1 Sector Road Map A. Sector Performance, Problems, and Opportunities 1. Azerbaijan is rich in energy resources. The
Country Partnership Strategy: Azerbaijan, 2014 2018 SECTOR ASSESSMENT (SUMMARY): ENERGY 1 Sector Road Map A. Sector Performance, Problems, and Opportunities 1. Azerbaijan is rich in energy resources. The
Maximising the potential of Energy Efficiency and Demand Side Management in South Africa
 Maximising the potential of Energy Efficiency and Demand Side Management in South Africa By Vashna Singh, Eskom, Demand Side Management 27 October, 2008 Presentation Objectives No. Item 1 Global context
Alan Tait Managing Director Pragma Africa
 Alan Tait Managing Director Pragma Africa Ekurhuleni Energy Department A Model for Electricity Distribution Infrastructure Asset Management Ekurhuleni Metropolitan Municipality Energy Department The Energy
ELECTRICITY DISTRIBUTION INDUSTRY RESTRUCTURING
 ELECTRICITY DISTRIBUTION INDUSTRY RESTRUCTURING 1. BACKGROUND On the 25 th of October 2006 Cabinet, having considered the results of the modelling exercise, approved the proposal to create six wall-to-wall
SECTOR ASSESSMENT (SUMMARY): ENERGY 1
: ENERGY 1") Interim Country Partnership Strategy: Maldives, 2014 2015 SECTOR ASSESSMENT (SUMMARY): ENERGY 1 Sector Road Map 1. Sector Performance, Problems, and Opportunities A. Sector Performance 1. The Maldives
Interim Country Partnership Strategy: Maldives, 2014 2015 SECTOR ASSESSMENT (SUMMARY): ENERGY 1 Sector Road Map 1. Sector Performance, Problems, and Opportunities A. Sector Performance 1. The Maldives
CIPS Pan African Conference
 CIPS Pan African Conference Procurement and Executive level alignment how procurement is becoming a strategic advisor to internal stakeholders The Eskom journey & experience May 2013 The strategic role
LOS ANGELES DEPARTMENT OF WATER AND POWER
 LOS ANGELES DEPARTMENT OF WATER AND POWER FISCAL YEAR 2016-2017 GOALS AND OBJECTIVES The goals and objectives of the Los Angeles Department of Water and Power (LADWP) for Fiscal Year 2016-17 are in alignment
USAASA & USAF 2018/19 Annual Performance Plans Presentation to Portfolio Committee on Telecommunications and Postal Services
 USAASA & USAF 2018/19 Annual Performance Plans Presentation to Portfolio Committee on Telecommunications and Postal Services Universal Access and Service to ICT for All 24 April 2018 Table of Contents
STRATEGIC CONTEXT FOR ENERGY PLANNING CHAPTER 2
 STRATEGIC CONTEXT FOR ENERGY PLANNING CHAPTER 2 Eskom contributes to its vision of together building the powerbase for sustainable growth and development through its core business focus on electricity
Grid Modernization Initiatives at ComEd
 Grid Modernization Initiatives at ComEd i-pcgrid Workshop 2017 Michelle Blaise SVP, Technical Services ComEd ComEd, An Exelon Company Our Customers: 3.85 million customers in northern Illinois, including
Five minute guide: Energy Trilemma. Five minute guide Energy Trilemma
 Five minute guide Energy Trilemma Energy Trilemma As world population continues exponentially growing and becomes more urbanised and more affluent, demand for power, heat and transport will grow with it.
OECD WORK STREAM ON MOBILISING PRIVATE INVESTMENT IN LOW-CARBON, CLIMATE RESILIENT INFRASTRUCTURE: POLICY FRAMEWORKS AND INSTRUMENTS
 OECD WORK STREAM ON MOBILISING PRIVATE INVESTMENT IN LOW-CARBON, CLIMATE RESILIENT INFRASTRUCTURE: POLICY FRAMEWORKS AND INSTRUMENTS FINANCING LOW-CARBON ENERGY FOR FROMAL LOW- INCOME HOUSING: THE CASE
The South African Renewable Energy Independent Power Producers Procurement Programme (REIPPPP) Lessons Learned
 Lessons Learned") The South African Renewable Energy Independent Power Producers Procurement Programme (REIPPPP) Lessons Learned June 2016 it (REIPPPP) has already established a flagship public-private partnership model
The South African Renewable Energy Independent Power Producers Procurement Programme (REIPPPP) Lessons Learned June 2016 it (REIPPPP) has already established a flagship public-private partnership model
Deon Louw Deputy Director: Electro Technical Services Overstrand Municipality South Africa
 Deon Louw Deputy Director: Electro Technical Services Overstrand Municipality South Africa MAINTENANCE AS A UTILITY IMPERATIVE ELECTRICITY DISTRIBUTION INDUSTRY (EDI) SOUTH AFRICA Presentation Content
LOS ANGELES DEPARTMENT OF WATER AND POWER
 LOS ANGELES DEPARTMENT OF WATER AND POWER FISCAL YEAR 2015-2016 GOALS AND OBJECTIVES The goals and objectives of the Los Angeles Department of Water and Power (LADWP) for Fiscal Year 2015-16 are in alignment
Powering the Future. Knowledge, Technology, Interaction African Utility Week. Silas Mzingeli Zimu C.E.O. Suzlon Wind Energy SA
 Powering the Future Knowledge, Technology, Interaction African Utility Week Silas Mzingeli Zimu C.E.O. Suzlon Wind Energy SA CTICC 14 th May2014 Political Overview The society we are striving to build
Nampak Limited Broad-Based Black Economic Empowerment Charter
 Nampak Limited Broad-Based Black Economic Empowerment Charter Original : October 2003 First update : January 2010 Second update : March 2016 Table of Contents 1. Approach 3 2. Preamble 3 3. Interpretation
GROWTI-POINT PROPERTIES. Transformation Strategy Growthpoint Properties
 GROWTI-POINT PROPERTIES Transformation Strategy Growthpoint Properties..... Table of Contents 1. Preamble... 3 2. Why a Transformation Strategy?... 3 3. Our Approach to Transformation... 4 4. Our noteworthy
City of Toronto STRATEGIC ACTIONS
 City of Toronto STRATEGIC ACTIONS 2013-2018 Contents Message from the City Manager 2 Council s Strategic Plan 3 Developing Strategic Actions 6 Strategic Actions 2013-2018 7 City Building 8 Economic Vitality
TasNetworks Transformation Roadmap 2025
 DRAFT TasNetworks Transformation Roadmap 2025 JUNE 2017 Trusted by our customers to deliver today and create a better tomorrow 2 TasNetworks Transformation Roadmap 2025 June 2017 Purpose We deliver electricity
ELECTRICITY NETWORK TRANSFORMATION ROADMAP: KEY CONCEPTS REPORT SUMMARY DECEMBER 2016
 ELECTRICITY NETWORK TRANSFORMATION ROADMAP: KEY CONCEPTS REPORT SUMMARY DECEMBER 2016 A partnership between Energy Networks Australia and CSIRO A TRANSFORMED ELECTRICITY SYSTEM BY» Customers retain security
Utility sector overview & their challenges. Dependency on Energy sector. What needs to addressed in 2018 & beyond
 PRESENTATION OUTLINE Utility sector overview & their challenges Dependency on Energy sector What needs to addressed in 2018 & beyond Business Case: - How utilities can maximize revenue protection by adopting
Annual Performance Plan 2018/19. Tembinkosi Bonakele, Commissioner 17 April 2018 Presentation to the Portfolio Committee on Economic Development
 Annual Performance Plan 2018/19 Tembinkosi Bonakele, Commissioner 17 April 2018 Presentation to the Portfolio Committee on Economic Development 1 Introduction 1. The Competition Authorities The Competition
Advance Metering Infrastructure (AMI) in South Africa Eskom s Challenges and Lesson s Learnt
 in South Africa Eskom s Challenges and Lesson s Learnt") Advance Metering Infrastructure (AMI) in South Africa Eskom s Challenges and Lesson s Learnt By: Kennedy Subramoney 9 May 2012 7th ANNUAL METERING BILLING / CRM ASIA 2012 Bangkok (Thailand) Presentation
Advance Metering Infrastructure (AMI) in South Africa Eskom s Challenges and Lesson s Learnt By: Kennedy Subramoney 9 May 2012 7th ANNUAL METERING BILLING / CRM ASIA 2012 Bangkok (Thailand) Presentation
The Johannesburg City Safety Strategy: presentation. for the Johannesburg CID Forum 11 October 2016
 The Johannesburg City Safety Strategy: presentation for the Johannesburg CID Forum 11 October 2016 Why a Revised JCSS? Urbanization has been accompanied by increased levels of crime, violence and lawlessness.
1. Introduction. 2. Energy System Transformation
 Outcome Document 1. Introduction 1.1.The VEF is a biennial event with its first edition held in 2009, designed to discuss practical solutions for moving towards a global sustainable energy future. Austria
NAGA Strategic Plan
 NAGA Strategic Plan 2015-2020 1. Introduction This strategic plan has been developed through a collaborative process involving the members of the NAGA Executive and Implementation Forum, guided by the
Performance Reporting Criteria
 Revision Date: February 2012 Revision No.: 2 Document No.: DOC-131102-ADV Status: Approved by CER Date: 01/03/2012 ESB Networks Ltd. Contents 1. Background... 3 2. Report Headings... 4 3. Criteria... 5
ELECTRICITY DISTRIBUTION INDUSTRY (EDI) RESTRUCTURING : 11August 2005
 RESTRUCTURING : 11August 2005") ELECTRICITY DISTRIBUTION INDUSTRY (EDI) RESTRUCTURING - 1 - : 11August 2005 PURPOSE 1. To update Council on the latest information in respect of the Electricity Distribution Industry Restructuring; 2.
ELECTRICITY DISTRIBUTION INDUSTRY (EDI) RESTRUCTURING - 1 - : 11August 2005 PURPOSE 1. To update Council on the latest information in respect of the Electricity Distribution Industry Restructuring; 2.
Strategic Direction for Eskom s Retail Tariffs 2011 onwards
 Strategic Direction for Eskom s Retail Tariffs 2011 onwards Author & Presenter: Deon Conradie B Eng (Hons) University of Pretoria, MBL Unisa Senior Manager (Electricity Pricing), Eskom Co-author: S Salvoldi
Case Study EKURHULENI METROPOLITAN MUNICIPALITY PROJECT: MUNICIPALITY-DRIVEN ENERGY EFFICIENCY AND REFURBISHMENT
 Case Study EKURHULENI METROPOLITAN MUNICIPALITY PROJECT: MUNICIPALITY-DRIVEN ENERGY EFFICIENCY AND REFURBISHMENT Overview: The Ekurhuleni Metropolitan Municipality has a stepped tariff system. NERSA allowed
Implementing the National Development Plan at at local government level
 Implementing the National Development Plan at at local government level Sue Bannister Commissioner on National Planning Commission SALGA 11 th National MM s Forum, George 31 August 2017 1 DP The National
Fleet Management - Logistics
 Progressing towards a whole new level of efficiency in Fleet Management for the Logistics and Transportation industry by leveraging next-generation technology. Connected Intelligence Software for Fleet
SUMMARY OF DISTRIBUTION BUSINESS
 Filed: 0-0- EB-0-0 Schedule Page of SUMMARY OF DISTRIBUTION BUSINESS.0 INTRODUCTION Hydro One Networks Inc. is licensed by the Ontario Energy Board (the Board ) to own, operate and maintain electricity
SUSTAINABLE GROWTH STRATEGY FINANCIAL SUSTAINABILITY STRATEGIC PARTNERSHIPS BUSINESS INTELLIGENCE
 2015-2020 Summary of 5 year SUSTAINABLE GROWTH STRATEGY B-BBEE LEVEL 1 CONTRIBUTOR ISO 9001 14001 20001 OHSAS 18001 CONTEXTUAL BACKGROUND CONTEXTUAL BACKGROUND The Coega Development Corporation (CDC) has
This Corporate Plan has been developed to balance the needs of today with the challenges and opportunities of the future.
 Contents 1. Executive summary... 3 2. Summary of financial and pricing forecasts... 5 3. Introduction... 8 4. Our customers... 9 5. An industry in transition... 10 6. Strategic goals... 14 7. Strategic
Department Name of Surname Water and Sanitation: Directorate Water Use Efficiency Directorate. Willem Wegelin Date WRP Consulting Engineers Pty Ltd
 THE PRESENTATION NO DROP CERTIFICATION TITLE PROGRAMME Moloko Raletjena Presented by: Department Name of Surname Water and Sanitation: Directorate Water Use Efficiency Directorate Willem Wegelin Date WRP
Business Plan
 Business Plan 2017-2018 rev. May 2017 MESSAGE FROM THE CEO As the Chief Executive Officer of PEC, I am pleased to present the 2017 2018 Business Plan, a tool that will enable the Cooperative to make informed
ACCELERATING SDG 7 ACHIEVEMENT SUMMARY FOR POLICYMAKERS
 ACCELERATING SDG 7 ACHIEVEMENT SUMMARY FOR POLICYMAKERS ACCELERATING SDG 7 ACHIEVEMENT POLICY BRIEFS IN SUPPORT OF THE FIRST SDG 7 REVIEW AT THE UN HIGH-LEVEL POLITICAL FORUM 2018 Lead Organizations PAKISTAN
What new capabilities
 White Paper Emerging Trends in Analytics What new capabilities mean for distribution grid management Kent Hedrick Director of Grid Management Solutions at Landis+Gyr Future. Ready. SM July 2014 Analytics
HEALTH PURCHASING VICTORIA STRATEGY. December 2017
 HEALTH PURCHASING VICTORIA 2018-2022 STRATEGY December 2017 CONTENTS Contents... 2 Executive Summary... 3 Operating Environment... 5 HPV Vision and Values... 9 HPV Strategy 2018-2022: Framework... 10 HPV
Strategic Contextualisation for the NRF 2011/ /14 Annual Performance Plan
 Strategic Contextualisation for the NRF 2011/12 2013/14 Annual Performance Plan TABLE OF CONTENTS EXECUTIVE SUMMARY 1 1 INTRODUCTION 2 1.1 Development of the NRF strategy 2 CORE ASPECTS OF VISION 2015
Independent Power Producer procurement Improving integration with municipal distributors
 25 th AMEU Technical Convention 4-7 October 2015 Independent Power Producer procurement Improving integration with municipal distributors Dr Clinton Carter-Brown IPP Office A partnership between: Department
Information and Communication Technologies Strategic Plan 2016/ /20
 Information and Communication Technologies Strategic Plan 2016/17 2019/20 Foreword Mike Russell Chief Information Officer We must continue providing the infrastructure and vital support systems to keep
7-8 NOVEMBER 2018 CAPE TOWN, SOUTH AFRICA
 7-8 NOVEMBER 2018 CAPE TOWN, SOUTH AFRICA South Africa s IPP Procurement Programme SOUTH AFRICA S PREMIER WIND ENERGY CONFERENCE & EXHIBITION South Africa s IPP Procurement Programme is informed by the
Improving Resiliency OPERATIONAL OPTIMISATION
 11.0 Improving Resiliency 11.1 OPERATIONAL OPTIMISATION ISO 17025 Accredited Laboratory Services Assuring Water Quality Umgeni Water s Laboratory Services is a dynamic centre of excellence comprising four
Organisational strategy
 2016 2020 Organisational strategy 2016 2020 1 Contents Vision 1 Responding to a Changing World 2 Sustainable Development Goal Focus 3 Working within the Plan International Federation 4 Purpose and Values
I. CITIES AND ENERGY USE
 I. CITIES AND ENERGY USE A. Background Energy is the lifeblood of modern industrial society. Modern cities rely heavily on fossil fuels for the maintenance of essential services and for powering devices
Policies and Measures for Renewable Energy and Energy Efficiency in South Africa
 Policies and Measures for Renewable Energy and Energy Efficiency in South Africa Background The South Africa democratic elections held of 1994 initiated a change in government policy across all sectors.
Disperses Taxes. NATIONAL TREASURY National Revenue Fund
 SOCIAL CONTRACT Social Obligation & Social Benefit MUTUAL RELATIONSHIP Citizens Pays Taxes SARS Collects Taxes Engages Private Sector to Create Public Benefits from Tax Revenue Disperses Taxes NATIONAL
STRATEGIC OBJECTIVE STATEMENTS REFERENCE VOLUME SUPPLEMENT TO STRATEGIC PLAN 2015/ /20 AND ANNUAL PERFORMANCE PLAN 2016/ /19
 STRATEGIC OBJECTIVE STATEMENTS REFERENCE VOLUME SUPPLEMENT TO STRATEGIC PLAN 2015/16 2019/20 AND ANNUAL PERFORMANCE PLAN 2016/17 2018/19 Operations statement 1.1 Strategic Statements SP 2015/16-2019/18
IMPLICATIONS OF ECONOMIC AND SOCIAL OBJECTIVES FOR ELECTRIFICATION IN SOUTHERN AFRICA
 IMPLICATIONS OF ECONOMIC AND SOCIAL OBJECTIVES FOR ELECTRIFICATION IN SOUTHERN AFRICA C T Gaunt Department of Electrical Engineering, University of Cape Town 1 Introduction Electrification is an electrical
EXHIBIT GG. DATE FILED: February 9, :29 PM FILING ID: 9B5E9BDEA737B CASE NUMBER: 2016CV144
 DATE FILED: February 9, 2017 4:29 PM FILING ID: 9B5E9BDEA737B CASE NUMBER: 2016CV144 DRAFT 2008 ENERGY POLICY CITY COUNCIL MEETING JANUARY 6, 2009 1 1 Electric Energy Business Environment
Risk Appetite Statement
 Risk Appetite Statement May 2018 Risk Appetite Statement Contents 1. Mission, Vision, Values and Beliefs... 3 2. Introduction... 3 3. Overall Risk Appetite... 4 4. Risk Framework... 4 5. Key Risk Appetite
Energy Solutions for Africa
 Energy Indaba 2010 Energy Solutions for Africa Energising Africa the road to achieve sustainable energy systems in Southern Africa Thulani S. Gcabashe February 2010 The BuiltAfrica Group Inspired by this
SCALING-UP RENEWABLE ENERGY PROGRAM (SREP) COUNTRY INVESTMENT PLAN KENYA
 COUNTRY INVESTMENT PLAN KENYA") SCALING-UP RENEWABLE ENERGY PROGRAM (SREP) COUNTRY INVESTMENT PLAN KENYA SREP Sub- Committee Meeting, Cape Town June 21, 2011 1 Introduction Kenya is one of the six Pilot Countries selected to benefit
SCALING-UP RENEWABLE ENERGY PROGRAM (SREP) COUNTRY INVESTMENT PLAN KENYA SREP Sub- Committee Meeting, Cape Town June 21, 2011 1 Introduction Kenya is one of the six Pilot Countries selected to benefit
Municipal by-laws as an instrument towards sustainable some perspectives from the City of Johannesburg
 The Role of Municipal By-laws in Good Local Government in South Africa Municipal by-laws as an instrument towards sustainable some perspectives from the City of Johannesburg 04 June 2015 Introduction /
New energy New opportunities. Our pathway to net zero and smart, sustainable workplaces
 New energy New opportunities Our pathway to net zero and smart, sustainable workplaces 1 The time is now Renewable energy New energy technology is rapidly evolving. Energy markets are transforming to unlock
The need and desirability of this Project is discussed below, including strategic plans, frameworks and policies applicable to the area and Project.
 2 PROJECT MOTIVATION When considering an application submitted under the EIA Regulations (GNR 982/2014), the relevant competent authority must take a number of factors into consideration, including the
Managing our environmental impacts
 Managing our environmental impacts We operate in countries that are particularly environmentally vulnerable and strive to improve our own resilience and mitigate our impact on the environment. The ICT
SECTOR ASSESSMENT (SUMMARY): ENERGY
: ENERGY") Power Sector Rehabilitation Project (RRP KGZ 44198) SECTOR ASSESSMENT (SUMMARY): ENERGY Sector Road Map 1. Sector Performance, Problems, and Opportunity a. Introduction 1. The Kyrgyz Republic is a landlocked
Power Sector Rehabilitation Project (RRP KGZ 44198) SECTOR ASSESSMENT (SUMMARY): ENERGY Sector Road Map 1. Sector Performance, Problems, and Opportunity a. Introduction 1. The Kyrgyz Republic is a landlocked
Performance against Shareholder Compact 2014/2015
 54 UMGENI WATER AMANZI ANNUAL 1.0 PG 04-05 2.0 ORGANISATIONAL PG 06-15 3.0 CHAIRPERSON S PG 16-23 4.0 CHIEF EXECUTIVE S PG 24-31 5.0 CORPORATE GOVERNANCE PG 32-47 6.0 STAKEHOLDER UNDERSTANDING AND SUPPORT
Itron Analytics. Maximize the Full Value of Your Smart Grid. Image
 Itron Analytics Maximize the Full Value of Your Smart Grid Image Complete Data Intelligence Lifecycle The ultimate goal of the smart grid is to ensure safe and reliable delivery of energy. Building your
Sustainability Indicators
 Sustainability Indicators Contents Introduction...2 Background...2 Objectives...2 Process used to identify these metrics...3 Next steps...3 Appendix 1 - Driver diagram overview...4 Appendix 2 - Driver
INTERNAL AUDIT PLAN AND CHARTER 2018/19
 INTERNAL AUDIT PLAN AND CHARTER 208/9 PURPOSE OF REPORT. To present the proposed 208/9 audit plan and charter to the Audit Committee for consideration and approval..2 The Internal Audit Plan for 208/9
Impact of Energy Efficiency and Renewable Energy on Municipal Revenue
 Impact of Energy Efficiency and Renewable Energy on Municipal Revenue 18 March 2015 1 2 SALGA MANDATE SALGA Mandate Lobby, Advocate & Represent Employer Body Capacity Building Support & Advice Strategic
A robust and systematic review.
 Principal risks and uncertainties A robust and systematic review. The Board considers these to be the most significant risks faced by the Group that may impact the achievement of our six strategic drivers.
Integrated Development Plan 2018/19 Feedback and Listening Session November Region C
 Integrated Development Plan 2018/19 Feedback and Listening Session November 2017 Region C Outline the City s strategies, outcomes and priorities towards development Purpose Give feedback on issues raised
The CEEP should recognize the following initiatives that have been adopted by the City of Campbell River:
 CITY OF CAMPBELL RIVER REQUEST FOR PROPOSAL NO. 608 (SUSTAINABLE) OFFICIAL COMMUNITY PLAN (SOCP) UPDATE PARTNERS IN COMMUNITY APPENDIX B COMMUNITY ENERGY AND EMISSIONS PLAN Page 1 of 5 Proposal Background
ENERGY SUMMIT DECLARATION
 ENERGY SUMMIT DECLARATION We, the delegates drawn from municipalities, national and provincial government, together with international guests, technology partners, academic institutions, business and stakeholders
BUSINESS PLAN
 BUSINESS PLAN 2018-19 1 Putting Standards at the heart of Social Work and Social Care practice and education and training. 2 Regulating the Workforce and Social Work Education and Training to establish
Pricing and the tariff
 Pricing and the tariff A message from the chairman There are two major long-term causes of Eskom s financial woes. Firstly, South Africa has priced electricity below its full cost for many decades. Whereas
DISCUSSION PAPER ON THE DECOMMODIFICATION OF ELECTRICITY
 YCLSA 5 TH NATIONAL CONGRESS DISCUSSION PAPER ON THE DECOMMODIFICATION OF ELECTRICITY Contextual Background In South Africa, the government utility Eskom has a control on the generation and transmission
Report of the workshop on Energy Efficiency and Accessibility in Africa. Coalition for Energy Efficiency and Accessibility in Africa
 Report of the workshop on Energy Efficiency and Accessibility in Africa Climate Chance Africa Summit - Abidjan 29 June 2018 Coalition for Energy Efficiency and Accessibility in Africa ENGIE, CAN Tanzania,
CAPE TOWN Institutionalising Low Carbon Development
 CAPE TOWN Institutionalising Low Carbon Development LOCS Dar Es Salaam 2013 Sarah Ward Energy and Climate Change City of Cape Town Story with a gap Where did we begin Where are we now Strategy and building
Overview of Indian Power Sector & Opportunities for for promoting Social Inclusion in Indian power sector
 Overview of Indian Power Sector & Opportunities for for promoting Social Inclusion in Indian power sector Dr. Pradeep Perera Head Energy ( India) Principal Energy Specialist Asian Development Bank Generation
Promoting economic development & capacity through procurement
 Promoting economic development & capacity through procurement Presentation to the 3 rd Annual Tshwane International Trade and Infrastructure Investment Conference CSIR ICC 24 May 2010 Dr. Miriam Altman
Reliability and the Future of the Electricity Grid: A North American Bulk Power System Perspective
 Reliability and the Future of the Electricity Grid: A North American Bulk Power System Perspective Mark Lauby, Senior Vice President and Chief Reliability Officer North American Electric Reliability Corporation
WASTE MINIMISATION CAMPAIGN BRIEFING PACK February June 2016
 WASTE MINIMISATION CAMPAIGN BRIEFING PACK February June 2016 1. CAMPAIGN OVERVIEW The new Integrated Waste Management Policy and the National Waste Management Strategy seek to minimise the waste stream
Global Reporting Initiative and United Nations Global Compact Index. Bigger Picture 2017 Sustainability Report
 Global Reporting Initiative and United Nations Global Compact Index Bigger Picture 2017 Sustainability Report Contents Global Reporting Initiative and United Nations Global Compact Index Telstra s sustainability
EUROPE 2020 A European strategy for Smart, Sustainable and Inclusive Growth
 EUROPE 2020 A European strategy for Smart, Sustainable and Inclusive Growth Europe faces a moment of transformation. The crisis, which has no precedent in our generation, has wiped out years of economic
Meeting the Challenge of Climate Change
 Meeting the Challenge of Climate Change A Business Perspective, March 2007 Tony Wood *Includes Contact Energy Overview of Origin Energy Exploration & Production 2,436 2P reserves Market focussed portfolio
DEPARTMENT OF TELECOMMUNICATIONS AND POSTAL SERIVCES: NATIONAL E- STRATEGY AND ICT SMME SUPPORT STRATEGY
 21 August 2017 DEPARTMENT OF TELECOMMUNICATIONS AND POSTAL SERIVCES: NATIONAL E- STRATEGY AND ICT SMME SUPPORT STRATEGY 1. INTRODUCTION In April 2017, the Minister of Telecommunications and Postal Services,
South Africa s Grid Emission Factor
 South Africa s Grid Emission Factor There is no general agreement on either the methodology for calculating the Grid Emission Factor (GEF) for South Africa s electricity grid, or on the actual number;
Public Service Secretariat Business Plan
 Public Service Secretariat 2008-11 Business Plan Message from the Minister The Public Service Secretariat is a Category 2 entity that provides leadership in the area of strategic human resource management.
The CARICOM Human Resource Development 2030 Strategy
 The CARICOM Human Resource Development 2030 Strategy HRD at a Glance HRD2030-PULLOUT 20171227a.indd 1 2 The Mandate The XXV Inter-Sessional Meeting of the Conference (March 2014) mandated the Council for
City of West Palm Beach Strategic Plan
 City of West Palm Beach Strategic Plan 2019-2023 December 2018 Table of Contents Page i Table of Contents This Page Purposely Left Blank Table of Contents Page ii Table of Contents Methodology... 1 Project
Climate Change Risks and Opportunities for the Electricity Distribution Industry
 Climate Change Risks and Opportunities for the Electricity Distribution Industry Author and Presenter: Liteboho Makhele, BTech. Arch. Tech Senior Consultant Sustainable Built Environment, Camco 1 Introduction
IFC s Approach to Climate Change in the Electricity Sector
 IFC s Approach to Climate Change in the Electricity Sector Oct 2008 Contents/Agenda 1. Climate Change, Economic Development, & the Electricity Sector 2. Mitigating Climate Change: Efficiency, Technology,
Scorecard - Toronto Hydro-Electric System Limited
 Scorecard - Toronto Hydro-Electric System Limited 9/23/2015 Performance Outcomes Performance Categories Measures 2010 2011 2012 2013 2014 Trend Industry Distributor Target Customer Focus Services are provided
draft Environment Strategy
 draft Environment Strategy Our Commitment Our vision is to be the lifestream of Sydney for generations to come. We want to be world-class, delivering essential services that our customers love, in our
BIGEN AFRICA CORPORATE PROFILE >> Page 1. Corporate Profile
 BIGEN AFRICA CORPORATE PROFILE >> Page 1 Corporate Profile BIGEN AFRICA CORPORATE PROFILE >> Page 2 BIGEN AFRICA CORPORATE PROFILE >> Page 3 BIGEN AFRICA CORPORATE PROFILE >> Page 4 BIGEN AFRICA s smarter
TABLE OF CONTENTS. Overview Resource Planning, Energy Efficiency and Renewable Energy Transmission & Distribution System Reliability...
 TABLE OF CONTENTS Overview... 3 Resource Planning, Energy Efficiency and Renewable Energy... 5 Transmission & Distribution System Reliability... 6 Customer Service... 7 Regionally Competitive Rates...
Understanding Microgrids
 With the increased focus on renewable energy, efficiency and the need to make the business case for the smart grid, a growing number of stakeholders are focusing on smart microgrids as a viable approach
How organisations re-imagine their inclusiveness and localisation agenda to drive business value
 How organisations re-imagine their inclusiveness and localisation agenda to drive business value DISRUPTING THE INCLUSIVENESS AND LOCALISATION JUGGERNAUT Why organisations should rethink their supply chain
CORPORATE SUSTAINABILITY & RESPONSIBILITY INAUGURAL REPORT CSN9C23
 CORPORATE SUSTAINABILITY & RESPONSIBILITY INAUGURAL REPORT 2019 002CSN9C23 TABLE OF CONTENTS WHO WE ARE Who We Are PAGE 1 CEO s Message PAGE 2 Message from the Board of Directors PAGE 4 Our Vision, Mission