ADVANCING NEW STRATEGIC FOCUSES THROUGH PERFORMANCE-BASED EVALUATION THE GROWTH OF STATE DOT APPROACHES
|
|
|
- Laureen Ray
- 6 years ago
- Views:
Transcription
1 ADVANCING NEW STRATEGIC FOCUSES THROUGH PERFORMANCE-BASED EVALUATION THE GROWTH OF STATE DOT APPROACHES A Thesis Presented to The Academic Faculty by Elliot Asher Sperling In Partial Fulfillment of the Requirements for the Degrees Master of Science in the School of Civil and Environmental Engineering and Master of City and Regional Planning in the School of City and Regional Planning Georgia Institute of Technology August 2017 COPYRIGHT 2017 BY ELLIOT ASHER SPERLING
2 ADVANCING NEW STRATEGIC FOCUSES THROUGH PERFORMANCE-BASED EVALUATION THE GROWTH OF STATE DOT APPROACHES Approved by: Dr. Catherine L. Ross, Advisor School of City and Regional Planning Georgia Institute of Technology Dr. Randall L. Guensler, Advisor School of Civil and Environmental Engineering Georgia Institute of Technology Dr. Adjo Amekudzi-Kennedy School of Civil and Environmental Engineering Georgia Institute of Technology Date Approved: 28 July, 2017
3 To my wonderful loving family that continues to inspire and encourage me over the years..
4 ACKNOWLEDGEMENTS This research is generously supported and funded by the Federal Highway Administration s Eisenhower Transportation Fellowship Program. The Center for Quality Growth and Regional Development (CQGRD) provided me the institutional support and my advisor, Dr. Catherine Ross, generously offered her ongoing input, direction, and inspiration throughout the development of this thesis, the survey, and other CQGRD projects that connected to this thesis area. Dr. Randall Guensler, my main advisor in the Department of Civil Engineering, guided me on the detail of Federal legislation and drove me to focus on areas that states would find most useful to implement and create new knowledge that could be shared with other researchers. His in-depth knowledge greatly helped me to tie together major concepts in this research with finer details. I would also like to thank Dr. Adjo Amekudzi-Kennedy who, based on one of my first courses taken with her as well as the practicioner panels she led, helped me envision early-on the overall direction for this thesis. Her knowledge of national practices provided me with insights and inspiration to undertake this research. I would also like to thank Dr. Jamie Fischer at Georgia Regional Transportation Authority (GRTA), Sam Zimbabwe at District Department of Transportation (DDOT), and David Lee at Tennessee DOT (TDOT) who provided input and piloting of the national survey. Towards the end of this research, Dr. Rebecca Lewis at University of Oregon provided me with further ideas and guidance. As well, several state DOT staff generously provided their review and feedback to elements of this research. I am thankful to all of those that supported me along the way: Georgia Tech engineering and planning colleagues, many of my colleagues at CQGRD, and several of my former co-workers. iv
5 TABLE OF CONTENTS ACKNOWLEDGEMENTS LIST OF TABLES LIST OF FIGURES LIST OF SYMBOLS AND ABBREVIATIONS SUMMARY iv vii ix xi xiv CHAPTER 1. Introduction Focus on State DOT Approaches Addressing Challenges Facing State DOTs in Project Evaluation Responding to Federal Policies Developing a Performance-Based Approach to Capital Programming Use of a National Survey to Examine Agency Practices Highlighting Key Agency Practices Advancing Agency Practices 9 CHAPTER 2. Broader Context Of Federal Policies Moving Ahead for Progress in the 21 st Century (MAP-21) Fixing America s Surface Transportation Act (FAST Act of 2015) Implementation of State-Based Performance Focuses 17 CHAPTER 3. Developing a Performance-Based Approach for Mobility Driven Investments Rationale for Performance-Based Approaches Aligning Funding with Strategic Priorities Refining Approaches to Focus on SMART Objectives Goal and Objective Linkage to Performance Measurement and Evaluation Creating a Strengthened Link Between Planning and Programming Decision Science Applications and Trade-off Analysis Operational Objectives Leading to Performance-Based Evaluation Approaches Ensuring Decision Quality 48 CHAPTER 4. State Transportation Process Evaluation Focus of the Survey Survey Findings State DOT Evaluation Methods State DOT Programming and Project Evaluation Challenges Furthering Federal Reforms and Coordination Interest in New Approaches for State DOTs 76 CHAPTER 5. Case Studies 82 v
6 5.1 Oregon DOT s Enhance Program and Qualitative MODA Emphasis Enhance Funding Project Assessment Stronger Planning and Programming-Based Linkages through Mosaic Tool Maine DOT s Intermodal Freight Program Utah DOT s Strategic Prioritization Process UDOT s Collaborative Approach to Planning and Programming in Utah UDOT s Strategic Goal Alignment UDOT s Capital Project Prioritization Development from Legislation UDOT s Capital Project Prioritization Process Limitations of UDOT s Prioritization Approach and Potential Emphases Virginia DOT s Cross-Modal SMART Scale Prioritization Process Motivations for Adopting SMART SCALE for Prioritizing Improvements VDOT s SMART SCALE Factor Areas and Evaluative Measures VDOT s SMART SCALE Screening Process and Data Responsibilities Technical Description of Evaluation Measures under SMART SCALE Integrating SMART SCALE Evaluation Measures into an Overall Score Measuring Outcomes Is it a Bigger Bang for the Buck? Suggesting Practices from State DOT Project Evaluation Approaches Agency Lessons on Adaptiveness in Facing an Autonomous Vehicle Future: Responding to the Needs and Future Demands 139 CHAPTER 6. Piecing Together The Future For Capital Improvement Performance Evaluation 144 APPENDIX A. NATIONWIDE SURVEY OF PERFORMANCE PRIORIZATION AND EVALUATION PROCESSES 158 APPENDIX B. UTAH CODE ( ) PROJECT PRIORITIZATION PROCESS REQUIREMENTS 168 APPENDIX C. UDOT POLICY PROJECT PRIORITIZATION PROCESS (UDOT 07-10) 169 APPENDIX D. SMART SCALE E.1 AIR QUALITY AND ENVIRONMENTAL EFFECT MEASURE 173 APPENDIX E. VDOT PROJECT SCORECARD EXAMPLE SMART SCALE PROJECT EVALUATION 174 REFERENCES 175 vi
7 LIST OF TABLES Table 1 Summary of Rulemakings to Implement National Performance Management Measure 14 Table 2 FAST Act Funding for Federal-aid Highway Programs 16 Table 3 DOT Goal Areas Most Frequently Referenced by Agencies 19 Table 4 State Transportation Agency Respondent Position Titles 53 Table 5 Involvement of outside stakeholders in project evaluation/prioritization Table 6 Crosstabs analysis: changes in interest in adopting new metrics and whether BCA or CEA is used in project evaluation prior to STIP development Table Oregon STIP Allocations (Program Total) 85 Table 8 ODOT Cross Modal Criteria 87 Table 9 Example of MODA Weighting in Oregon Mosaic Tool 90 Table 10 Oregon Mosaic Specific Indicator Measures 92 Table 11 UDOT Capital Improvement Project Types 101 Table 12 UDOT Decision Support System (Existing-at-Grade Intersection) 103 Table 13 Projects Evaluated Under Virginia s SMART SCALE Program 108 Table 14 VDOT s SMART Scale Evaluation Measures 112 Table 15 Agencies Eligible as Project Applicants under SMART SCALE 115 Table 16 VDOT and Applicant Data Responsibilities: Calculating Measures 116 Table 17 VDOT SMART SCALE Safety Measures 119 Table 18 SMART SCALE Congestion Mitigation Measures 120 Table 19 SMART SCALE Accessibility Measures 122 Table 20 SMART SCALE Environmental Quality Measures 123 vii
8 Table 21 SMART SCALE Economic Development Support Measure (ED.1) 126 Table 22 Economic Development Support ED.1 Buffer Distance (10.3) 126 Table 23 SMART SCALE Economic Development Measures 127 Table 24 Intermodal Access and Efficiency Measure (ED.2) SMART SCALE 128 Table 25 SMART SCALE Transportation-Efficient Land Use Measure 128 viii
9 LIST OF FIGURES Figure 1 National Performance Rulemakings Implementation 15 Figure 2 Transportation Performance - Tree Analogy 29 Figure 3 Performance-Based Planning Process under MAP Figure 4 Transportation Planning Process 32 Figure 5 Cross-asset resource allocation framework (Maggiore & Ford, 2015) 42 Figure 7 Elements of Project Evaluation Decision Quality 49 Figure 8 Conceptual understanding of survey focus 52 Figure 9 Survey Participation (35 State DOTs*) 54 Figure 10 State responses in their STIP/Capital Improvement Programs encompassing the following modes 55 Figure 11 Project Evaluation Methods 57 Figure 12 Selected Elements State DOTs Reported Including in Their Long- Range Statewide Plans (Source: GAO, 2010) 58 Figure 13 State Assessment of Projects Within/Across Divisions and Funding 59 Figure 14 Number of Agencies Responding that use Surface Transportation Block Grants (STBG) Beyond Road and Bridge Projects (n=30) Figure 15 Factors Considered in Project Evaluation within Programs for NHPP Figure 16 Factors Considered in Project Evaluation Across Programs 64 Figure 17 Projects by difficulty to fund: average values of rank ordering 65 Figure 18 Challenges in Distributing Funds by Area, Program, and Mode in Project Evaluation Procedures Figure 19 Development of Project List Priorities outside the inclusion of MPO Transportation Improvement Programs (TIPs) n= Figure 20 Opinion on expanded funding eligibilities for NHFP and FASTLANE 70 ix
10 Figure 21 Impacts of Federal performance rulemakings on the STIP 74 Figure 22 Use and exploration: performance-based and project evaluation linkages 75 Figure 23 Great or Very Great Challenges to Using Performance Measures for Transportation Planning as reported by State DOTs Figure 24 Changes in interest over past 10 years in adopting additional prioritization evaluation criteria for major enhancement/mobility projects Figure 25 Mosaic Tool: Example Summary of Results 93 Figure 26 UDOT s Focus on Extending Pavement Life and Minimizing Pavement Lifecycle Costs 99 Figure 27 UDOT Existing Prioritization Process Scoring Summary 102 Figure 28 Role of Long-Range Planning in Prioritization of Projects at UDOT Figure 29 Linking Utah Unified Transportation Plan Goals and Objectives to Capital Improvement Prioritization: the Need for Stronger Alignment Figure 30 Process for Evaluating Projects Under VDOT s SMART SCALE 110 Figure 31 Virginia s Long-Range Planning Updates: 2004 to Present 111 Figure 32 Virginia Regional Weighting Typologies 113 Figure 33 SMART SCALE Eligible Project Locations 116 Figure 34 SMART SCALE Project Evaluation Process 130 Figure 35 Before and After SMART SCALE I-81 Exit 17 Interchange Project 133 Figure 36 Example VDOT SMART SCALE Project Scorecard 134 Figure 37 Virginia Route 106 & 630 Intersection Safety Project 135 Figure 38 Linking National Performance Goal Areas to State-Based Project Evaluation Processes 156 x
11 LIST OF SYMBOLS AND ABBREVIATIONS AADT Average Annual Daily Traffic AASHTO American Association of Highway Transportation Officials AV Autonomous Vehicle BCA Benefit-Cost Analysis CAV Connected and Autonomous Vehicle CEA Cost-Effectiveness Analysis CMAQ Congestion Mitigation and Air Quality CMF Crash Modification Factor CTB Commonwealth Transportation Board DOT Department of Transportation DRPT Department of Rail and Public Transportation (Virginia) EPA Environmental Protection Agency GAO Government Accountability Office FAST Act Fixing America s Surface Transportation Act FASTLANE Fostering Advancements in Shipping and Transportation for the Long-term Achievement of National Efficiencies FHWA Federal Highway Administration FRA Federal Railroad Administration FTA Federal Transit Administration GIS Geographic Information Systems GTFS General Transit Feed Specifications HB House Bill HSIP Highway Safety Improvement Program HSM Highway Safety Manual xi
12 IRAP Industrial Rail Access Program (Maine DOT) INFRA Infrastructure for Rebuilding America ISTEA Intermodal Surface Transportation Efficiency Act ITE Institute of Transportation Engineers ITS Intelligent Transportation Systems LOS Level of Service LRTP Long-Range Transportation Plan MCDA MODA Multi-Criteria Decision Analysis Multi-Objective Decision Analysis MOU Memorandum of Understanding MOVES Motor Vehicle Emission Simulator MPO Metropolitan Planning Organization MAP-21 Moving Ahead for Progress in the 21 st Century NCHRP National Cooperative Highway Research Program NHFP National Highway Freight Program NHPP National Highway Performance Program NHS National Highway System NPRM Notice of Proposed Rulemaking ODOT Oregon Department of Transportation PBPP Performance-Based Planning and Programming PM Performance Measure RTP Regional Transportation Plan SAFETEA-LU Safe, Accountable, Flexible, Efficient Transportation Equity Act: A Legacy for Users SB Senate Bill xii
13 SHSP Strategic Highway Safety Plan SMART Specific Measurable Achievable Relevant Time-Bound SMART 2 SMART SCALE Simple Multi-Attribute Weighting Technique System Management and Allocation of Resources for Transportation (VDOT s Prioritization Program) STBG Surface Transportation Block Grant STIP State Transportation Improvement Program TAMP Transportation Asset Management Plan TIGER Transportation Investment Generating Economy Recovery TDM Transportation Demand Management TPM Transportation Performance Management TEA-21 Transportation Equity Act for the 21 st Century TIP Transportation Improvement Program U.S. United States U.S.C. United States Code UDOT Utah Department of Transportation USDOT United States Department of Transportation UTC Utah Transportation Commission V/C Volume to Capacity (Ratio) VDOT Virginia Department of Transportation VMT Vehicle Miles Traveled V2I Vehicle-to-Infrastructure V2V Vehicle-to-Vehicle V2X Vehicle-to-Everything xiii
14 SUMMARY As a result of the enactment of the 2012 national surface transportation legislation, Moving Ahead for Progress in the 21 st Century (MAP-21), performance-based approaches have substantially grown in importance and use. States are examining their existing processes to ensure increases in transportation system performance over time. Certain states have developed internal processes that demonstrate use of a performance-based approach that effectively integrates both planning and programming decisions to meet agency-based objectives and national performance targets, and aligns with agency strategic goal areas. Through this research a national survey was developed and implemented to identify state transportation agency practices, which use multi-objective decision analysis (MODA) approaches to evaluate and prioritize strategic investments across asset categories. Agencies that are more advanced in project evaluation are able to quantify project values before they are funded to ensure that they are in alignment with an agency s overall goals and, at the same time, demonstrate worthwhile investments to the taxpayers in an environment of fiscal constraint. Recent shifts towards more data-driven approaches in project evaluation are providing far more objectivity and certainty to project sponsors, and have led to more collaborative transportation processes for planning and programming. By linking state-based and national performance goals to evaluation methods, states will be better positioned to improve performance over time for their multimodal transportation systems and better meet public expectations with the limited amount of resources and funding that are available. With growing uncertainties over future travel demands, the introduction of new technologies, and the phasing out of old technologies, strategic approaches will grow in importance. xiv
15 CHAPTER 1. INTRODUCTION The objective of this research is to assess state transportation performance evaluation practices that establish linkages between national performance goals and state-based objectives, in promoting the connection between states long-range transportation plans (LRTPs) and the project lists that are programmed into the State Transportation Improvement Program (STIP). Cross-modal objectives that are linked to project evaluation criteria are particularly examined, in light of national and many state-based focuses on transitioning the transportation system towards one that is more multi-modally connected and integrated, to allow for people to travel and goods to move in the transportation network in the most efficient and cost-effective manner possible. The purpose of this research is to help state transportation agencies better align their strategic goals with their investment strategies developed through their planning and programming processes. 1.1 Focus on State DOT Approaches State departments of transportation are the focus of this research, given their substantial role in managing the majority of the nation s transportation assets and their use of public resources for developing and operating their respective transportation systems in providing mobility and maintaining infrastructure condition and lifespan. State transportation agencies also have other indirect goals that may include: supporting economic development, improving quality of life, providing connections to employment and destinations, and reducing traffic fatalities and injuries. State DOTs are largely responsible for steering long-term investments through planning and also in managing a diverse portfolio of assets that include bridges, drainage systems, guardrails, pavements, 1
16 signage, and traffic signals, and other asset categories (Maggiore & Ford 2015). Allocations of limited resources across asset categories is a continual challenge for agencies that must also confront funding restrictions, programmatic limitations, public desires and political realities. This research mainly focuses on a specific set of cross-asset investments those focused on adding additional mobility across the transportation network. Agencies must make resource allocation decisions in light of long-term system performance objectives, and balance system improvement projects with maintenance and preservation focuses. There is growing recognition that agency process improvement is necessary to optimize capital investment allocations to best manage the growth and shift in transportation demands over time. Current practices primarily reflect siloed approaches, where resource allocation decisions do not consider system-wide or agency-wide implications. To a large extent, the focus has been on program areas or funding by geographic districts, rather than more comprehensive approaches for project evaluation (Maggiore & Ford 2015). Given the lack of strategic approaches used by agencies across program areas, this research is aimed at addressing this challenge through reviewing the practices in place and identifying ones that are effective in creating more strategic focuses. 1.2 Addressing Challenges Facing State DOTs in Project Evaluation Implementing cross-asset performance evaluation remains a challenge. This research addresses this challenge through the lens of performance-based focuses from MAP-21 and the FAST Act and other agency practices. The survey focuses on potential ways to address cross-asset performance evaluation, by addressing three main challenge 2
17 areas that are geographic, programmatic, and modal in nature: (1) equitably addressing transportation needs across geographies, (2) prioritizing investments across programs and divisions, and (3) funding in a mode-neutral manner (evaluating project effectiveness using metrics that are not specific to certain travel modes, e.g. person-mile and tonmile movement measures). In order to develop a set of complementary case studies, the survey was developed and administered to all state Departments of Transportation. Responses from agency officials were compiled into aggregate findings. States that use approaches that emphasize or look to demonstrate cross-modal/ multimodal, allocation-based focuses were examined through a review of their agency practices. Several factors were also considered in selecting case studies to ensure that the State Departments of Transportation (State DOTs) profiled in greater depth are representative, reflecting the diverse mix of geographies in the nationwide context - rural, suburban, and urban; Republican-majority and Democrat-majority legislatures and Governors of both political parties. Case studies in this research were used to inform recommendations for state transportation agencies. The recommendations included in this research emphasize linking performance measurement with project evaluation under multi-objective decision analysis (MODA) approaches, to help agencies align their major agency capital investment programs with national and state performance goal areas Responding to Federal Policies CHAPTER 2 provides background on Federal policies that led up to the two most recent Federal surface transportation authorizations: Moving Ahead for Progress in the 21 st Century (MAP-21) legislation passed in 2012 and Fixing America s Surface 3
18 Transportation (FAST Act) enacted in December of Surface transportation authorizations are national pieces of legislation that set forth federally authorized spending levels and creation and revision of transportation grant and formula programs. The national trend towards transportation performance measurement did not begin with MAP-21, but rather a much longer history of measuring transportation performance through asset management, measuring traveler delay, and assessing compliance with air quality standards and use of environmental impact assessments (Fischer, 2014). However, changes in the transportation planning process, emphasis on system management over system expansion, fiscal constraint, and use of multi-objective focuses in planning were not emphasized at the national level until the Intermodal Surface Transportation Efficiency Act (ISTEA), which has required the use of collaborative processes that agencies use to this day (Meyer, 2016). Passed in the early 1990s, the Intermodal Surface Transportation Efficiency Act, placed national attention and focus in aligning policy goals with outcomes and establishing collaborative focuses on managing the transportation system currently in place (USDOT 1995). Further legislation through TEA-21 and SAFETEA-LU further motivated changes in transportation planning and programming processes with increasing emphases on accountability, monitoring, prioritization of projects, and collaboration and communication with stakeholders (Fischer, 2014). Requirements for transportation plans to contain operational and management strategies to improve existing transportation facilities and further placed responsibilities with public officials to collaboratively decide transportation investments that best meet transportation needs (FHWA, 1998; FHWA, 2005; Fischer, 2014) 4
19 Since MAP-21 the national focus has moved further towards quantitatively measuring infrastructure performance through broad national performance goal areas. MAP-21 references seven performance goal areas: (1) safety, (2) infrastructure condition, (3) congestion reduction, (4) system reliability, (5) freight movement and economic vitality, (6) environmental sustainability, and (7) reduced project delivery delays (FHWA 2012). The seven performance goal areas led to the creation of national targets, enforcing a new approach by which states must quantifiably show how their states are addressing and meeting national performance goal areas, through either complying with targets or presenting courses of action to meet future performance targets. The Notice of Proposed Rulemakings (NPRMs) involved a comment period that incorporated input from state Departments of Transportation, MPOs, stakeholder interests like the American Association of Highway Transportation Officials (AASHTO) and the Institute of Transportation Engineers (ITE), and the general public to provide feedback and suggest alterations. FHWA used the comment period feedback to refine specific measurement criteria to be measurable and cost-effective to analyze and also ensure those criteria promote the alignment between what is measured and desired, in connecting target areas with outcomes envisioned across the national performance goal areas (FHWA, n.d.). With the performance rulemakings taking effect, limited evaluation is present on areas where state DOTs find they have interest in moving ahead with new practices in a performance-based environment of decision making for both capital programming and planning. State compliance with performance rulemakings will likely require new staff training and Federal Highway Administration support. From the survey results and a review of the literature, states have interest in aligning their practices more strategically 5
20 with broader agency goals and the national goal areas. The national survey used in this research gauges the extent of interest and use in multi-objective decision analysis based approaches for optimizing investment decisions with strategic focuses that include and extend beyond national performance-based target areas established from the NPRM process Developing a Performance-Based Approach to Capital Programming In CHAPTER 3, a performance-based approach to capital programming is further explored for capital projects that focus on the mobility of people and goods to move through the transportation system efficiently. In underscoring the rationale for a performance-based approach, this research examines performance-based metrics capable of measuring success and failure through the use of measurement criteria that link back to goals and objectives between plans and programs. As well, approaches that strategically cut across agency divisional divides to deliver desired performance outcomes is another element of this research. In this chapter, insights from private-sector based applications are referenced in their applicability to the transportation sector, in the realm of project performance evaluation. In recent years several agencies have refined and fine-tuned their approaches to make use of objective-driven evaluation criteria linked to programming decisions. This chapter further explains recommended emphases by FHWA and the Performance-Based Planning and Programming Guidebook around using specific, measurable, achievable, relevant, and time-bound (SMART) criteria, and how these criteria can develop around existing state decision-making processes (FHWA, 2017; Grant et al., 2013). Development of goals and objectives in state-based transportation 6
21 planning and the usage of these goals and objectives in state transportation plans is a practice that has grown commonplace (Pei et al., 2010). The next step, which is highlighted by this research, is for agencies to move forward in aligning state and national goals and objectives with state transportation-based programming. With project-based evaluation, goals and objectives can become better reflected in criteria that agencies operationalize across their decision-making processes. Recent project evaluation practices used emphasize comparatively evaluating projects across different funding programs and travel modes, a focus that connects project-level evaluation practices with performancebased measurement requirements Use of a National Survey to Examine Agency Practices In CHAPTER 4, the results of the national survey summarized as part of this thesis are used to gauge the extent of performance-based planning and programming practices employed by State Departments of Transportation. As shown in the survey results, there is interest among agencies in furthering their progress towards performance goals beyond those specified as national performance targets. The practices of interest to most states are shared in this chapter, based on agency responses from the national survey. A majority of states surveyed have a much broader interest in evaluating impacts of transportation investments beyond those that are federally-required. States looking towards funding flexibility to support more strategic approaches and the extent of interest in integrating new types of evaluation criteria are explained in greater detail. Through case studies in the following chapter, certain approaches are examined in closer detail that showcase the integration of performance objectives in both the planning and the programming stages, 7
22 scaled from the plan itself to the level of individual projects and how they impact performance over time Highlighting Key Agency Practices CHAPTER 5 examines specific agency practices from several state DOTs that have shifted their focuses towards performance-based planning and programming (PBPP). In this chapter, several states practices are referenced that help lead to an overall set of practices that states can consider. Four state practices are examined to provide recommendations that can help states advance new approaches in light of a new performance-based environment for planning and programming. In these case studies, a variety of approaches are examined. Oregon uses qualitative performance measures to inform project evaluation. Maine has notable freight programming focuses that look towards furthering intermodal connections, advancing economic development, and finding innovative ways to reduce highway expenditures in maintenance and lessen congestion costs. Utah uses a data-driven support system for helping them select a portfolio of investments that allows them to best meet future needs. Finally, Virginia s strategic prioritization process evaluates transportation projects across travel modes, and is examined in detail for its emphasis on mode-neutral project evaluation. The case study evaluation is used to inform recommendations directly from existing state departments of transportation practices in moving towards implementing cross-modal asset prioritization, particularly for state DOT projects that are mobility-driven in focus. The review of their practices is broad-based, given that state transportation agency processes have far more complexity beyond the scope of this research that require unique 8
23 programmatic approaches to address certain challenges. Suggestions for new research areas are also introduced in this chapter to help states transition their performance-based approaches to address uncertainty in the years ahead. Case studies are referenced where practices show future preparedness and embrace of new technologies in a state s planning and programming linkage. New vehicle technologies and ITS (intelligent transportation systems) communication infrastructure will place new challenges and opportunities in front of state transportation agencies Advancing Agency Practices The suggested refinements in evaluation approaches for capital programming to help state transportation agencies better align their strategic goals with their investment strategies are presented in CHAPTER 6. Areas of future research are also needed to fill some of the knowledge gaps that were exposed by this research, and that also require further evaluation, particularly in using new metrics and defining data-driven evaluation tools that can be used a broader level for assisting agency staff prioritize projects across programs and travel modes and be able to better anticipate project-level benefits at the outset. In establishing performance-based linkages to major capital investments, a major challenge that many states continue to struggle with is addressing the tradeoffs between levels of funding between various programs to support state-of- preservation projects and mobility-driven investments, and particularly this is a challenge in comparing travel modes. States face large funding constraints, and maintaining asset conditions while also meeting the demands of the public and politicians for improved travel options and better ability for people and goods to more reliably travel and move more effectively through the transportation system remains a persistent challenge. 9
24 CHAPTER 2. BROADER CONTEXT OF FEDERAL POLICIES Prior to the passage of the 1990 Intermodal Surface Transportation Efficiency Act (ISTEA), Federal policies emphasized expansion of the national transportation system. Since the passage of ISTEA, national transportation policies have shifted towards managing the transportation system in a way that balances mobility, accessibility, local community concerns, land use planning, the environment, and fiscal constraint (USDOT, 1995; Meyer, 2016). State transportation agencies are required to create long-range plans and use them as a basis for managing and developing their respective systems. This emphasis has remained in the passage of more recent surface transportation reauthorizations (Meyer, 2016). The next two reauthorizations, TEA-21 (in 1998) and SAFETEA-LU legislation (in 2005) provided some programmatic changes in favor of a more integrated, safer, and more reliable transportation system (FHWA, 1998; FWHA, 2005). Until the MAP-21 legislative reauthorization, states did not need to demonstrate performance progress to the United States Department of Transportation (USDOT). Each state transportation agency developed their own approaches towards managing their systems, and thus their practices could widely vary in how they managed state assets. The degree to which their long-range plans influenced their transportation investments over the short-term was entirely up to the discretion of each state (Grant et al., 2013). 2.1 Moving Ahead for Progress in the 21 st Century (MAP-21) Moving Ahead for Progress in the 21st century (MAP-21), passed in 2012, adopted a performance-based approach. There is an expectation for states to use performance measures to guide their progress. Progress is mandated to be shown in Federal performance 10
25 targets, in generating more efficient investments of Federal transportation dollars. Seven national performance goals are emphasized in MAP-21 legislation (FHWA, 2012): 1. Safety To achieve a significant reduction in traffic fatalities and serious injuries on all public roads. 2. Infrastructure condition To maintain the highway infrastructure asset system in a state of good repair. 3. Congestion reduction To achieve a significant reduction in congestion on the National Highway System (NHS). 4. System reliability To improve the efficiency of the surface transportation system. 5. Freight movement and economic vitality To improve the national freight network, strengthen the ability of rural communities to access national and international trade markets, and support regional economic development. 6. Environmental sustainability To enhance the performance of the transportation system while protecting and enhancing the natural environment. 7. Reduced project delivery delays To reduce project costs, promote jobs and the economy, and expedite the movement of people and goods by accelerating project completion through eliminating delays in the project development and delivery process, including reducing regulatory burdens and improving agencies work practices (FHWA, 2012). 11
26 In demonstrating progress towards performance measures established under the rulemaking process, MAP-21 requires that the long-range transportation plan (LRTP) address progress towards meeting federal and state performance measures for condition, safety, and system performance and other measures being used. The State Transportation Improvement Program (STIP) must also be developed in evaluating progress towards established performance targets, and also requires a description of the anticipated positive steps. For the statewide and nonmetropolitan planning process, the selection of projects in nonmetropolitan areas, with the exception of projects on the National Highway System (NHS), are made in cooperation with the affected nonmetropolitan officials or respective regional transportation planning organizations (FHWA, 2012). The final rulemaking on statewide and metro planning and non-metro planning requires there to be linkage between planning and programming. States are first to establish performance targets, then include those performance targets in plans, which they use to link their investment priorities to targets, and finally report on progress (FHWA, 2016b), as specified in United States Code: The statewide transportation planning process shall provide for the establishment and use of a performance-based approach to transportation decisionmaking (sic) to support the national goals...and the general purposes. The performance measures and targets established [in relation to national performance measures] shall be considered by a State when developing policies, programs, and investment priorities reflected in the statewide transportation plan and statewide transportation improvement program. 23 USC Section 135(d)(2); 49 USC Section 5304(d)(2). (Grant et al., 2013) MAP-21 placed requirements on State DOTs to incorporate performance management principles into a number of formal plans and planning processes, including: long-range transportation plans (LRTPs), (State) Transportation Improvement Programs (TIPs/STIPs), Strategic Highway Safety Plans (SHSPs), Transportation Asset Management Plans (TAMPs), and State Freight Plans. Several agencies are beginning to implement 12
27 performance management principles into these required plans; however, for many states, it remains a challenge to incorporate performance-based aspects into their various plans and have alignment between long-range plans and programming, while also addressing the seven national goal areas (Middleton, 2015). MAP-21 legislation required USDOT to undertake a rulemaking process to institute new federal performance measure targets that states track their progress against (FHWA, n.d.). State Departments of Transportation, along with other stakeholders, were afforded the ability to provide their input during each Notice of Proposed Rulemaking (NPRM) comment period. The Federal Highway Administration takes these comments into account in developing a final rule. The Transportation Performance Management (TPM) Rulemakings are shown in Table 1. As of May 20, 2017 all rulemakings are now in effect, with schedules shown in Figure 1 (FHWA, n.d.; Justia Regulations, 2017). Most states are only beginning to respond by refining their programming and planning processes to align with these rulemakings, as will be indicated by the national survey later in this thesis. 13
28 Table 1 Summary of Rulemakings to Implement National Performance Management Measures Rulemaking Final performance measures Measure applicability Safety Performance Measure Final Rule Pavement and Bridge Condition Performance Measure Final Rule System Performance Measure Final Rule Number of fatalities Rate of fatalities Number of serious injuries Rate of serious injuries Number of non-motorized fatalities and nonmotorized serious injuries Percentage of pavements of the Interstate System in Good condition Percentage of pavements of the Interstate System in in Poor condition Percentage of pavements of the non- Interstate NHS in Good condition Percentage of pavements of the non- Interstate NHS in Poor condition Percentage of NHS bridges classified as in Good condition Percentage of NHS bridges classified as in Poor condition Percent of the Person-Miles Traveled on the Interstate That Are Reliable Percent of the Person-Miles Traveled on the Non-Interstate NHS That Are Reliable Percent Change in Tailpipe CO2 Emissions on the NHS Compared to the Calendar Year 2017 Level Truck Travel Time Reliability Index Annual Hours of Peak Hour Excessive Delay Per Capita Percent of Non-SOV Travel. Total Emissions Reduction All public roads. All public roads. All public roads. All public roads. All public roads. The Interstate System. The Interstate System. The non-interstate NHS. The non-interstate NHS. NHS. NHS. The Interstate System. The non-interstate NHS. NHS. The Interstate System. NHS in urbanized areas with popl. + 1 million for 1st performance period and in urbanized areas with a popl ,000 for all other performance periods that are also in nonattainment or maintenance areas for ozone (O3), carbon monoxide (CO), or particulate matter (PM10 and PM2.5). *Delayed Indefinitely* 14
 Under the FAST Act there are expanded focuses, particularly in emphasizing freight, with two new national freight funding programs")
29 Figure 1 National Performance Rulemakings Implementation 2.2 Fixing America s Surface Transportation Act (FAST Act of 2015) Under the FAST Act there are expanded focuses, particularly in emphasizing freight, with two new national freight funding programs providing close to $10 billion in funding over 5 years. Average annual funding apportionments under the FAST Act for FY 2016 to 2020 are shown in Table 2 below. Under the FAST Act a total of $305 billion is authorized across all transportation programs. A new competitive source of funds is available through the INFRA Grant program, replacing the FASTLANE Grant program with some modification (Government Publishing Office, 2017). As well, through the FAST Act a new discretionary Federal-aid source of funding was created through the National Highway Freight Program (NHFP). Both the INFRA Grant and NHFP programs 15
30 have an intermodal component, but funding for non-highway freight improvements is restricted at no more than 10 percent of total funds (Congress.Gov, 2015; FHWA, 2016a). The inclusion of freight programs is a notable change from prior surface transportation authorizations, where previous funding offered no dedicated sources of funding for freight improvements. The dedication of funding to address the efficiency of movement of goods along state-designated freight routes is resulting in states producing plans to identify freight needs, and has led to new conversations with a more diverse group of stakeholders around how best to address the multitude of freight needs along with other transportation priorities. Table 2 FAST Act Funding for Federal-aid Highway Programs Federal-aid Highway Program (Apportioned): National Highway Performance Program (NHPP) Surface Transportation Block Grant Program (STBG) Congestion Mitigation and Air Quality Improvement Program (CMAQ) Highway Safety Improvement Program (HSIP) National Highway Freight Program (NHFP) Metropolitan Planning Program Railway-Highway Crossings Program Description Provides funding to improve condition and performance of National Highway System, construct new facilities, and meet state performance targets. Flexible program to fund transit, bridges, tunnels, carpooling, intelligent transportation systems, P3s, etc. Set-asides also for former TA projects: pedestrians, bicyclists, recreational trails, etc. Flexible funding source for transportation projects and programs to help meet the requirements of the Clean Air Act. Funding source for strategies, activities, and projects on a public road to correct or improve a hazardous road condition or address a highway safety problem. Formula program with eligibilities for construction, operational improvements, freight planning, and performance measurement. States can use up to 10 percent of NHFP funds for public or private freight rail, water facilities (including ports), and intermodal facilities. States must have a State Freight Plan to obligate funds. Funding for MPOs to carry out the metropolitan transportation planning process. Funding source for grade rail-highway crossing safety improvements to reduce the number of fatalities and injuries. Average Annual Funding Level FY (billions) $ $ $ $ $ $ $
31 2.3 Implementation of State-Based Performance Focuses As a result of MAP-21 performance requirements, significant levels of transportation agency-relevant research is focused on how states can promote performance-based outcomes. However, even before MAP-21, states were using performance measurement criteria in the areas of safety and asset condition (Government Accountability Office, 2010). This 2010 GAO report gave strong recommendation for moving towards performance-based planning requirements. The report used a survey, with participation of all 50 State Departments of Transportation (State DOTs), with an overall finding that a majority of states were assigning greater importance to factors such as political and public support than to the economic analysis of project benefits and costs. Additionally, the survey also found other substantial challenges, including that rural areas (through their Regional Planning Organizations) were not satisfied with existing processes for making sure that their rural needs are being met. However, the survey results at the time indicated several challenges that limit a broader use of performance measures, on, for instance, identifying indicators for livability, and in collecting data across transportation modes. This GAO report provides a considerable impetus for this research. Many of the limitations referred to in the GAO report on incorporating greater indicators is one that many states have faced persistent challenges in finding measures where adequate data is collected on different transportation modes and can be quantified using existing tools. Certain state practices are worth examining where their improvements to evaluation processes led to the inclusion of more user-based objectives tied with intended outcomes. The 2010 GAO survey is significant, because it is the last survey that specifically addressed performance measurement and involved the 17
32 participation of all states. Since the 2010 GAO Report, states have progressed in adopting performance measures that go beyond what was shown to be possible at the time. The survey detailed in CHAPTER 4 aims to see how far states have come. In recent years, certain state practices underscore an expanded level of interest in performance-based evaluation at the project-level to assess performance more strategically for new investments. Prioritizing projects by their intended outcomes can help to further the longstanding progress from ISTEA in using objectives as a guiding mandate to achieve intended outcomes. Many states share in having much broader agency goals and objectives than the performance target areas established by the MAP-21, and thus it is important to look into broader agency interests in adopting performance evaluation focuses that extend beyond the narrow set of evaluation areas from the final rulemakings. Many agencies reference goals in areas that include livability, economic vitality, system resilience, a multimodal and integrated transportation system, and accessibility, as shown by Table 3 below, which are entirely outside of the scope of the NPRMs originating from MAP-21 legislation. Pei et al. (2010) developed the below table based on a survey of 39 state DOTs that included asking them about their strategic goal areas and the researchers compiling the frequency that these goals are referred to across the agencies participating. 18
33 Table 3 DOT Goal Areas Most Frequently Referenced by Agencies Goals Tally Transportation System Safety and Security 26 Asset Management and Systems Preservation 22 Transportation System Mobility 14 Employee and Organizational Development 11 Customer Satisfaction 11 Economic Growth and Vitality 11 Environmental Quality and Sensitivity 10 Transportation System Effectiveness and Efficiency 7 Integrated and Multimodal Transportation System 7 Agency Program Service Delivery 7 Better Freight Movement 6 Stewardship 4 Public and Alternative Transportation Expansion and Improvement 4 System Preparedness, Security 4 Quality of life 4 Agency Accountability and Transparency 4 Stakeholder Communication and Cooperation 4 Modal Shift and Auto Trip Reduction 3 Agency Conservation and Business Efficiency 3 Highway Expansion and Capacity Increase 2 Agency Program Funding 2 Employee Innovation 2 Land Use and/or Economic Development Connection 2 Congestion Reduction 2 Accessibility 2 Sustainability 2 Cost Effective Projects 2 Agency Leadership 1 Needs vs. Community Wants 1 (Source: Pei et al., 2010) Of the goal areas mentioned above, 23 out of the 39 (59 percent) DOTs that responded indicated that they use performance measures to gauge success in achieving their strategic goals and objectives. These agencies often document their progress through key performance indicators that indicate how effectively their agencies are addressing challenges across their entire agency. 19
34 The connection between performance and project-level evaluation, however, is not well understood. There is far less documentation on how agency processes drive performance-based outcomes and connect system-wide performance measures with the prioritization of STIP project lists. Promoting desired performance outcomes and goals down to the transportation projects themselves is an area of practice with limited examination, but this research intends to partially fill that gap in understanding. When performance-based approaches connect with prioritization processes, performance focuses can then expand towards creating a planning and programming linkage. State Departments of Transportation are increasingly testing new approaches that connect evaluation methods with performance-based goals, despite a lack of federal initiatives to support this critical linkage (Brown & Ginsburg, 2016). Similar to the 2010 GAO study, the national survey developed and implemented as part of this thesis research and the state-based case studies, examine existing agency practices to further the extent of knowledge on strategic prioritization-based practices used by state DOTs. Previous literature has examined how State DOTs use programmatic categories to prioritize projects for funding, but mode specific silo approaches are commonplace in the development of most states STIP (GAO, 2010; Gunasekera and Hirschman, 2014). Many states have historically relied on a programmatic basis for funding, because of complexities with comparing projects across modes in using traditional metrics that are already widely-used and validated (GAO, 2010; Gunasekera and Hirschman, 2014). Evaluative criteria to compare multimodal options lacks presence in most DOT approaches, and so multimodal planning approaches remain challenging to introduce and implement. However, substantial change is underway across several agencies in 20
35 furthering multimodal planning objectives, even in a culture of planning that remains highway dominated (Sonnenberg et al., 2012). Successful examples of approaches that advance multimodal planning at the state-level are limited, and far less involve a systematic type of approach (Southworth et al., 2013). Existing research provides extensive background as to each state s modal responsibilities and their use of multimodal approaches in long-range planning, but there remains limited examination of how the project selection process differs from state to state and how each state s approaches balancing their list of projects is an area without much understanding. A significant focus for the survey and for researching state-based practices is looking into how state approaches differ in project evaluation and their use of evaluation criteria in informing project selection. The research gap has significantly narrowed in the past five years, given the growth in recent literature at the national level to understand these processes better (McCoy et al., 2016; Gunasekera and Hirschman, 2014). In the past year, USDOT examined the existing practices in the development and use of statewide transportation improvement programs (STIPs) (McCoy et al., 2016; FHWA, 2016). The research examines all 52 publicly-available STIPs (including Washington D.C. and Puerto Rico), and further details an analysis of 14 STIPs which represent the various techniques used in STIP development. State DOTs develop and use STIPs in the statewide transportation planning process to meet regulatory requirements and support broad agency goals (McCoy et al., 2016; FHWA, 2016). However, the review does not go further in examining the processes that states use to select projects and their various approaches towards advancing the projects that go into the STIP. From the findings and other literature states use a variety of methods to indicate performance, and 21
36 a common one used is through public-facing tools (e.g. dashboards), in documenting progress towards goals from their investments funded through their STIP. However, based on review of the literature, a lack of review is present on how refinements in agency evaluation practices results in a more focused set of project improvements being funded through the STIP, which more closely align with an agency s goals and objectives in a performance-driven funding environment. This research looks to answer how agencies can use project evaluation-based performance linkages to advance practices that more closely align with agency strategic goals. This research underscores the need to move towards mode-neutral project evaluation, where projects are compared across travel modes using criteria that is comparable across travel modes to evaluate project effectiveness without needing separate review processes. To become fully outcome-based focus in project evaluation and selection processes, this research touches on some of the challenges that exist, particularly in the existence of programmatic barriers and set funding formulas that prevent an optimal distribution of funds to address the travel needs of all transportation system users (Sonnenberg et al., 2012; Anderson et al. 2014; CMAP, 2012). Overcoming programmatic barriers is examined in the context of current state Departments of Transportation practices. As well, this research explores new practice areas in PBPP, under multimodal and multi-objective based decision-making focuses that address issues of fairness, transparency, and accountability. 22
37 CHAPTER 3. DEVELOPING A PERFORMANCE-BASED APPROACH FOR MOBILITY DRIVEN INVESTMENTS MAP-21 legislation required a performance-based planning and investment approach for all state transportation agencies. In practice, however, state transportation agencies used performance measurement strategies well before the 2011 passage of MAP- 21, albeit focused primarily on asset condition and safety (GAO, 2010). Performance measurement tools and practices originated primarily in the private-sector and transitioned over time towards greater use by government agencies to support process improvement and more strategically-aligned decision-making (Kettl, 1996; Radnor & Barnes, 2007). Performance measurement in a nutshell is a focus on examining outputs, or outcomes, that result from the inputs into a process, whether those inputs are measured by funding, staffing, time or some other cost variable. Typically, the most prevalent business application of performance measurement is in operations management, where there is the need to understand and measure the performance of a process. Performance assessment is based around indicators of efficiency and effectiveness. The level of efficiency is calculated by the productivity of a process and utilization of resources, which is a measure of the units of output derived from a given level of input. Effectiveness focuses on a broader set of measures that examine the appropriateness of outputs that come from a process, and whether they align with desired outcomes (Radnor & Barnes, 2007). 3.1 Rationale for Performance-Based Approaches Agencies are faced with making strategic choices about where to invest, how to balance competing and sometimes conflicting demands, and how best to attain the 23
38 outcomes desired. The larger the challenges or the greater the funding constraint, the more important it is to develop strategic emphases. Part of the impetus for using strategic approaches is to provide a level of transparency into the process where agencies set priorities, and also establish a directional sense for the agency on how targets will be achieved (Kettl, 1996). The move towards agency-based performance measurement approaches is to assess the outputs that most directly impact or benefit the end user in a more transparent, objective fashion. For the users of the transportation system, how much is spent on each funding program is not an indicator of success, rather the resulting outcomes in terms of improved travel opportunities, connections, reliability, and safety are examples of outcome areas directly tied to what matters to the end user. Performance measurement helps decision makers to advance their focuses beyond the traditional decision-making processes, legacy approaches, which focus extensively on the inputs instead of looking more deeply at the outputs and whether projects align with agency goals and objectives. Kettl (1996) refers to six steps that encompass a strategic approach: (1) define the mission that describes the operating focus of the agency; (2) frame the goals by combining the general purpose of the agency with what it seeks to achieve, and how to accomplish those goals, while also establishing the critical link between legal requirements and the management by agency officials over these standards; (3) set the objectives by translating broad agency goals into specific objectives that create a bridge between goals, plans, and programs; (4) assign responsibility for achieving objectives by linking organizational goals with specific objective criteria that also clearly defines how results will be produced; (5) specify output/outcome measures by defining measures or indicators that assess whether 24
39 agency objectives are being achieved and collect information on those measures; and finally (6) compare results with goals by seeing if their realized performance is reflective of what was being sought by the outcome measures used. The U.S. Government Performance and Results Act of 1993 was the first piece of national legislation to establish agency-wide performance review at the Federal level. Every federal agency since the 1993 law has been required to develop strategic plans, annual performance plans, and performance reports. However, those requirements were never made applicable to state transportation agencies. The passage of MAP-21 was the first step at the federal level to ensure that state transportation agencies adopt similar performance-based approaches. MAP-21 required that states adopt state-based and national performance targets into their plans, to tie their plans with investment strategies, and to report on their progress (FHWA, 2016b). In order to achieve success in their decisionmaking processes, agencies are examining ways to adopt strategic approaches towards managing and enhancing the totality of their owned and planned assets. The focus on using a strategic approach in planning and programming is to address the complexity of competing demands and where best to allocate limited resources to achieve efficiency and effectiveness (Kettl, 1996; Radnor & Barnes, 2007). Performance measurement provides clear, quantifiable indicators of how well an agency, under their decision authority, is addressing areas that impact the efficiency and effectiveness of their overall operations. Experiences from other countries, such as the United Kingdom, Sweden, and New Zealand, as well as some U.S. states and local governments offer evidence on how performance measurement tools boil down the complexity of decision making and can significantly inform important allocation judgments (USDOT 2010; Kettl 25
40 1996). For instance, in the United Kingdom, transportation operational improvements over the recent decade have taken priority over other investments and have resulted in significantly improved system reliability particularly over the short-term (USDOT, 2010). Hard data can provide compelling evidence for process change, such as the experience in the UK with traffic operational improvements. In many instances these improvements can overcome political pressures and bureaucratic obstacles to change. Within performance measurement decision processes, the use of decision analysis tools provides agencies with ways to prioritize the allocation of scarce funding, in examining the marginal productivity of allocating an extra dollar in one project or program versus another. Agencies can identify what project and program allocations are most effective at achieving agency objectives and invest accordingly. While performance measurement is not a panacea to all agency challenges, it is a critical tool to guide multi-billion-dollar investment decisions (Kettl, 1996). Performance measurement entails continual process improvement (Kettl, 1996). For performance measurement to maximize the efficiency and effectiveness of agency decision making, performance measurement has to integrate with larger agency processes in driving results that align with stated strategic goals (Maggiore & Ford, 2015). While states integrate MAP-21 performance requirements into their plans to measure performance over time, increased attention needs to be placed on agency development of evaluation tools to assess strategically the sets of proposed projects best aligned with agency goals. Prioritization methods are critical to use prior to the development of the STIP, to ensure resources are allocated in a cost-effective manner. The desire for enhanced 26
41 certainty, consistency, and best use of resources is encouraging many agencies to modify their practices and processes. Sets of emerging practices that link performance-based planning and programming (PBPP) are more closely examined, and also agency processes that rely on multi-objective criteria and decision analysis to evaluate not just system-wide benefits in plans, but projectlevel benefits. Many new practices emphasize criteria that offer increasing perspective of factors that are important to the transportation user, and also a larger view of transportation projects being more than a safety or asset improvement, but one that is an investment, generating returns in economic development, changes in access to opportunities and connections, and prompting changes in residential and business location patterns that impact rural, suburban, and urban form. Not all project impacts can be quantified in monetary terms, so the range of impacts important to stakeholders can be better measured and reflected in decision-making processes through using both quantitative and qualitative measures in multi-criteria decision analysis techniques (Barfod & Leleur, 2014). Certain agencies are refining and focusing their project evaluation methods on prioritization techniques that advance their strategic agency goals through project selection. For instance, a goal of increasing mobility across travel options can be emphasized through capital programming by identifying and prioritizing projects that are in alignment with this goal area. Based on national survey results described in CHAPTER 4, new state-based practices are further examined in light of recent developments and the growth in interest in multicriteria decision-analysis prioritization techniques. The analogy shown in Figure 2 below, is a way to capture and summarize the development of Federal transportation policies and the further progress made by several 27
42 state DOTs in broad processes of decision making. National emphasis prior to the passage of ISTEA legislation largely measured success by how many lane miles were added to keep up with congestion, or, in this analogy, how quickly the tree continues to grow. Since the passage of ISTEA legislation, the focus shifted with the recognition that the transportation system already experienced its prime growth, towards management of the transportation system in maintaining its health, or condition. However, it was not until MAP-21 that the focus at the Federal level shifted towards requiring states to quantifiably measure performance, in how well states are managing their individual transportation systems, based mainly on asset condition, system performance, and safety. Newer approaches and use of more extensive performance criteria beyond federal requirements are also unfolding, where agencies are looking at the roots of the transportation system. Previously, state and Federal policies did not require states to go beneath the surface, in how programming decisions reflect performance goals. This continues to be largely ignored in the Federal policy context. While projects being added would impact the transportation system s performance, there are no mandates placed nationally to ensure and validate that, beyond the collaborative processes between states and MPOs, transportation investments align with agency strategic goals or the goals set nationally. In the context of caring for a tree, projects, are added, but agencies do not necessarily need to compare which projects are of a higher quality and more beneficial to grow the transportation system. In addition, beneath the surface, certain roots are not as entrenched and are more vulnerable as they age; thus, they need more care, more attention, and more funding to strengthen the more vulnerable areas. Addressing these kinds of equity concerns should occur beneath the surface, prior to the programming of projects, in looking at what projects are beneficial to 28

43 the roots, that need further strengthening, to improve the overall foundation. By prioritizing what projects are being added from a mix of local, state, regional, and state priorities through multi-criteria evaluation techniques, and in involving the public in the process, there is greater strategic management and accountability over the system that is in place. Figure 2 Transportation Performance Growth of a Tree Analogy Aligning Funding with Strategic Priorities The process of transportation planning and programming needs to not only provide information that is of interest to decision makers, but also includes information that gives 29
44 the decision-makers involved a full understanding for the implications of the allocation decisions made in terms of other opportunities foregone, long-range impacts, economic, environmental, and equity impacts (Meyer and Miller, 2014). Evaluation and feedback comes through the use of performance measures that define data requirements and influence the development of analytical methods, but performance targets need to be placed in the context of goals achievement, otherwise there will be conflicting strategies that lead to decision-making impasses (Meyer and Miller, 2014). Specific to programming, when an agency is unable to assess whether their funded investments will allow them to achieve their strategic goals through the data available, or the public never sees the benefits that are suggested or assumed, then an insufficient feedback loop exists for an agency to develop conclusions on what investments are most necessary and where they are most needed, as shown by Figure 3 below. Developing a feedback loop to gauge the effectiveness of prioritization processes is a not-so-straightforward exercise, given the lag time in understanding a project s true benefits. Accounting for the estimated benefits of projects gives states much more understanding for the long-term implications in addressing multiple target areas and performance goals, so long as the estimates are based on robust data and reliable information. States that lack use of more quantifiable, cost-assessing approaches to align with agency strategic goals tend to compensate their efforts by focusing more narrowly on existing practices and conventional wisdom of what was done previously is what continues to be implemented. NCHRP Report 591, Factors that Support the Planning and Programming Linkage (2007) recommends the use of goals, objectives, measures and targets developed in the performance-based planning process (PBPP) to guide the 30
.")
45 identification of strategies. A successful PBPP directly ties goals and objectives to strategies, particularly those strategies that are able to address multiple goals and objectives (Grant et al., 2013). Figure 3 Performance-Based Planning Process under MAP-21 NCHRP Report 591, Factors that Support the Planning and Programming Linkage (2007) Typically, the goals that state DOTs have developed closely aligned with national regulations, which under MAP-21 and the FAST Act became performance-based in focus. States also include additional goals that address some of their more specific priorities for their state s multimodal transportation system. Through the transportation planning process, shown in Figure 4, states use their agency s overall vision to identify their priorities by involving the public and outside stakeholders in discussions on how the transportation system can be improved to better meet their needs. The priorities that are developed through this engagement process lead to the development of what should be a manageable set of goal areas that objectives can form from. The goal areas used to develop 31
.")
46 objectives through this process should encapsulate the transportation priorities for an individual state, have buy-in from stakeholders, and provide clear direction for the agency on transportation investment needs (FHWA & FTA, 2015; Maggiore & Ford 2015). Figure 4 Transportation Planning Process The Transportation Planning Process: Briefing Book (FHWA & FTA, 2015) The establishment of goals are typically an exercise undertaken as part of the development of statewide long-range transportation plans (LRTPs). These plans are meant to factor into the development of the statewide transportation improvement program (STIP), in basing agency-specific prioritization criteria on the goals of the long-range plan (LRP). The STIP includes each MPO s TIP, but the long-range plans are typically separate processes where the MPO coordinates with the DOT on long-term strategies and collaboratively-funded priorities. For the DOT the development of their portion of the STIP can vary from state to state based on their authorities over the process, which is discussed in the survey findings. State DOTs typically have considerable authority overseeing the 32
47 STIP development (FHWA & FTA, 2015). The state allocations in the STIP are in many cases based on historical precedent and funding restrictions, rather than aligning with the achievement of performance goals. Following MAP-21 legislation implementation, through the use of performance-based planning and programming (PBPP) through tools to guide and support this direct link in decision making, states will be able to promote increased alignment with state and national performance goals and target areas (FHWA & FTA, 2015; Maggiore et al., 2016) Refining Approaches to Focus on SMART Objectives Objectives that use specific targets and time frames are referred to as SMART: specific, measurable, agreed-upon, realistic, and time-bound (FHWA Component 1, 2017). The development of a performance measures to guide the intended outcomes and decisions necessary to be able to satisfy each goal area, involves the use of objectives that quantify how targets and agency performance goals will ultimately be achieved (Grant et al., 2013). This approach is recommended by the Performance-Based Planning and Programming Guidebook by FHWA, through the acronym SMART, as defined below: S: Specific Produce an objective that is sufficiently detailed to guide the development of viable approaches, without any one approach dictated or singled out by an objective M: Measurable Ensure that the objective allows for quantitative evaluation that describes what is to be accomplished. 33
48 A: Agreed upon Ensure that stakeholder interests come to the same consensus on agreeing to the objective used. It is most effective to have objectives that foster regional and statewide collaboration and coordination. R: Realistic Given limited resources and competing demands, the objective should be accomplishable within these limitations. For an objective to be achieved substantial coordination and collaboration on an investment strategy is needed. Other factors outside of traditional DOT purviews, such as land use, may have impact on the feasibility of achieving an objective and are important to take into account, and remedy when possible. An objective may need to be modified to become achievable, given progress toward objectives cannot be fully evaluated until after both the strategies and approaches are defined. T: Time-Bound Timeframes are important to identify for when the objective can be achieved, to ensure that efforts are prioritized to achieve the objective within the given time span (Grant et al., 2013). 3.2 Goal and Objective Linkage to Performance Measurement and Evaluation Without an overall framework to align a performance-based approach with agencywide efforts (i.e. aligning what an agency wishes to achieve and what it specifically needs to measure), project selection processes will inevitably lead to a less efficient use of resources. Lack of connection between what is measured and the data needed to assess performance achievement significantly reduces the effectiveness of the decision-making process. Agencies must agree upon what goals are important to measure, beyond their use of Federal performance goals, before they determine what their data needs are and what 34
49 information needs to be collected to inform strategies, otherwise decision making impasses are likely (Meyer and Miller, 2014; Brown & Ginsburg, 2016). NCHRP Report 591 (2007) refers to the linkage between a state s long-range transportation plan and short-term investments as the degree to which current funding commitments reflect the stated policies, goals, and objectives of the long-range plan. Performance requirements, developed as a result of MAP-21 legislation, greatly increase the onus on states to demonstrate this link Creating a Strengthened Link Between Planning and Programming A key focus of programming processes is the pairing of transportation projects with the funding available to accomplish agency s strategic goals and objectives over the budgeting period (Sinha and Labi, 2007). When planning and programming approaches are better linked, investment decisions are made with more foresight and more attention to agency goals and strategic focuses. Using an objective approach for balancing out project list priorities there should be a link between those objectives and the goals and targets established in state plans and national goal areas. Distinctions between investment categories in the programming process should be seen in a broad view, with operational improvements, preservation, and system expansion all viewed differently in assessing needs, balancing tradeoffs, setting priorities, and prioritizing investments (Cambridge Systematics & HDR, Inc., 2007). The lack of coordination between planning and programming remains a longstanding cause of concern, with attention raised to the problem since the mid-1970s (Sinha and Labi, 2007). Transportation agency attempts to establish a planning and 35
50 programming link have involved requirements for outcome-based programming approaches that are consistent with plans. However, large impediments exist that inhibit more coordinated, intentional creation of agency linkage between what are often two highly distinct processes for planning and programming. Planning and programming processes operate with differences in time frame. Planning is more long-term in focus, and programming is typically done over a short-term basis. Update cycles for plans and programs tend to differ, with plans updated over several years, compared to the use of regular budget cycles for programming (Meyer & Miller, 2014). Typically, agencies use evaluation criteria that promote little to no internal consistency between multimodal planning desires and the programming decisions made. Funding constraints are typically evident in programs, but not always in plans. As well, organizational responsibilities are typically separated out, with programming functions often carried out by different divisions within an agency, and with a lack of interface occurring between them (Sinha and Labi, 2007). The NCHRP Report 591 Factors that Support the Planning and Programming Linkage (2007), refers to and makes recommendation for developing a stronger linkage between planning and programming through several broad categories, which are valuable to examine in refining approaches: (1) Structure and content of plan documents lists out comprehensive and clearly defined goals, objectives and measures; (2) Analysis techniques and data quality are reliable and robust; (3) Organizational structure closely ties together planning and programming functions; 36
51 (4) Communication, both internal and external, is transparent about the planning and programming process; (5) External influences that are non-transportation-related are understood and visibly addressed in the process, such as those that are related to economic development or land use; (6) Leadership in the agency is knowledgeable and committed to have an objective-based planning and programming process. Clear understanding of roles and responsibilities at all levels of an agency is also critical. Challenges reported in 2007 in establishing linkages between planning and programming largely remain in the current environment. Insufficient cash flows and funding were repeated concerns then, as they are now. One state expressed how being so focused on not letting the system fall backwards predetermines their priorities by the need for system preservation or in funding previous commitments. In allocations across policy areas, it is also not clear how allocations are determined, in say, how much goes to preservation versus system expansion. Another state commented that political, geographic spread, and cash flow concerns are dominating programming decisions, which weakens the long-range planning process. Having an overly complex approach is also a concern, given that a shift towards performance assessment necessitates a need for greater statewide and regional accountability in financial management and programming, and that can further complicate an already non-straightforward planning and programming process. Traditional planning and programming processes often lack the level of transparency in project selection and funding that outside stakeholders would like to see in place. One state noted that direction 37
52 continues to come from elected officials in their process, which reinforces a traditional basis of planning and programming decisions, and that is a significant obstacle to the growth of performance-based, data-driven decision making (Cambridge Systematics & HDR, Inc., 2007). Geographic equity is also a highlighted concern, often expressed in terms of local and regional frustrations, in feelings of being short-changed by the limited funding that is available, and local factors and conditions not always given adequate consideration in planning and programming (Cambridge Systematics & HDR, Inc., 2007). There are significant hurdles faced in establishing a stronger planning and programming linkage using multimodal approaches (Southworth et al., 2013). Largely, this is due to the highly programmatic formula-based structure of the Federal program and state-level restrictions on non-highway and bridge expenditures. The use of stove-piped funding sources and organizational separation of modal divisions perpetuates the practice of siloed modal planning and programming, which provides limited ability to evaluate the tradeoffs of decisions and redirect the levels of investment across travel modes in moving towards a strategically-focused multimodal investment approach. (Maggiore and Ford, 2015; Cambridge Systematics & HDR, Inc., 2007) Even if plans espouse or closely follow a multimodal philosophy in their policy orientation, their achievement of multimodal goals tend to lag behind achievement of other goal areas (Cambridge Systematics & HDR, Inc., 2007). Many state agencies have approaches that deemphasize the multimodal programming link due to modal separation in decision-making and funding restrictions that hamper efforts towards multimodal approaches (Maggiore and Ford, 2015). So long as modal decisions are decided largely independent of each other in the planning process, states will find substantial difficulty in implementing cross-investment 38
53 approaches. The exercise of examining modal tradeoffs and promoting travel options has lacked clear examination in most planning and programming approaches used today (Cambridge Systematics & HDR, Inc. 2007; Maggiore and Ford, 2015). Barriers to cross-asset resource allocation and optimization approaches are summarized in the NCHRP Report 806: Guide to Cross Asset Resource Allocation and the Impact on Transportation System Performance (2015). The nature and type of barriers vary across states, but, for most agencies the challenges can be summarized as follows: (1) Weak strategic direction where system level goals do not establish relative priorities between goals and objectives; (2) Tools and data, while significantly improved for asset management and safety goal areas, the abilities to forecast system performance improvement remains limited and lacks robustness; (3) Institutional constraints are present with states basing asset allocations on past precedent, and antiquated laws and policies that leave deeply entrenched program structures in place and directly limit flexibility; (4) Organizational considerations are a factor for several states operating more at a district level, where their highly decentralized structure has influence on the DOT s ability to make changes to allocation processes; (5) Public/stakeholder entrenchment is relevant mostly for stakeholders, which have grown accustomed to existing allocation processes and learned to work within them, which make those involved in these processes more resistant or threatened by a new process that is seen as highly technical and more difficult to influence; 39
54 (6) Political resistance from efforts to increase analytics and modeling in project evaluation threatens the political side of decision making, and new resource allocation approaches need to be conscious to political realities (Maggiore & Ford, 2015). Moving forward, states are faced with significant hurdles in linking planning and programming processes. However, many of them have overcome these barriers. Those states that are further along in performance-based decision making offer potential lessons for other agencies interested in or beginning to experiment with newer approaches. NCHRP Report 806: Guide to Cross Asset Resource Allocation and the Impact on Transportation System Performance (2015), separates out states in terms of their practices. (1) Legacy driven states are those that approach resource allocation by their existing program structures and the shares or amounts of funding that have historically gone to each program. Changes that are made in funding are generally at the margins to adjust for inflation or growing priorities. (2) Fix it first states have allocations that are based on their current asset management systems and their calculated preservation needs. Many of these states face financial constraints that leave little funding for other purposes, and the remaining allocations tend to be reflective of desired projects versus those that best align with strategic goal areas. (3) Soft optimization states use approaches where allocations are adjusted to be more reflective of their relative priorities, but decisions are driven mostly professionally by DOT leadership, or through non-technical inputs. 40
55 (4) Performance-based states use practices for cross-asset allocations, as reflected by performance measurement tools that are integrated with resource allocations. Decisions tend to be mostly data-driven through models and tools that are used to forecast outcomes across agency goal areas. Allocation decisions still require professional judgments over the appropriate balance of tradeoffs (Maggiore & Ford, 2015). NCHRP Report 806: Guide to Cross Asset Resource Allocation and the Impact on Transportation System Performance (2015) recommends five steps in linking planning and programming processes together, as shown in Figure 5 below. In the first step goals and objectives identification states have used the identification of goals and objectives in their LRTPs to guide their planning. Aligning these goals and objectives to the programming process, involves the use of SMART criteria. Progress towards goals is based on measurable and defined objectives. Use of these objectives as criteria in project evaluation allows for states to predict and monitor progress at the project-level to ensure their progressing towards agency goal areas. Many states have implemented, or are examining ways to implement, performance metric evaluation. States are required through MAP-21 to perform a similar exercise for national-based target areas. Evaluating investment impacts of different projects, Project Impact Assessment, lacks consistency and use prior to the development of the STIP. However, through use of a decision-science application-based framework the comparing and ranking of different project priorities can occur. 41
 3.2.2 Decision Science Applications and Trade-off Analysis Decision science applications encompasses the use of analysis tools to make sound decisions.")
56 Figure 5 Cross-asset resource allocation framework (Maggiore & Ford, 2015) Decision Science Applications and Trade-off Analysis Decision science applications encompasses the use of analysis tools to make sound decisions. Decision analysis tools help transportation agencies identify and define problems, identify appropriate courses of action, quantify the impacts, addresses the uncertainties, and helps manage the expectations (Amekudzi & Meyer, 2005). The use of decision science applications is a substantial part of an objective-based planning and programming process linkage, where expert judgments become crucial to the creation of new optimization investment approaches (Maggiore & Ford, 2015). A scan of the literature confirms that multi-objective decision analysis (MODA) is both recommended and most cited as being used to adopt cross-asset resource allocation approaches. Based on this assessment, this decision science application is examined in the greatest detail. MODA consists of using multiple criteria derived from objective areas, with expert judgment focusing on fine-tuning the process, rather than the project decisions. Agency use of criteria is applied to guide project selection through a process of weighting, scaling, scoring, prioritization, and optimizing allocations (Maggiore & Ford, 2015). 42
57 MODA is a Multi-Criteria Decision Analysis (MCDA) technique that provides for the ability to quantitatively evaluate tradeoffs where competing objectives are prevalent. It is different from multi-attribute decision analysis (Hwang and Yoon, 1981). MAP-21, through the rulemakings process, led to several targets being established for states to measure their achievement of performance towards national goal areas that can be in conflict (Justia Regulations, 2017). System condition performance measures, for instance, have a competing set of objectives compared to providing system reliability though targeted mobility investments. Reliability measures focus on reducing bottleneck conditions that increase person travel delay, whereas system condition measures focus on maintaining existing road and bridge assets. More broadly, the transportation environment is one characterized by a diverse set of competing, and often conflicting set of policy-based goals and objectives in meeting the needs for accessibility, mobility, and economic development, while addressing environmental constraints (Sinha and Labi, 2007). Thus, an objective-based approach that evaluates projects through multi-objective sets of criteria is useful in complex decision-making processes that involve tradeoffs. In using an objective-based approach there are several factors that may need to be addressed, including: (1) instilling greater process accountability on the use of agency resources, (2) providing for flexibility through removing barriers on funding to consider a wider range of tradeoffs and program choices, and (3) valuing multijurisdictional and multimodal planning and coordination in the decision-making process in addressing statewide and regional transportation challenges (Sinha and Labi, 2007). Systems engineering and management approaches are relevant and transferable to the transportation performance measurement context on ways to create objectively-driven 43
58 quantitative approaches for evaluating projects in terms of their performance impacts. Estimating future performance impacts at a project-level basis provides far more enriched understanding of predicted changes in performance than at a system-wide performance evaluation level where such comparisons are either diluted in magnitude, longer-term to gain adequate feedback, or understanding of project level impacts are entirely lost because of a lack of clear and consistent use of evaluation methods. Agencies that have developed quantitative practices in a value modeling capacity most cited using MODA techniques that incorporate a weighting process to develop project priority lists, as the survey results point to, as discussed further in CHAPTER 4. This practice uses a decision science application framework, where fundamental objectives are derived from agency and stakeholder reflections of what achievements are sought through revamping project evaluation approaches (Parnell et al., 2007) Operational Objectives Leading to Performance-Based Evaluation Approaches Specific, measurable, accurate, relevant, and time bound (SMART) criteria referred to earlier in this chapter are important to the use and creation of objective criteria to guide decision making as they provide a clear sense for the desired agency direction. In the terminology of rating techniques in Multi-Criteria Decision Analysis (MCDA) there is another abbreviation for SMART, which in this research will be noted as SMART 2. The Simple Multi-Attribute Rating Technique (SMART 2 ) is based on a linear additive model, where the value of a project alternative is calculated as a total sum of the score, performance value, and weight of each criterion (Olson 1996; Barfod & Leleur, 2014). The total value of a project alternative is thought of as similar to a cost-benefit analysis (CBA) ratio, but it provides for more information to the decision maker by including factors that 44
59 CBA cannot fully monetize and capture. CBA does not allow for tradeoffs to be considered, which is important to agencies when they begin to value certain objectives over others as more valuable to their decisions. Below the main stages of analysis using SMART 2 are discussed in detail (Olson 1996; Barfod & Leleur, 2014). >Step 1: identify the decision maker(s) is one that agencies know well, but over time the actors in transportation decision-making have grown. The FAST Act placed more of an emphasis on engaging freight stakeholders, and direct involvement of business and environmental interests may extend to certain states, as well. >Step 2: discuss the purposes of the decision, and define the multiple objectives used in this decision analysis framework as derived from some of the more fundamental purposes of the agency in terms of its mission and goals. >Step 3: select the criteria that capture the value of project alternatives, based on the stated objectives in the decision-making process. While 12 evaluation criteria are likely too many, seven is sufficient. If the weights of criterion are likely to be so low, as to be insignificant, then other criteria may be more appropriate to inform project evaluation. >Step 4: weight the criteria to assign the value and relative importance of certain objective areas. The weighting involves deliberation in identifying the relative ranking of objectives and sub-objectives valued towards project evaluation decision-making. The weighting of criteria should reflect the importance of the priorities of the agency, but this weighting should be approached in a cautionary way to address the element of bias. 45
60 >Step 4: calculate value using the weighting scheme with the normalization of all of the weights to sum to 1. >Step 4: rank priorities based on their total calculated value, project benefit, versus a unit of effectiveness, typically the projected cost of a project to the DOT. >Step 5: perform sensitivity analysis to see if certain weights were modified, how certain projects may perform substantially better or worse. Through the above process of evaluation, candidate projects are comparable against one another by their levels of effectiveness, in using an efficiency measure of minimized cost or some other factor that calculates the relative level of importance of a project based upon the achievement of multiple objectives at minimized costs. Weights assign relative importance to evaluation measures. These weights define the importance of different objectives, in, for instance, assigning delay reduction a higher weight than minimizing environmental impact indicates that reducing delay is considered more important than environmental impact; this process is commonly referred to as swing weighting. The estimated future performance of a candidate project is the score. Use of a quantitative value model defines the multi-objective decision analysis approach in using the function weights of different objective criteria areas to evaluate candidate projects. Global weights are used to adjust for each objective criterion measure to ensure they sum to 1. Local weights are developed according to the value equation to be able to evaluate candidate projects through an adjusted score (Barfod & Leleur, 2014; Parnell et al., 2007). Figure 6 presents an example of the stages of a MODA project evaluation approach. The figure is generalized from the draft version of the California Department of Transportation s Project 46
61 Prioritization Framework for their State Highway Operation and Protection Program (SHOPP) (Caltrans, 2016). The way projects are compared against one another in their effectiveness under this approach is comparing the ratio of weighted scores and state/federal funding portion, which represents a project s value to cost ratio. With limited resources, an agency would ideally use this approach to prioritize those projects with the higher effectiveness scores to ensure linkages between the decision-analysis techniques (reflective of an agency s goals) and the final programming decisions. The figure below illustrates how project effectiveness can be computed. The PPPPPPPPPPPPPP EEEEEEEEEEEEEEEEEEEEEEEEEE SSSSSSSSSS is based on two basic evaluation calculations. Equation 1 below describes the weighting process of different evaluative measures, criteria that are used to compute a project s value. Individual projects scores are calculated in relation to how well they accomplish each evaluative measure. The sum of the weighting and scoring: [(WWWWWWWWhtt 1 ) (SSSSSSSSSS 1 )] + [(WWWWWWWWhtt 2 ) (SSSSSSSSSS 2 )] + + [(WWWWWWWWhtt nn ) (SSSSSSSSSS nn )], is the calculated value of a project. This value is used in equation number (2) to calculate a value-to-cost score. PPPPPPPPPPPPPP VVVVVVVVVV = [(WWWWWWWWhtt 1 ) (SSSSSSSSSS 1 )] + [(WWWWWWWWhtt 2 ) (SSSSSSSSSS 2 )] + (1) + [(WWWWWWWWhtt nn ) (SSSSSSSSSS nn )] The calculated value in equation number (1), PPPPPPPPPPPPPP VVVVVVVVVV, is used in equation number (2) to calculate a value-to-cost score, PPPPPPPPPPPPPP EEEEEEEEEEEEEEEEEEEEEEEEEE SSSSSSSSSS, based on the cost commitments of Federal and State funding shares, so that a State DOT can seek a maximum benefit to the dollars that they have to accelerate projects through the programming stage. 47

62 PPPPPPPPPPPPPP EEEEEEEEEEEEEEEEEEEEEEEEEE SSSSSSSSSS = PPPPPPPPPPPPPP VVVVVVVVVV PPPPPPPPPPPPPP CCCCCCCC (2) Figure 6 Framework for an Objectives-Based Hierarchy using MODA Ensuring Decision Quality The development of project evaluation methods using MODA is a significant step for agencies, but the quality of the decision-making process in producing intended outcomes rests upon several key elements identified and shown in Figure 7. The figure was developed using the decision quality framework developed by Parnell, Driscoll, and Henderson (2007) based on their six stated elements of decision quality, which is considered in the context of project evaluation and selection. The use of a MODA approach under a simple multi-attribute rating technique, alone, does not lead to intended agency outcomes. However, the reflection of improved decision quality in a MODA approach is what promotes agency strategic alignment. When the decision making-process reflects meaningful and reliable information, clear values and tradeoffs, sound reasoning, stakeholder commitment, and an appropriate frame for decisions. Decisions reflect desired outcomes when the process lends itself to achieving wider agency purposes through the use of the six factors, as illustrated by Figure 7 below. Achieving strategic goals and 48

63 aligning decision-making processes with stated objectives is based upon the robustness and extent of use of the decision science application. A project evaluation process that emphasizes efficiency and effectiveness optimizes resource allocations, while capturing the complexity of transportation decisions in the process. The six elements of decision quality can be tied to any decision science application-based framework, including MODA, where agencies are seeking to achieve optimal use of resources through quantifying project alternative tradeoffs in prioritization and allocation decisions. Figure 7 Elements of Project Evaluation Decision Quality (Adapted from Parnell et al., 2007, pg. 247) 49
64 CHAPTER 4. STATE TRANSPORTATION PROCESS EVALUATION The use of a survey is used to inform thesis findings. In early February of 2017 an ed Survey Monkey link was sent to targeted points-of-contact in all 50 state transportation agencies for them or other agency heads to fill out the survey based on their knowledge of their state s planning and programming processes. State agency recipients were invited to participate on a voluntary basis until the survey closed in mid- April. The survey was used in this research to gauge current practices in multimodal performance-based project evaluation and inform the selection of case studies of state agency practices, which evidence a multimodal and or performance-based project evaluation focuses. The survey was developed to understand current practices, challenges, and levels of interest and opportunities to inform new sets of measurement criteria and evaluation strategies on a project-level basis. The survey was constructed as to further a national understanding of the extent of state-based performance measurement linkages to project evaluation, in light of recent MAP-21 performance-based rulemakings. On programming, the survey questions were meant to examine the extent of geographic, funding, and modal challenges across agencies in evaluation approaches, and whether particular state processes come to light as useful in addressing them. The extent of interest in project evaluation approaches that reflect agency-aligned goal areas with multi-objective decision analysis (MODA) criteria was examined. In addition, the national survey results would lead to the development of state-based practice assessments in this research, 50
65 particularly in multimodal performance-based planning and programming approaches, while recommending suitable evaluation-based strategies that come to light from the survey and agency-based practices assessment. The survey questions that were used are presented in APPENDIX A. 4.1 Focus of the Survey The survey broadly covers State DOTs planning and programming approaches to major capital expansions (asset management-based) and capital planning for the construction of new transportation facilities. While certain literature includes asset management approaches with future capital planning, agencies have struggled to use asset management systems that focus on maintenance management to effectively prioritize the selection of adding new assets that fits with the strategic goals of an agency. Asset management systems are mainly preservation-focused. Capital planning should encompass significantly more considerations than what asset management systems currently measure. Figure 8 illustrates the survey partly fits into the wider asset management based approaches that agencies use, but mainly examines the extent that quantitative tools and multi-criteria analysis techniques are used to prioritize major capital projects, in addition to exploring the challenges that exist for each agency. The survey also examines the range of outcome-based criteria areas that extend beyond the traditional tools used in project evaluation. 51


66 Figure 8 Conceptual understanding of survey focus The agency respondents that participated in this survey were targeted, and provided the survey through correspondence. Those selected to respond were though to possess knowledge on the capital planning process or directly oversaw the process. The survey asked questions that dealt with different modal or programmatic divisions, where survey respondents would need to possess a high-level perspective and understanding of agency processes. Using the targeted list of agency staff, an was sent out in early February, asking the recipient or another member of the agency to fill out a Survey Monkey link over a 6-week period. The survey was expected to take 20- minutes of their time, and an edit function was included to allow survey respondents to change their answers over the course of the link being open. Those that responded to the survey were given the survey results in April. No other additional follow-up was made, expect for those states that had certain practices profiled in further depth. In Table 4 below, a sample of the state transportation agency respondent position titles is included. Many of the agency respondents have overseeing roles in policy, capital planning and programming, or director or program manager roles in more agency-wide positions. 52
67 Table 4 Survey Respondent Position Titles at State Transportation Agencies Administrator Infrastructure Investment Director Administrator, Statewide Planning and Policy Analysis Intermodal Policy Director Assistant Director, Planning & Development Performance and Asset Management Branch Manager Assistant Manager of Planning and Programming Planning Policy Manager Bureau Chief of Programming Planning Section Manager Chief Engineer Policy, Planning and Research Director Deputy Secretary Program Manager Capital Improvement Programs Director of Capital Programs Statewide Planning Bureau Chief Director of Project and Planning Development STIP Manager Director, Planning, Programming, and Modal Division State Planning Engineer Division Director Programming Division Transportation Planning Director Deputy Executive Director Transportation System Management Director In total, 35 states participated, comprising a 70 percent response rate from state DOTs participating. All regions of the country, as well as small, large, rural, and urban states, were representative in this research and the survey results. In Figure 9, states participating are shaded. The survey was open for a month-and-a-half, between early February and Mid-March of States had the opportunity to submit multiple responses, but only one completed response for each agency was used in the final analysis. In the case of multiple responses submitted, only the response from the respondent with the higher position title was kept. Incomplete responses were deleted from the final survey results. State respondents were asked a series of questions to gather broad information about their use of funding, flexibility with their use of Federal funds, the challenges their states faced and how they are addressed, and whether there are strategic approaches their state uses to address or overcome particular challenges. In survey questions used are in APPENDIX A. 53
 4.2 Survey Findings States hold broad responsibilities over a significant portion of transportation asset classes in programming funding.")
68 Complete Response No Response / Incomplete Figure 9 Survey Participation (35 State DOTs*) *State transportation agencies are referred to in this analysis as DOTs, although some go by other agency names (e.g. department of highways and roads) 4.2 Survey Findings States hold broad responsibilities over a significant portion of transportation asset classes in programming funding. Road and highway, transit, bicycle, pedestrian, and freight projects are part of nearly every state transportation agency s project list. A smaller portion of states, but still a sizable percentage, program other modes, including ferries, ports, rail, airports, and TDM projects, shown in Figure 10 below. Rail was not an answer choice in the survey, but many states referred to their state-supported rail programs or rail freight investments. No question was asked about funding commitments towards the various modes programmed into the STIP, given these amounts can greatly vary by the year. There is also wide variability in commitments at various levels of authority, 54

69 including: states, MPOs, and other transportation agencies that hold responsibilities over funding the various modes, which make direct comparisons between states difficult. Some of the nuances with how states program various modes appear in later questions, where several states mention they allocate funding directly to regions and localities to program projects. For example, some states direct all Surface Transportation Block Grant (STBG) funds (formerly Surface Transportation Planning (STP) funds) to be used solely at the local and regional level to address transportation priorities (see Figure 14). Figure 10 State responses on their STIP/Capital Improvement Programs encompassing the following modes State DOT Evaluation Methods States use various approaches to evaluate projects before they are programmed into the State Transportation Improvement Program. Some states use a number of evaluation methods. Based on an NCHRP project conducted by Gunsakera and Hirschman (2014) state methods used to evaluate projects mainly fall under four types of methods: 55
70 (1) Benefit-cost analysis is a traditional procedure of evaluating the monetary costs of projects against the benefits. (2) Cost-effectiveness analysis, compares the relative costs of a project against the expected outcomes, with the outcomes not necessarily monetarily computed. (3) Outcome-oriented goals or targets is an approach where projects are compared against agency goals or targets in seeing what projects best align. (4) Multi-criteria weighting is where there is the use of multiple non-overlapping criteria to judge a project s effectiveness. A majority of states surveyed mention that they use outcome-oriented goals or targets, with 26 of the 35 states (74%) listing this method as one they use, followed closely by multiple-criteria weighting, used by 25 states (71%), to evaluate projects before they are programmed into the STIP, as shown by Figure 11 below. States that rely on a more quantitative basis for performance evaluation may use several of these methods under one approach. Of the 35 states surveyed, 12 (34%) do not mention methods to quantify investments based on either cost-benefit or cost-effectiveness analysis before projects are listed in the STIP. In 2010, this was presented as a concern from a GAO study that noted only 22 percent of states use economic analysis is of great or very great importance in decisions to include projects in the STIP (GAO, 2010). In this survey, from the 23 states that reported the use of one or both of these methods, they expressed later in the survey a greater interest or use of multi-objective decision analysis criteria of the ones shown than those states without these quantitative practices. These 23 states incorporate demonstrate the use of a broader set of factors to evaluate project effectiveness than states that lack consistent use of BCA and CEA in project evaluation. 56

71 Figure 11 Project Evaluation Methods The findings displayed in Figure 11 above largely reflect the conclusions of the GAO (2010) study titled Statewide Transportation Planning: Opportunities Exist to Transition to Performance-Based Planning and Federal Oversight, which analyzed state transportation agency planning and programming approaches. GAO developed similar conclusions that states use broad goals and objectives in their long-range plans, but few have developed financial constraints in their plans. It remains a less common practice to develop cost estimates for specific projects prior to them being programmed than to consider goals and targets or evaluative criteria (without a cost basis) in evaluating projects. This research found states have improved, measured by the extent that they use BCA and CEA, since the 2010 GAO survey shown in Figure 12 below, in evaluating the costs of projects prior to programming. Due to MAP-21, states are required to link programming and planning. However, cost evaluations at the project-level still remain under-utilized as practices, which may have negative impact on an agency s achievement of performance targets over the long-term. 57
72 Figure 12 Selected Elements State DOTs Reported Including in Their Long-Range Statewide Plans (Source: GAO, 2010) States also widely vary in their examination of projects. To better understand how capital improvement projects are evaluated within an agency; a question was asked about how states program capital improvements on a National Highway System (NHS) facility. State DOTs either program these projects within a department or division, for instance Operations, or across multiple divisions, for instance the involvement of Operations and also Capital Planning. States may also fund projects only within one funding program (e.g. STBG.), or mix and match these different funding sources (e.g. NHPP and CMAQ funds being used together). The largest number of states, 12 (34%), indicated that they typically evaluate projects across different agency divisions and across multiple funding programs, as shown in Figure 13. Agencies were not asked in this question whether they evaluate projects across travel modes, and different modal divisions within the agency, given this is a practice states have struggled to advance. 58

73 Open-ended responses pointed out that states still struggle with funding across modal areas and modal divisions. The vast majority of states lack a way to consistently evaluate different projects across travel modes under one evaluation process. Later questions in this survey addressed the modal challenges piece that agencies face, and to see how they can better be addressed. Part of the challenge agencies face with having modal divisions for highway, transit or rail, is that they can develop the tendency to deal with these investments in silos (Maggiore & Ford, 2015; Cambridge Systematics & HDR, Inc. 2007). As well, an even larger challenge for several agencies is that they have modal separation in divisions, and limited program allocations to fund non-road/bridge projects (Gunsakera & Hirschman, 2014). Figure 13 State Assessment of Projects Within/Across Divisions and Funding Among the most flexible Federal funding programs that allow for states to invest in projects across travel modes is the Surface Transportation Block Grant (STBG). One question in this survey was asked to see if states take advantage of this flexibility, and 59
74 program projects across different travel modes. Based on the survey responses, shown in Figure 14, several agencies take advantage of the flexibilities with STBG funds to invest in non-highway modes. Traditional road projects are the major use of STBG funds, but more creativity in use of funds is displayed by several agencies. Some states make use of this funding for broad uses, including: intermodal, TDM, and transit improvement projects. STBG apportionments were mentioned by one state in their open-ended response to go entirely to local jurisdictions and regional transportation bodies, most commonly metropolitan planning organizations (MPOs), for them to decide on how to make use of these funds. For states that do not direct all of their STBG funds to local and regional bodies, there is opportunity for states to better take advantage of the funding flexibility that the STBG program provides to support more intermodal and TDM projects. Figure 14 Number of Agencies Responding that use Surface Transportation Block Grants (STBG) Beyond Road and Bridge Projects (n=30) 60
75 Prior to this survey, earlier research indicated that states primarily assess the asset condition and the use of road and bridge assets in order to prioritize and program most projects into the STIP (Gunsakera & Hirschman, 2014; GAO, 2010). Asset management and preservation-based focuses dominate the bulk of the programming for many states. However, the survey focuses more on the major capital improvement side to make note of metric categories that inform prioritization of what are often the larger, strategic priorities on the STIP in enhancing mobility or adding connections. Several states pointed out in this survey that they prioritize maintenance projects using entirely different sets of assessment criteria than they do for major capital improvements. Asset condition and use serves as a basis for most projects being prioritized at least initially, and some states may only use asset condition and its use as their dominant way of developing statewide maintenance priorities. However, mobility-driven investments should factor in a broad set of criterion, used to examine which ones align with an agency s strategic goals and objectives. Given the importance of addressing all seven national performance goals, asset condition and use would leave out addressing many of these goal areas. Based on whether each state assesses projects across funding programs or within particular funding programs, two to three survey questions followed. For states that specified prioritizing projects within particular funding programs, a question was asked on each state s largest federal funding source, the National Highway Performance Program (FHWA, 2016c), to gain a sense of current metrics that inform the prioritization of major capital projects. For states that evaluate across different funding programs, the purpose is 61
76 to get an understanding of the metric areas most commonly used to evaluate major capital projects outside of asset condition categories. One limitation of this question is the inability to evaluate the overall quality of metrics used to assess projects before they are programmed into the STIP, and also there are several funding programs targeted towards one objective area (i.e. safety for the Highway Safety Improvement Program and air quality for the Congestion Mitigation and Air Quality program), which complicate the picture of what metrics may be consistently or partially used. Figure 15 and Figure 16 below point to the extent of use of certain evaluative practices. Further case study evaluation of existing practices will help to inform what kinds of indicators are most useful within each of these measure areas in performance evaluation processes. For states that evaluate projects within capital programs, safety and support of plans (13 and 12 out of the 16 states, respectively) are the two most common factors used by states in evaluating non-maintenance-based National Highway Performance Program (NHPP) projects. Typical congestion indicators is a third driver, with multi-modal congestion indicators far less used as a practice, as shown in Figure 15. Greater use of accessibility (changes in access to destination types), cost-effectiveness, and economic development impact measures may assist State DOTs in creating more outcome-based evaluation criteria to prioritize major capital projects. Most states also reported some similarities in metrics used for the National Highway Performance Program (NHPP) compared to other large sources of funds. 62
77 Figure 15 Factors Considered in Project Evaluation within Programs for NHPP For states that fund across different funding programs, the factors asked about have a greater overall use. This is in part because funds that go beyond the National Highway Performance Program restrictions can support a wider possible set of transportation investments. States are examining safety, economic development impact, and coordination with existing plans as the most common areas of project evaluation for capital investments as shown in Figure 16. Some metric categories are far less explored, particularly accessibility, cost-effectiveness, land use, and multimodal congestion metrics. In these results three clusters of practices form. Highly used evaluation practices include: safety, support of plans, economic development impact, and vehicle congestion-based metrics. Mostly used practices include: cost-effectiveness, emissions or travel change, and 63
78 accessibility. Evolving practices are in evaluating land use and using multi-modal congestion-based criteria in evaluating projects. Figure 16 Factors Considered in Project Evaluation Across Programs State DOT Programming and Project Evaluation Challenges Previous research has noted that states struggle to become multimodal in their programming in part because of the challenge in funding certain types of projects (Gunsakera & Hirschman, 2014). To confirm whether this is a problem, states were asked to categorically rank their difficulties in funding different types of projects across different travel modes. A score of 1 would indicate an investment their state finds easiest to fund and a score of 7 indicates a travel mode that their individual state finds most difficult to 64
, as shown by Figure 17.")
79 address. States are most challenged by being able to fund intermodal and multimodal facilities and connections (5.63 and 5.20, respectively, are their average rankings out of 7), as shown by Figure 17. For the other project categories, states widely expressed various levels of difficulty in funding transit, bicycle and pedestrian projects, TDM projects, and roads off of National Highway System (NHS) facilities. Figure 17 Projects by difficulty to fund: average values of rank ordering Increased Federal funding flexibility for non-highway projects is one step in making it easier for states to support certain investments. Part of the challenge, as indicated by open-ended responses, lies in statutory or constitutional restrictions that many states have whereby gas tax dollars and other transportation funds can only support road or bridge projects. As well, providing greater program funding eligibility at the Federal level for roads off of the National Highway System (NHS) system may help address many of the challenges faced by states in repairing non-nhs bridge and road assets that often provide critical internal connections in states. The state challenges as pointed out by this survey 65
80 question points to the need for there to be more attention at the Federal level in address programmatic restrictions. Programmatic restrictions in funding make it difficult for states to pursue multimodal and intermodal projects, and even some of the more routine types of projects off of national highway system facilities. This is evidenced by the results shown in Figure 17, where non-nhs facilities were indicated by multiple states as being a greater challenge to fund. States also need to adopt certain institutional reforms to become more multimodal agencies (Cambridge Systematics & HDR, Inc. 2007; Maggiore and Ford, 2015), as described by the barriers discussed in CHAPTER 3. States were also asked to identify how well they are able to address multimodal planning through funding, in addition to two other broad challenges, geographic and programmatic in nature, and to see if practices could be identified that have helped individual states address these common problems better than others. The three challenges referred to are: (1) pursuing geographic spread in funding projects, (2) comparing project alternatives across different funding programs, and (3) states abilities to fund through cross-modal investment prioritization, in a way that viewed each modal travel alternative equally (mode-neutral funding). State transportation agency respondents indicate that their project evaluation process is more capable of funding projects with fairness to urban, suburban, and rural communities. Fifteen of the 35 (43%) states mention they succeed in using their approaches to accomplish this goal. Overall, most states believe they somewhat address this challenge through project evaluation procedures. Fewer agencies believe their project evaluation methods are able to compare project alternatives across various funding programs, and the vast majority of DOTs surveyed believe their agency s project assessment procedures do 66
81 not address funding in a mode-neutral capacity. Funding across different modes continues to be an enormous challenge faced by states, as survey results indicate. Only one agency respondent indicates that their project evaluation procedures fully addresses funding in a mode-neutral manner, as shown in Figure 18 below. The agency responses in this question are not fully indicative of how well states are addressing the below challenges, but rather their account of the difficulty in addressing these challenges is a basis for selecting practices for further review, and which can offer case study examples. Certain states were more honest in their responses, while others indicated they addressed these challenges better than their practices reflected. Figure 18 Challenges in Distributing Funds by Area, Program, and Mode in Project Evaluation Procedures When it comes to the distribution of funding, most state DOTs are the primary agency to develop and prioritize project lists, outside of the development of MPO Transportation Improvement Programs (TIPs) (McCoy et al., 2016; FHWA, 2016). The vast majority of states develop their project list through a mainly state-driven process, as shown by Figure 19 below. Of the 35 states participating in the survey, 22 states (63%) 67
, the states mention having a more locally-driven or predominately locally-driven process to identify project list priorities for the Statewide Transportation Improvement")
82 specify that project list priorities are produced mainly at the state level and five (14%) identify project list priorities all at the state level. Of the remaining eight (23%), the states mention having a more locally-driven or predominately locally-driven process to identify project list priorities for the Statewide Transportation Improvement Program (STIP). Figure 19 Development of Project List Priorities outside the inclusion of MPO Transportation Improvement Programs (TIPs) n=35 One of the questions facing states is how best to balance the identification of priorities geographically to be fair to different jurisdictions across the rural, small town, suburban, and urban parts of the state. Another larger question is whether state project list priorities should be identified at the local-level, or whether the state be in the more dominant position of selecting what the greatest needs are across a state. Given the use of more state-driven practices to project development, there is a higher onus on these states to identify project list priorities that align with performance-based target areas identified by the MAP-21 rulemakings. For states that have a more locally-driven approach to 68
83 identifying project lists, they must increasingly collaborate with localities and partner with them to identify priorities that better align with national performance measure target areas and their state-based strategic goals and objectives Furthering Federal Reforms and Coordination The survey also offered a unique opportunity to ask of states about new emphases from recent federal legislation. For the first time in surface transportation legislation, the FAST Act establishes two sources of funding for freight projects. These funding sources provide intermodal support, but limits funding to no more than 10-percent of funds going towards non-highway freight projects. States were asked whether broader flexibility should be adopted to allow states to spend over this ten-percent cap to address more of their intermodal needs. Survey responses indicate that the vast majority of state transportation departments surveyed that take a position on this issue are more supportive of increased flexibility for both the National Highway Freight Program (NHFP) and FASTLANE Grant Program, now called the INFRA Grant Program. Those states favor removing the 10-percent cap to be able to better support non-highway freight projects in their state. As well, fifteen states, selected that they are unsure, and may want to understand the effects more fully, as shown in Figure 20 below. The ability for certain states to compete for FASTLANE/INFRA grants may be of concern. A greater cost-effectiveness component to FASTLANE/INFRA grant allocation decisions may help mitigate this concern by giving more states a better ability to compete by having cost-effectiveness criteria that funds more high-benefit projects when accounting for their low relative costs. Under USDOT 69

84 Secretary Chao, the grant program was reconfigured in 2017 as INFRA; it keeps the overall focus of supporting projects that promote national or regional mobility, safety, and economic benefits, but adds more emphasis on expedited project delivery and greater leveraging of other sources, including loans and grants. To address the concerns over a lack of private investment to support small projects or rural projects, set-asides are provided for small and rural projects (Government Publishing Office, 2017). There is attention to national goals in USDOT committing to projects, however the added end goal of creating more infrastructure investment through private-sector support should also align with national goals focused on higher performance. Additionally, the project should demonstrate clear benefits to the public, for USDOT to offer financial support. Figure 20 Opinion on expanded funding eligibilities for NHFP and FASTLANE 70
85 MAP-21 and the FAST Act aimed to further a collaborative process for decisionmaking, particularly in identifying freight needs and identifying key stakeholders. State transportation agencies overall consider freight interests widely in their strategic approaches to performance and prioritization in funding, shown in Table 5 below. Second to rural interests, the freight industry is the second most-cited outside stakeholder interest involved in key decision-making processes at state transportation agencies participating in the survey. Elected officials, members of the state legislature and the state governor also show significant involvement in most states, in regard to prioritization approaches to funding or shaping performance goals. Municipal and county association or leagues, also play a role in a significant number of states. State transportation agencies have far less engagement with several key interests, which may want to be better engaged in these processes, including the (1) business community (through chambers of commerce), (2) health interests, and (3) environmental divisions. Of the other interests specified, one state mentioned their ability to engage a diverse statewide stakeholder committee around identifying key safety improvement projects, which is a valuable practice for prioritizing projects that demonstrate substantial safety improvement, or further emphasize safety as a significant factor in the project evaluation stage. Broader stakeholder involvement can also help to balance competing interests, and ensure that transportation projects are evaluated through multiple perspectives, and also to have cost-evaluation and economic analysis of projects serve as strong components of evaluation. According to GAO (2010) analysis, all 50 state DOTs reported that the availability of federal and state funds is reported as great or very great importance in decisions to include projects in the STIP. The vast majority (98%) also indicated that the 71
 put the transportation funding priorities established by the governor as having great or very great importance, followed by 32 DOTs (64%) for having public support for")
86 availability of state or local funds to match Federal funds was also of great or very great importance. Political factors were also reported as highly significant. Thirty-five state DOTs (70%) put the transportation funding priorities established by the governor as having great or very great importance, followed by 32 DOTs (64%) for having public support for specific projects and 30 DOTs for having political support for specific projects, but only 11 DOTs (22%) reported economic analysis of projects were or great or very great importance in decisions to include projects in the STIP. Earlier parts of the survey have indicated state DOTs have moved more towards economic analysis, but political support remains a significant factor in states including projects in the STIP (GAO, 2010). Table 5 Involvement of outside stakeholders in project evaluation/prioritization Have any of the following actors provided representation in acting in an advisory role or in a direct role in shaping performance goals or the prioritization approaches to funding? (n=35) ANSWER OPTIONS RESPONSE PERCENT RURAL INTERESTS 60.0% FREIGHT INDUSTRY 57.1% MEMBER(S) OF THE STATE LEGISLATURE 54.3% MUNICIPAL ASSOCIATION/LEAGUE OR ASSOCIATION OF COUNTIES 51.4% STATE GOVERNOR 48.6% COMMUNITY AFFAIRS/ PLANNING / ECONOMIC DEVELOPMENT/ HOUSING AGENCY 45.7% OTHER ELECTED OFFICIALS 34.3% AIR QUALITY DEPARTMENT / AN AIR QUALITY EXPERT 31.4% LOCAL/REGIONAL CHAMBERS OF COMMERCE 28.6% PRIVATE CITIZEN APPOINTEES 28.6% REPRESENTATIVE FROM THE ENVIRONMENTAL DEPARTMENT/ ORGANIZATION 28.6% REPRESENTATIVE FROM THE HEALTH DEPARTMENT OR A HEALTH PROFESSIONAL 25.7% STATE CHAMBER OF COMMERCE 14.3% NONE OF THE ABOVE APPLY 8.6% OTHER (PLEASE SPECIFY) 31.4% 72
87 States will need to establish linkages between their planning and programming of projects for all future plans and programs starting May 27 of 2018 ( of the NPRM on Statewide and Nonmetropolitan Transportation Planning). The advisory roles of outside stakeholders may grow as state transportation agencies examine ways to develop connections between their strategic goals and transportation project priorities. Based on survey results, State DOTs are mostly in the exploratory phase in establishing linkages in planning and programing. Over the near-term states will need to move forward in including (to the maximum extent feasible) a description of the anticipated effect of their STIP towards achieving the performance targets in the long-range statewide transportation plan. State DOTs also need to link investment priorities in the STIP to the achievement of performance targets in their plans ( (q), (d) of the NPRM on Statewide and Nonmetropolitan Transportation Planning) (FHWA, 2016b). Many are in a transition stage, and are advancing their practices to conform to Federal requirements, given the final rulemaking is fairly recent. Close-to-half of all states (43%), at the time of this survey, remain in the exploratory stage in establishing these linkages. With the recently finalized rulemakings, 22 of the 35 state DOTs mention at this time that these FHWA rulemakings have not impacted their selection of projects for the STIP, as shown in Figure 21. Six state DOTs selected that these rulemakings have had impact at this point, another two DOTs mention some impact, one DOT said it will on the next STIP, two DOTs mentioned their states already are prioritizing or using their own performance-based approaches before the rulemakings were implemented, and one DOT respondent commented that the Administration had placed a temporary hold on the rulemakings at the time of the survey. 73

88 Regarding changes to state project evaluation processes, the vast majority of states are in the exploratory stage of reflecting a performance-based process of decision-making in revising their current prioritization and project selection approaches, and or are in the process of linking performance measures to the evaluation of projects and criteria that they use. Around one-third of state DOTs mention that they have linked performance measures and their agency goals and objectives to project evaluation for developing the STIP, as shown in Figure 22. States were allowed to select multiple responses to this question, given many of their approaches are consistently evolving. There is also a greater degree of nuances in whether linkages are present for all or some of the STIP projects, and the differences in performance criteria assessments by project type. Figure 21 Impacts of Federal performance rulemakings on the STIP 74
89 Figure 22 Use and exploration: performance-based and project evaluation-based linkages Given the unique challenges that individual states contend with, several states mentioned their challenges more directly. Several commented about the presence of funding silos and restrictions on their use of funds, both Federal and State, and also difficulty investing in projects that are not road and bridge investments remain a substantial challenge for their agencies to address. Inflexible funding distribution formulas are difficult to contend with in many state-based project selection processes. Some states mentioned some of the issues that come with prioritization, and the difficulties of arriving at funding allocations in a quantitative, transparent, and mode-neutral way. State DOTs also shared a variety of strategies that their agencies have found helpful in practice to address some or all of the three challenges, in meeting the differing needs of urban, suburban, and rural jurisdictions, and in using funding across different project types and different travel modes. Certain themes emerged with the solutions referred to by states 75
90 in addressing the above challenges. Several agencies referred to using new approaches in prioritization, including the adoption of an objective approach, use of multi-objective criteria, and expansion of asset management tools to compare across different project alternatives. Other states recommended strategies emphasize participatory or communitybased process that include: use of input, context-based planning techniques, and regular dialogue with local partners. The case studies of agency practices will refer to more objective and quantitative and qualitative mixed approaches that states have found success in using to evaluate projects Interest in New Approaches for State DOTs States appear to have largely embraced more traditional strategies in evaluating statewide needs. However, interest in new approaches may be increasingly reflected in state DOT s procedures, based on the need to develop more alignment between agency goals and project lists. Changes in interests in performance evaluation approaches that go beyond traditional practices were asked in this research to gauge interest levels in new types of performance target areas, where agencies would like to explore these approaches further. As an early indication for states that are proceeding in a performance-based direction, overall interest was gauged for states using certain factors in evaluation approaches for prioritizing capital improvement projects through MODA criteria. Earlier findings by the GAO (2010) found that for the vast majority of state DOTs using performance measures for transportation planning have great or very great challenges for using qualitative measures, like livability (82% of state DOTs), and also in collecting data to track multimodal performance (58% of state DOTs), and being able to 76
91 link funding decisions to performance information (38% of state DOTs expressed that sentiment), as shown in Figure 23. States face similar challenges today, with many expressing interest in using measures that emphasize livability or multimodal performance, but far fewer state DOT approaches in existence that involve using these factors in prioritization criteria. Figure 23 Great or Very Great Challenges to Using Performance Measures for Transportation Planning as reported by State DOTs (Source: GAO, 2010) States are particularly interested in evaluating the cost-effectiveness, economic development, safety, health, equity, and intermodal and multimodal connectivity impacts of different transportation projects. As shown in Figure 24 below, the darker shades represent current use or greater interest in certain evaluation approach areas. Some of 77

92 these areas are based on recent Federal rulemakings, and others on recently adopted project-level evaluation criteria employed by State Departments of Transportation, which significantly extend beyond the target areas and performance criteria developed through the recent Federal rulemakings on transportation performance measurement. Survey responses indicate that the greatest interest across State DOTs to adopt new evaluation categories is specific to seven areas: cost-effectiveness, economic development, crash data by travel mode, intermodal connections and multimodal accessibility, health, and equity, as shown in Figure 24. No Change in Interest responses are not included in Figure 24. Figure 24 Changes in interest over past 10 years in adopting additional prioritization evaluation criteria for major enhancement/mobility projects The recent Federal Rulemaking on system performance objectives incorporates both person-mile movement based metrics and a GHG measurement component in the final rule, with the GHG emissions measure indefinitely delayed based on the incoming Administration s review under Secretary Chao (Justia Regulations, 2017). Both the GHG 78
93 emissions impact and non-mode specific congestion practice areas, while having less state DOT interest, are among the rest of the criteria areas listed where there is greater agency interest than disinterest among the 35 state DOTs surveyed. State interest in adopting new criteria in evaluating projects is compared against an earlier question on their approaches to project evaluation. Using a crosstabs analysis, responses of states that use either benefit-cost analysis (BCA) and cost-effectiveness analysis (CEA) across their funding programs are compared to states that did not indicate the use of either of these practices. A striking conclusion from this crosstabs analysis is that states using BCA/CEA approaches tend to be significantly more interested in adopting new project evaluation criteria for evaluating transportation projects through a more comprehensive approach. For states reporting having either of these two quantitative evaluation approaches in place, there is significantly more interest (based on the rating average computation explained in Table 6) in adopting criteria to understand project-level impacts on: (1) crashes for different user types [2.26 vs. 0.73], (2) health/active transportation [2.00 vs. 0.45], (3) land use coordination [0.79 vs. 0.18], (4) congestion and mobility for multiple modes [0.61 vs ], and (5) impacts on GHG emissions [0.87 vs ], as shown in Table 6. The rating average computation is a way of summarizing the values into a single number. States that have no interest in a practice would be counted with a -5 score, whereas those currently using a practice count as a +5 score. Those states more interested in a practice receive a +3 score, and those less interested receive a -3 score. The sum of these values for each factor area comprises whether a practice is considered to 79
94 be of further or less interest to most states. To undertake the cross tabs analysis states were separated into two categories: those that use BCA/CEA and those that do not. Table 6 Crosstabs analysis: changes in interest in adopting new metrics and whether BCA or CEA is used in project evaluation prior to STIP development Changes in State DOT Interest Rating Average Computation: (Not Interested = -5; Less Interest = -3; No Change = 0; More Interested = +3; Currently Used = +5) BCA/CEA Methods Used (n = 24) Not Used (n=11). Economic Development Disaggregated Crash Data by Travel Mode Intermodal Connections Multimodal Accessibility Health / Active Transportation Equity (Disadvantaged Populations) Air Quality Statewide VMT Impact Land Use Coordination Non-mode specific congestion or mobility measures (person-mile and ton-mile movement) GHG Emissions Impact Interest in project evaluation approaches that incorporate metrics in the areas pointed to in Table 6, and other survey findings, are used in this research as a means to take approaches currently used by State DOTs and connect them to new Federal focuses of using performance-based measurement tools to guide decision-making, as well as to further the alignment of performance areas with state transportation agency-wide goals and objectives. This survey and further evaluation of individual state performance-based approaches in the next chapters help to showcase examples of multi-objective decision analysis (MODA) prioritization approaches for major capital projects. The case studies that follow in CHAPTER 6 are based on further analysis of agency procedures that fit with a multimodal performance evaluation approach emphasis based on survey responses and further research into individual state practices. The states recognized 80
95 in the next chapter use funding flexibility and performance-based emphases to increase their ability to optimize investment decisions and strategically-align their agency s processes by overcoming geographic, programmatic, and mode-specific barriers. This research also looks to connect and explore further how prioritization of funding for mobility-driven investments can more cohesively align with the growth of importance in state-of-good-repair and maintenance strategies - a major focus of federal reauthorizations dating back to the Intermodal Surface Transportation Efficiency Act (ISTEA) of Recommendations for Federal regulation reforms will be suggested based on the highlighted practices in the next chapter, and ways to improve process efficiencies through removing unnecessary programmatic and funding barriers that are obstacles for states examining ways to develop more of a performance-driven emphasis to transportation decision-making. 81
96 CHAPTER 5. CASE STUDIES Survey findings informed the selection of four case studies of different state Departments of Transportation. The agencies selected use transportation evaluation techniques that demonstrate performance-based or multi-objective emphases and/or intermodal and multimodal focuses. The case studies point to prioritization techniques that evidence a variety of effective practices in project evaluation, where programming decisions are informed by multi-criteria decision analysis methods that connect to strategic goal areas. State prioritization methods that are capable of evaluating transportation projects across different funding programs and modes were particularly examined. For selecting case study examples, state responses were referenced in comparing states by their flexibility in programming, the diversity of evaluation criteria that they use, use of non-traditional criteria, and the degree the respondent indicated their agency practices address geographic fairness, overcoming programmatic barriers, and emphasizing the use of mode-neutral measures. States were then ranked by the effectiveness of their overall approaches were by the survey. Agencies that ended up in the top tier of this ranking then had their approaches validated to ensure they were reflective of the practices that were indicated. Exemplary approaches were identified from each of these agencies, and practices were identified that would not be overlapping and overly repetitive. A diversity of practices was sought, some of which included evidence of: (1) qualitative multi-objective criteria used to prioritize projects, (2) quantitative evaluation criteria that emphasize data-driven decisions, (3) legislative or agency-based reforms, 82
97 (4) objective and outcome-based processes that overcome programmatic barriers, (5) multimodal or intermodal emphases through metrics chosen, and (6) planning and programming linkages clearly referenced in approaches used. From this point, the final selection of four case studies involved more subjective decisions over ensuring that case study examples reflect most of the nation as a whole in terms of their political climates (make-up of their legislature and governor s office) and geographic spread of populations (states dominated by large urban populations and comprised of mostly metropolitan regions were removed from further analysis). The case studies selected offer examples in overcoming barriers in programming to establish more strategic directions for agencies in use of capital funding. In these case studies, a variety of approaches are identified that help to piece together a comprehensive list of recommendations for future practices with both state and national implications. The case study evaluation of Oregon, Maine, Utah, and Virginia is used to inform recommendations presented in CHAPTER 6, in moving towards implementing crossmodal asset prioritization for state DOT capital improvement project types. Oregon DOT uses qualitative selection criteria to prioritize Oregon Enhance projects, those that enhance mobility and are non-maintenance based improvements. Maine uses their Intermodal Rail Access Program to prioritize rail projects that enhance intermodal connections, generate economic development, and lead to reduced highway expenditures in maintenance for Maine DOT, and lessen congestion on roadways. Utah had a series of legislative reforms that led to a capital improvement prioritization process used to enhance mobility. UDOT has also succeeded in using collaborative processes, and a data-driven decision support system to make use of resources in a more efficient manner. 83
98 In Virginia s case their recent legislative reforms have led to the development of a strategic prioritization process used to evaluate all capital improvement transportation projects across travel modes in the State of Virginia. Their prioritization approach emphasizes the use of mode-neutral criteria to effectively fund transportation investments that are in line with the multi-objective areas of their capital improvement prioritization process. 5.1 Oregon DOT s Enhance Program and Qualitative MODA Emphasis In 2012, the Oregon Department of Transportation (ODOT) and the Oregon Transportation Commission (OTC) revised the way the State Transportation Improvement Program (STIP) is developed. The state s STIP is no longer developed as a list of projects assigned to specific funding pools specified by transportation modes or funding programs, but is primarily divided into two broad categories: Fix-It and Enhance. Enhance activities are those that either improve or expand transportation modal options, while Fix- It activities are those that maintain or preserve the transportation system. The prioritization process for Fix-It projects remain similar to prior STIPs. Repair priorities, comprise the greatest portion of funds, and are identified through ODOT s asset management systems through technical findings on the conditions of pavements, bridges, and auxiliary asset classes. Repair needs are then prioritized within ODOT (ODOT, 2017). ODOT is in a mainly preservation-focus mode, focusing over 90 percent of its discretionary funding on addressing the existing state transportation system as the highest funding priority. Limited funds are available for non-maintenance activities, which has made ODOT staff highly conscious to how best to spend those limited funds. After accounting for set-asides, the agency has allocated in its STIP $845.5 million to its enhance and fix-it programs. Enhance activities comprise less than 10-percent of total program funds outside 84
99 of off the top programs, as evidenced by Oregon STIP funding that is shown in Table 7 below. ODOT has developed a qualitative approach for evaluating these investments in light of multimodal considerations. Table Oregon STIP Allocations (Program Total) ODOT Enhance and Fix-It Funds $845,461,953 Fix-It (Highway and Non-Highway - $27 M) $765,461,953 State Highway System Leverage Funds (Fix-It / Enhance) $50,000,000 Enhance Non-Highway $30,000,000 Off the Top Programs $419,985,237 Surface Transportation Program to large MPOs $85,417,662 STP Allocation to Cities, MPOs & Counties $73,683,378 Local Bridge $69,271,208 State Planning and Research $58,500,000 Congestion Mitigation and Air Quality Improvement $47,718,339 Public Transit $31,500,000 Transportation Growth Management $12,825,000 MPO Planning (includes state match) $10,556,951 Immediate Opportunity Fund $10,500,000 Transportation Alternatives Program to large MPOs $4,937,873 Active Transportation Discretionary $4,200,000 Recreational Trails (to State Parks) $4,124,825 Workforce Development/On Job Training $3,150,000 Rail-Highway Crossings-State $2,100,000 Safe Routes to School Education $1,500,000 Total $1,265,447,190 ODOT has become increasingly focused on multimodal approaches. The Enhance process represents a significant change in ODOT s funding, in the agency being guided by its strategic goals to tie multimodal planning with their investment strategies. Over the past five years, the agency has engaged with local partners in developing the STIP to better identify projects that assist in moving people and goods through the transportation system (ODOT, 2017). ODOT uses Enhance Program funds to achieve this purpose. Enhance projects are also competitively funded. 85
100 Rather than focusing on each mode or project type separately, the Enhance project evaluation process focuses on projects that deliver system-wide benefits and improvements. To address geographic equity concerns, funds are divided based on a Region equity formula and split between each of the ODOT regions (ODOT, 2015) Enhance Funding Project Assessment Enhance projects are qualitatively assessed based on multi-objective approaches. Projects are all evaluated through proposals, where applicants, typically local governments, must point out the benefits of projects as they align with sub-criteria used by ODOT to evaluate project effectiveness. The key focus of the limited Enhance funds available is to make key connections between modes or facilities, and to improve people s access to economic opportunities. These funds are highly limited, so ODOT has created the Enhance proposal review process to ensure that funds are distributed towards high-priority and strategic transportation investments. A project does not necessarily need to be located along a state highway system, but it must show how it improves the state s multimodal transportation system indirectly. Applicants are scored based on cross modal criteria and three modal attribute evaluative areas: (1) connectivity and system benefits (how a project addresses a system deficiency or supports intermodal connections), (2) safety and public health (addresses a safety issue and improves public health through allowing for increased physical activity), and (3) accessibility and mobility (improves last mile connections and better links populations to key destinations) (ODOT, 2015). Cross modal criteria are shown below in Table 8. 86
101 Table 8 ODOT Cross Modal Criteria Economic Development Social Benefits Environmental Stewardship Safety Project Readiness Leverage Project improves transportation access and mobility for workers Project reduces costs of travel for workers Project improves the operation, safety, or efficiency of the transportation corridor or system Projects helps to sustain or generate long-term and/or living wage jobs Project serves an economically distressed community Project improves access to jobs Project supports development, redevelopment Project supports Policy 4.3 Creating Communities of the Oregon Transportation Plan: It is the policy of the State of Oregon to increase access to goods and services and promote health by encouraging development of compact communities and neighborhoods that integrate residential, commercial and employment land uses to help make shorter trips, transit, walking, and bicycling feasible. Integrate features that support the use of transportation choices. Project increases physical activity Project increases transportation choices Project assists transportation disadvantaged communities in meeting their transportation needs Increases awareness of a cultural, natural, historic, scenic feature on travel route. Supports Policy 4.1 Environmentally Responsible Transportation System of the Oregon Transportation Plan: It is the policy of the State of Oregon to provide a transportation system that is environmentally responsible and encourages conservation and protection of natural resources. Project aligns with the strategies and/or elements outlined in the Oregon Statewide Transportation Strategy (emission reduction) Project reduces vehicle miles traveled Project reduces conflict between modes that use the facility proposed for improvement Project reduces frequency and severity of fatal and serious injury crashes across modes Project completed a public approval process Project completed some technical approval process (e.g. right-of-way complete, survey complete, environmental review (e.g. environmental impact statement) complete) Projects with a revenue or timing nexus that allows projects to mutually benefit one another Additional project funding from public or private sources In-kind or other contributions (such as providing labor, equipment, materials, rightof-way, etc.) Additional public or private investment in infrastructure in the affected area or community that would occur as a result of the transportation investment The process of evaluating projects is mainly qualitative. There is no defined scoring system that ODOT or ACT (non-odot) staff are reported to use. Projects are evaluated qualitatively based on multiple objective areas and how well these criteria are met. Those projects that meet multiple criteria areas are identified as being more beneficial to fund in 87
102 enhancing the state s multimodal transportation system. The funding of projects remains a collaborative process, with each ODOT Region working with their Area Commissions on Transportation (ACT) to develop an overfunded 150% project list, which is then prioritized by the ACT to develop a financially-constrained 100% project list. During the 150% list stage, project proposers work with ODOT staff to provide more detailed cost information. The 100% list recommendations are brought to the Oregon Transportation Commission for inclusion in the draft STIP (ODOT, 2015) Stronger Planning and Programming-Based Linkages through Mosaic Tool ODOT, like other state Departments of Transportation, is reconciling the linkage between planning and programming in not being as fluid when examining ways to optimize the investment decisions being made to improve outcomes. However, recent actions taken in Oregon have involved eliminating many of the programmatic barriers in distributing discretionary Federal dollars, and efforts since 2010 to implement least-cost planning techniques all have led to a better process for making strategic investment decisions. Oregon DOT has developed an in-house Mosaic tool to provide value and cost information in the transportation planning stage, which is currently being tested by a small MPO in development of their Regional Transportation Plan (ODOT, 2014). The Mosaic tool is used to help transportation planners and decision makers in Oregon evaluate the economic, environmental, and social benefits and costs of transportation programs and investments in a transparent manner. It is not a project-level tool, but Mosaic is able to be used at both the local and regional levels, with ability to calibrate the tool based on the available data, staffing constraints, and to also account for community desires and goals. Oregon 88
103 developed the Mosaic tool to demonstrate least-cost planning in its approaches, as spelled out in Oregon legislation enacted in 2009 through House Bill 2001 (ODOT, n.d.). "Least-cost planning means a process of comparing direct and indirect costs of demand and supply options to meet transportation goals, policies or both, where the intent of the process is to identify the most cost-effective mix of options" (HB , 2009). Mosaic uses indicators to provide indications for how large-scale investments compare. This broader, planning-level analysis tool allows for jurisdictions and for ODOT to compare different alternatives, and assess the value of different decisions in terms of least-cost and alignment with strategic goal areas. Mosaic s use in the transportation planning process is mainly additive, for evaluation purposes: in multimodal planning for road, intermodal, transit, and non-motorized improvements. Mosaic adds multi-objective decision analysis (MODA) understanding into the planning process of how different bundles of investments translate in value based on indicators (ODOT, 2014). The Mosaic tool requires staff and stakeholder input to develop both quantitative and qualitative estimates of impacts for each indicator area, and the workbook will translate these data inputs into scores on a shared scale (ODOT, 2017b). Users indicate which criteria should be qualitative or quantitatively evaluated and weight each category by its importance. In the below example, shown as Table 9, for the Mobility category the decision-maker uses evaluative measures Reliability Recurring Congestion (MO.3) and Reliability Non-recurring Congestion (MO.4) with assigned weights of 8 and 7, respectively, in providing for a total of 15 points used to evaluate mobility. Accessibility 89

104 is given 10 points in this example, with the point values split between five specific indicators. Table 9 Example of MODA Weighting in Oregon Mosaic Tool Source: ODOT User Guide: Mosaic Value and Cost Informed Planning, 2017 Mosaic is used to assess how alternative bundles of transportation projects and programs change the base case, which is typically a no-build, or status quo scenario. Mosaic relies on several other forms of data to calculate the net effects of alternative bundles of projects and programs. A travel demand model is used in conjunction with the tool to assess the anticipated performance in the Mobility and Accessibility categories. Other data used includes General Transit Feed Specifications (GTFS) data to evaluate transit accessibility and Census data for counting population, with GIS as a platform being used to evaluate accessibility changes (ODOT, 2017b). The Economic Vitality category relies on IMPLAN data (an economic impact analysis tool for planning), travel demand modeling, and sketch-planning modeling (ODOT, 2017b). Sketch planning refers to quickresponse planning tool. The Environmental Stewardship category relies on EPA MOVES emissions rate calculations, Oregon s Regional Strategic Planning Model (formerly GreenSTEP), and use of GIS as an analysis tool (ODOT, 2017b). The Funding and Finance category largely relies on agency expertise on financial contributions and fiscal impacts. 90
105 For the Safety and Security category, Mosaic offers a safety tool that applies Highway Safety Manual (HSM) concepts to quantitatively evaluate the safety impacts from roadway improvements. Users can adjust crash modification factors (CMFs) based on local knowledge (ODOT, 2017b). Land Use and Growth Management requires minimal user input, with outside land use impacts based on transportation bundles of projects being qualitatively assessed (ODOT, 2017b). Quality of Life impacts are measured by use of sketch models and/or supporting data. Equity is calculated quantitatively or shown as a report only statistic. The data used to populate this category come from other inputs in Mosaic (ODOT, 2017b). Generally, across the Mosaic tool, when an index measure is unable to be evaluated quantitatively, the user can choose to qualitatively score the impact, using -5 to +5 to indicate whether performance improves or decreases for that specific indicator. This gives the user significant impact, so variability in impacts should be weighed. Sensitivity analysis is made possible through the tool, and is helpful to use where impacts are not well-defined. Further technical details are documented in Step 4: Populating the Mosaic Tool of the Mosaic User Guide. In the below table is a description of the specific indicators that the Mosaic tool is able to account for in evaluating the effectiveness of different investment bundles using multi-objective decision analysis (MODA) (ODOT, 2017b). The weights for each of the categories and the different measures can be adjusted based on the interests of the community and the reflections of values, making this tool flexible and adaptive in its use. 91

106 Table 10 Oregon Mosaic Specific Indicator Measures 92
.")
107 The Mosaic tool offers two unique forms of comparison. Benefit cost analysis (BCA) and multi objective decision analysis (MODA). An example of the final output from the tool is presented in Figure 25. Both tools are valuable in being presented together to enrich and inform the decision making process. However, ODOT specifies that the tool alone cannot dictate a decision (ODOT, 2017b). The information from the Mosaic tool provides decision makers a transparent presentation of the values, benefits, and the costs associated with investment decisions so that the decision makers can proceed with developing a set of strategic investments that allows for the agency to accomplish its goals and meet stakeholder expectations. Figure 25 Mosaic Tool: Example Summary of Results Source: ODOT User Guide: Mosaic Value and Cost Informed Planning, Maine DOT s Intermodal Freight Program The Maine DOT s Industrial Rail Access Program exemplifies the kind of programmatic funding commitment that states can make to advance their intermodal freight 93
108 strategies. Maine s use of the IRAP signifies how even a small program can develop an intermodal emphasis in benefiting freight movement. Maine DOT uses the Industrial Rail Access Program (IRAP) to offer financial assistance to further the amount of outside investment, private investment, in rail or rail-related infrastructure that is on and adjacent to Maine s rail system. IRAP serves several intents. The program stimulates economic development and employment growth through the addition of new or expanded freight rail service; IRAP helps to maintain essential rail service where it is economically viable; and the funding enhances the intermodal transportation system in Maine (MaineDOT, 2017). The Maine DOT Office of Freight Transportation is in charge of IRAP funding allocations. Financial assistance is offered through grants to owners and users of rail infrastructure in Maine. Funding requests for state grant assistance exceed available funding, so project applications are prioritized based on criteria (USDOT, 2011). The Freight Office holds responsibility over the IRAP program in evaluating project applications and awarding state financial assistance that is based upon an objective project evaluation process used over the years to ensure that their Department s needs are met and are consistent with plans, particularly the Integrated Freight Plan, and that the investments in freight infrastructure promote the public interest (MaineDOT, 2017b). While the IRAP program is small in size, it attracts significant private investment beyond Maine DOT s portion. Currently, $1,250,000 in Federal and State funding is available to be disbursed from the State Multimodal Account and through State Bond funding (MaineDOT, 2017b). IRAP funded projects tend to fall into four categories: equipment acquisitions, intermodal improvements, new rail infrastructure, and rehabilitation. Within these categories the projects funded can include various intermodal 94
109 components. Grant funding for equipment acquisition is available to those projects that improve the ability to use the rail transportation systems or for surrounding facilities to enhance the intermodal movement of goods. Intermodal improvements involve capital investment that improves the transfer of goods and materials with and between rail and other forms of freight transportation. Rehabilitation funding can be used to restore ties, tracks, and structural materials to ensure a facility is operating to a level necessary by the Federal Railroad Administration (FRA) to meet track safety standards ten years into the future of completing the project. The addition of new rail infrastructure can involve rightof-way acquisition, construction, reconstruction, rehabilitation, and other associated improvements. Facilities funded can extend beyond rail to include loading ramps, forklifts, conveyer belts, and pipelines. The evaluation and selection process through the Freight Office prioritizes the IRAP funding of project applications that reflect the larger policy initiatives of the State (MaineDOT, 2017b). Applicants that are successful in receiving funds under the IRAP program demonstrate the public benefits found from their proposed project in terms of: (1) Cost savings for rail transportation and logistics; (2) Expanded employment and economic development opportunities for communities served by rail and for the rail industry; (3) Justified use of government dollars through a benefit-cost ratio test (4) Continuous and productive improvement of rail service levels from the project. 95
110 (5) Decreased air emissions, highway maintenance, dependence on foreign oil, or highway congestion come from the project and benefit the public. Additionally, there are three other factors for projects that have regional significance, which provide for a more competitive ranking: (6) The project generates economic development in Maine, through a construction or reconstruction project that adds employment and creates investment in Maine, and opens up new economic markets from decreased shipping costs, enhanced service, and/or reduced travel times, which make Maine more competitive; (7) Intermodal access is improved by a demonstrating transportation efficiencies through the use of an intermodal transfer facility; (8) Private investment is attracted at a rate of greater than 50 percent share of the project costs. The evaluation and selection process also includes further consideration of the speed of project implementation, and for the viability of the rail carrier to provide the service it has stated, and also the needs for additional capital from the IRAP applicant. While the IRAP program is small in-scale relative to other Maine DOT transportation investments it plays an important role in improving the intermodal freight system in Maine (USDOT, 2011; MaineDOT 2017b). Further, the program is one that shares similarities of the USDOT INFRA grant program, formerly known as FASTLANE (Government Publishing Office, 2017). This program offers lessons to states that seek competitive Federal funds for freight projects under the INFRA grant program. 96
111 5.3 Utah DOT s Strategic Prioritization Process Utah Department of Transportation (UDOT) has largely shifted its focus towards a performance-based planning and programming linkage, in part because of legislative requirements, and also because of a long history that UDOT has in addressing the state s transportation strategies through highly collaborative planning and programming processes. The collaborative planning exercises appeared long before performance-based emphases appeared at the federal level UDOT s Collaborative Approach to Planning and Programming in Utah UDOT develops their long-range plan with close coordination of the MPO s regional transportation plans (RTPs) and the Utah Transit Authority. Their LRP is one of five plans that make up Utah s statewide transportation plan, called the Unified Transportation Plan. Utah is one of the first states in the nation to compile its statewide and regional transportation plans into one document, and it was as a result of collaborative efforts that began with the State Legislature encouraging the four MPOs in Utah, UDOT, and Utah Transit Authority to collaborate, given that coordination of projects benefits the state s transportation system. In response to the legislature s recommendation, the five transportation planning bodies entered into a Memorandum of Understanding (MOU) to establish a Joint Policy Advisory Committee, as a forum for collaborating between the organization s policy makers. While it was not required, the Joint Policy Advisory Committee led to realignment of planning cycles, financial assumptions, growth assumptions, and modeling approaches to fit with the requirements of all five agencies (UDOT, 2015; Unified Transportation Plan, 2015). 97
112 5.3.2 UDOT s Strategic Goal Alignment In 2014, UDOT refined its strategic goals for them to better guide their planning efforts, and to address the growing demands on Utah s transportation system. UDOT has three strategic goals, with details ways of measuring performance towards their strategic priorities. Performance assessment has dated back well before MAP-21 legislation required it as standard practices. (1) Zero Crashes, Injuries, and Fatalities UDOT is committed to continual safety improvements until the goal of zero crashes, zero injuries, and zero fatalities is realized (UDOT, 2015). Measuring Performance: traffic fatalities, contributing factors, and workplace safety incidents through worker compensation claims. (2) Optimize Mobility UDOT is working towards a transportation system that allows for quicker and more efficient travel in moving people to their destinations, by improving and optimizing operations and strengthening and improving connections for transit, biking and pedestrians, while increasing capacity (UDOT, 2015). Performance is assessed in three areas, managing, optimizing, and capacity: Manage System: estimating travel, tracking incident management and response to weather disruption. Optimize System: measuring signal optimization improvements and managed lanes improvements. 98
 Preserve Infrastructure UDOT sees benefit it proactive preservation that will save taxpayers in the long-run, and by preserving what is already in place UDOT will maximize the investment value of")
113 Increase Capacity: measuring capacity increases, travel-delay forecasts, and expenditures in the Transportation Investment Fund (UDOT, 2015). (3) Preserve Infrastructure UDOT sees benefit it proactive preservation that will save taxpayers in the long-run, and by preserving what is already in place UDOT will maximize the investment value of Utah s infrastructure (UDOT, 2015). Performance is assessed in pavement and bridge condition and maintenance: Pavement condition: tracking ride quality for Interstates and statemanaged facilities, and forecasting pavement condition through distress surveys Bridge condition: tracking bridge condition, age distribution, and pavement and bridge expenditures on a two-year cycle Maintenance: tracking and identify asset performance of 19 asset classes. Figure 26 UDOT s Focus on Extending Pavement Life and Minimizing Pavement Lifecycle Costs Utah is one of the fastest-growing states, but focuses on preservation and maintenance before they grow their system further. Their emphasis towards programming is one that considers the STIP as an investment program, and more than a list of projects. 99
114 While this case study explores the prioritization of UDOT s capital improvements in the largest detail, in terms of UDOT s broader approaches they have increasingly emphasized an asset management focus, particularly in prioritizing preservation funding as they also grow their transportation system. Even as a quickly growing state, to UDOT preservation remains their most cost-effective strategy towards managing assets UDOT s Capital Project Prioritization Development from Legislation Recently UDOT has worked towards several different prioritization reforms in reference to capacity improvement projects. Per Utah Code ( ), the Utah Transportation Commission and Utah Department of Transportation (UDOT) are required to use a weighted project prioritization process for highway capacity projects funded through the state s Transportation Investment Fund. Utah Code was developed from the Utah State Legislature s 2005 passage of S.B. 25 to develop a prioritization process (Utah State Legislature, 2008). The bill directed the Utah Transportation Commission, in consultation with UDOT and MPOs to develop rules for prioritizing new transportation capacity projects, and describe the actions UDOT will take to advance their strategic goals. UDOT is also required to make the rankings public and how individual projects are scored (Utah State Legislature, 2005). In response to the Utah State Legislature s directive, the Utah Transportation Commission adopted Rule R Utah Transportation Commission oversees UDOT and instructs the Department to first seek to preserve existing infrastructure and optimize its mobility before adding new capacity. Under this frame, UDOT will improve mobility through using technology, access management, and TDM among other tools available and similarly assess safety in the same lens, while prioritizing safety improvements at key highway locations (Utah Office of 100
115 Administration Rules, 2012). New capacity projects will only be recommended after the above steps are taken, and then will be referred to the Utah Transportation Commission (Utah Office of Administration Rules, 2012) UDOT s Capital Project Prioritization Process In complying with Utah Code and UDOT Transportation Commission Administrative Rule R940 6, the prioritization process involves the use of weighted criteria based upon data that is collected by UDOT to develop scoring for capacity projects proposed in the Unified Transportation Plan. UDOT has developed its own published procedures in response to S.B. 25, in Selecting and Programming Highway Projects UDOT 07-10, and shown as APPENDIX C. The procedures refer to the alignment of agency prioritization of highway projects with the three strategic goals, and one other, strengthening the economy. UDOT provides flexibility to the Utah Transportation Commission to select projects regardless of their score or ranking. Projects are to be ranked and prioritized using quantifiable means (UDOT, 2013). In the prioritization process, six separate prioritization procedures are used, based on the type of project. Each type of project has its own weighting factors. These project types are summarized in Table 11. Table 11 UDOT Capital Improvement Project Types Project Type Description 1. Widen Existing Facilities Typical widening project: adding travel lanes, auxiliary lanes to a roadway segment 2. New Facilities Construction of a new roadway 3. Upgrade Existing At-grade Intersections Conversion of a signalized, at-grade intersection to a grade-separated interchange 4. New Interchanges on Existing Freeways Constructing a new interchange on an existing freeway or expressway 5. Upgrade Existing Interchanges Reconstruction of an existing grade-separated interchange to increase capacity/safety 6. Passing Lanes Construction of a passing lane, often on a rural freeway or highway 101
, congestion, and safety.")
116 UDOT s evaluation of capital projects focuses on both the urbanized and nonurbanized areas of Utah, in evaluating where capacity improvements are most needed. The six project list categories using scoring criteria fall under three universal categories: size/magnitude (measured mainly by vehicle and truck volumes), congestion, and safety. In addition to these scoring criteria, some project types also use other scoring criteria. Figure 27 below summarizes the scoring criteria for each prioritization type as well as the relative weight each score contributes to the total project prioritization score. Note that only upgrades of existing intersections, new interchanges on existing facilities, and upgrades to existing interchanges require a benefit-cost calculation. Safety index calculations only apply to capacity improvements for existing facilities. Figure 27 UDOT Existing Prioritization Process Scoring Summary The ranking of projects based on the above weighting procedures is undertaken by UDOT staff, but the Utah Transportation Commission has amending privileges (to add or remove projects, if the commission s so chooses) and gives final approval for all 102

117 construction programs and projects (UDOT, 2013). Evaluation criteria for capital improvements reflects an optimization approach towards accommodating new growth, reducing vehicle delay, increasing safety, and improving freight movement in mountainous areas. UDOT (2016) uses these objective criteria in their Decision Support System to rank projects lists and assist the Utah Transportation Commission in the decision-making process of funding and adding projects from the Unified Plan into the STIP. An example of this is shown in Table 12. Table 12 UDOT Decision Support System (Existing-at-Grade Intersection) Source: Limitations of UDOT s Prioritization Approach and Potential Emphases UDOT has developed an objective procedure for evaluating capital improvements. The approach uses only quantitative scoring to rank priorities. UDOT is able to use these process for highway projects, but the scoring is not cross-modal. The evaluation is largely limited to vehicle and truck volumes, thus many of Utah s Unified Transportation Plan goals are not aligned with the criteria used. More economic valuation can take place. Under the Decision Support System three of six project categories in this prioritization system use cost-benefit analysis to inform the ranking of capital improvements. While new facilities 103
118 are not evaluated, it would be useful to examine their benefit-cost ratio to effectively prioritize projects of the same type. Utah DOT has engaged in more strategic agency-wide prioritization efforts in recent years. Like most DOTs, the agency still struggles with moving towards cross-asset allocation decisions, but they are evaluating use of Decision Lens software to make investment decisions based on optimizing dollars spent versus performance achievement (Decision Lens, n.d.). Decision Lens uses performance dashboards that uses UDOT s own data to put into a predictive model that shows the tradeoffs between one project being funded over another and the anticipated future performance. Inside Decision Lens software, UDOT staff can account for their strategic goals in safety, mobility, and preservation, and the criticality of certain projects. A portfolio summary presents how projects selected are predicted to impact performance (Decision Lens, n.d.). Even with the use of a software like Decision Lens, UDOT has to continue to examine how its internal processes can better align to allow for cross-asset prioritization, and how their strategic priorities can advance, while addressing competing tradeoffs in funding. UDOT is moving towards assessing the overall contribution that Unified Plan projects have on meeting their strategic goals, visually shown by Figure 28 below. The transition towards performance evaluation is in light of MAP-21 rulemaking requirements. As well, while they do not have specific measures finalized they are working towards ways to evaluate Unified Plan projects contribution towards meeting strategic goals, to better link the planning and programming process. Additionally, UDOT is exploring the potential to use the Utah Unified Transportation Plan performance measures, once those measures are determined, to gauge success (UDOT, 2015). In 2019, a new LRP will be published, 104

119 which may include these linkages. However, in the interim, recommendations are made in this research to promote this alignment. Figure 28 Role of Long-Range Planning in Prioritization of Projects at UDOT Source: UDOT Long-Range Transportation Plan: Transportation in Rural Areas, 2015 In examining the broader goal areas as found in the Utah Unified Transportation Plan (2015), and shown in Figure 29 below, more strengthening of the alignment between the goals mentioned in the Unified Plan and UDOT s prioritization criteria for capital improvements can occur. An air quality impact measure and a person-movement congestion measure would promote greater alignment with two of the Unified Plan goal areas (1) air quality and (2) mobility and accessibility, which are largely not aligned with current evaluation criteria used in the Decision Support System. On accessibility, there are an increasing number of platforms that offer GIS capabilities in analyzing the benefits of capital project improvements on job accessibility (McCahill, 2016). For example, the 105

120 Virginia Department of Transportation uses an accessibility tool that measures the changes in job accessibility from capital improvements. Recent national shifts in Federal rulemakings towards measuring person movement can be better reflected in the Decision Support System evaluation criteria, and can lead to greater alignment with mobility-based goals described in the Unified Transportation Plan. Figure 29 Linking Utah Unified Transportation Plan Goals and Objectives to Capital Improvement Prioritization: the Need for Stronger Alignment Adapted From: Utah s Unified Transportation Plan
121 5.4 Virginia DOT s Cross-Modal SMART Scale Prioritization Process The Commonwealth of Virginia has established a data-driven prioritization approach for allocating state transportation funds, referred to as SMART SCALE (System Management and Allocation of Resources for Transportation). VDOT explicitly refers to their strategic focus through SMART SCALE is to fund the right transportation projects through a prioritization process that evaluates each project s merits using key factors (VDOT 2016b, pg. 1). The prioritization process through SMART SCALE focuses solely on capital expansions, enhancements, and improvements. Per Virginia Code asset management projects are excluded from SMART SCALE, and funded under Virginia s state of good repair program, as described in Table 13 below (VDOT, 2016a). Virginia focuses their asset management approaches entirely on preservation and upkeep of existing assets. If an existing road facility is to be upgraded beyond repair or exact replacement, it would fall under SMART SCALE, unless an alternative funding source is used. While most projects seeking state and Federal discretionary fund categories are required to go through the SMART SCALE process, certain programs are exempted, including: Congestion Mitigation and Air Quality Improvement (CMAQ), Highway Safety Improvement Program (HSIP), the Regional Surface Transportation Block Grant Program (STBG), Transportation Alternatives (TA) set-aside funds (formerly known as the Transportation Alternatives Program (TAP) under MAP-21), and VDOT s Revenue Sharing Program, where municipalities have direct access to state funds when able to commit a 50 percent local match. Regional funds raised by additional sales taxes in Northern Virginia and 107

122 Hampton Roads are also excluded from the SMART SCALE prioritization process (VDOT, 2016b). Table 13 Projects Evaluated Under Virginia s SMART SCALE Program Source: VDOT SMART SCALE Policy Guide, Motivations for Adopting SMART SCALE for Prioritizing Improvements A large motivation for adopting a new data-driven approach through SMART SCALE was to make the transportation process more predictable and transparent from the outside. Prior to the implementation of SMART SCALE, the Commonwealth utilized a politically driven and opaque transportation funding process that included uncertainty for local communities and businesses. (SMART SCALE Technical Guide, 2016, pg. 1). The Commonwealth Transportation Board (CTB) oversees Virginia s transportation investments, and held responsibility in developing and implementing a transparent and quantifiable prioritization process that became known as SMART SCALE for making investment decisions for capacity enhancements projects receiving state funding and are included in the six-year improvement program (Virginia s construction program). 108
123 SMART SCALE was the result of a series of bills that passed through the Virginia Legislature. Through the prior Governor s passage of increases in transportation revenues and funding, it led to discussions over how to utilize these new funds in the most efficient manner possible. In 2014, the new Governor signed House Bill (HB) 1887 stipulating a new allocation of transportation funding to meet Virginia s transportation needs. Prior to this legislation, the state utilized a formula to distribute funds for primary, secondary, and urban highway systems. The HB 1887 legislation updates both the funding formula and funding distribution. The formula places projects into three separate programs: state-of-good repair (maintenance), high priority projects, and construction district grants. The latter two categories are projects that fall within the purview of the SMART SCALE prioritization program. Through HB 1887, 45 percent of formula funding are for state of good repair projects, maintenance projects, and the remaining 55 percent of funds are split evenly between projects that are part of the high priority or construction district grant programs. (VDOT, 2016b). The passage of HB 2 legislation was bipartisan and unanimous in 2014, and led to the creation of SMART SCALE. The intention of this legislation was to establish an objective process for promoting cost-effectiveness and goal-orientation in funding state transportation capital improvement projects across the state. To arrive at an objective process, the Commonwealth of Virginia instituted agency-wide evaluation procedures. Review of projects is undertaken by several divisions under the Office of Secretary of Transportation, the Virginia Department of Transportation, the Office of Intermodal Planning and Investment, and Department of Rail and Public Transportation, all are tasked with calculating anticipated project benefits through a Technical Evaluation Team. To 109
.")
124 ensure ethical compliance, an external peer review comprised of several state and federal agencies review the results of the technical analyses before scoring is sent to the Virginia Commonwealth Transportation Board. The multi-step process of screening, evaluating and scoring, prioritizing, and then programming projects is shown by Figure 30 below (VDOT, 2016a). Projects must first meet eligibility requirements, then be submitted as an application. Projects are then screened as being eligible, are evaluated and receive a score, and then prioritized based on the final score. Figure 30 Process for Evaluating Projects Under VDOT s SMART SCALE Source: VDOT SMART SCALE Policy Guide, 2016 SMART SCALE scoring is part of a larger agency effort to align their plans and investment priorities based on a performance-based process. The VTrans 2040 plan, the long-range transportation plan currently being developed, presents the overarching vision and goals for Virginia s transportation system and describes the transportation investment priorities across the state, while giving an overall direction for programs to incorporate these priorities and strategies. VTrans 2040 represents a significant directional shift over the years in realigning investment priorities through performance data. In the last update, VTrans 2035, goals were linked to help guide investment decisions, but the VTrans 2040 plan is a further step forward in fully integrating the performance-based planning 110

125 approaches, where future performance data leads to realignment in investment priorities (VDOT, 2017). Figure 31 Virginia s Long-Range Planning Updates: 2004 to Present Source: VDOT, VDOT s SMART SCALE Factor Areas and Evaluative Measures The scoring system used in SMART SCALE is a MODA decision framework application. The weighting is flexible in VDOT Districts, in providing MPOs their own authority in assessing the scaling of priorities. Six factors are used to evaluate projects, with land use an optional factor for those District areas with under 200,000 in population. Factors of evaluation include (1) improvements to safety, (2) congestion reduction, (3) accessibility, (4) land use, (5) economic development and the (6) environment, as shown 111
.")
126 in Table 14 below (VDOT, 2016a). Each factor area includes one to three evaluative measures used to assess projects. The measures all have defined weights, but the factor area weight is explained by geographic context (this will be explained further below). Table 14 VDOT s SMART Scale Evaluation Measures Source: VDOT SMART SCALE Policy Guide, 2016 Land use is accounted for in all of the urban districts: Northern Virginia, Hampton Roads, and Richmond. Rural jurisdictions do not account for land use, but metropolitan planning organizations (MPOs) within these mostly rural districts can account for land use in their weighting. On the other factor areas, congestion mitigation weighting is strongly tilted towards the two most congested parts of the state, Northern Virginia and the Hampton Roads area where 45 percent of the scoring weight is based on this factor, alone, see Figure below (VDOT, 2016a). Other regions of the state consider the economic development and safety factor areas with the highest weight. This unique district-level weighting typology allows for VDOT Districts, MPOs, and Planning District Commissions to assert more authority over what factors they would like to weight higher to evaluate and prioritize local projects. The weighting for each factor area based on 112


127 geographic context is showed in Figure 32 below. In a district there can be multiple categories of weighting. For instance, the Culpeper District uses Category C weighting, but the Charlottesville/Albemarle MPO uses Category B weighting. Since the MPO can use their own weighting, they can account for land use, while the outlying rural part of the VDOT District can account for the Safety and Economic Development factor areas more heavily. Figure 32 Virginia Regional Weighting Typologies Source: VDOT SMART SCALE Policy Guide, VDOT s SMART SCALE Screening Process and Data Responsibilities Through SMART SCALE, all transportation modes are examined under the same objective process and scoring evaluation methods. VDOT values the ability to prioritize state transportation projects based on mode-neutrality in their project evaluation methods, 113
128 because of the benefit it has in depoliticizing decisions (VDOT, 2016a; Donohue, 2017). While the politics could have simply shifted from the decision to the weighting and evaluation, the use of state review process under peer review eliminates the potential for the politicization to simply occur earlier in the process. As well, the different weightings across the state of Virginia leads to the selection of projects that reflects the differing priorities of individual regions across the state under one objective process. The larger intention in the development of the scoring system is for it to be transparent, understandable, and fair to both urban and rural environments. Four different weighting typologies are used across the State of Virginia to account for the differing priorities of rural and urban jurisdictions. All projects applying for SMART SCALE funding go through an initial screening process, to ensure that every project evaluated for funding has an identified need in VTrans2040. The screening process ensures that the planning and programming processes used in Virginia are linked. VTrans2040 places the State s transportation needs at four different scales, and the three below each are considered under SMART SCALE, as shown in Table 15. Each scale has its own set of guiding principles to approach transportation strategies at multiple scale. Those routes designated as a Corridor of Statewide Significance are key multimodal travel corridors to Virginians in moving people and goods and serving primarily long-distance, cross regional travel. Regional Networks are multimodal networks that identified in the plan as facilitating regional travel within urban areas. Urban Development Areas are identified by jurisdictions as to where they intend to concentrate future population and employment growth and development. Safety is a 114
129 fourth area; projects can be outside of the Corridors of Statewide Significance, Regional Networks and Urban Development Areas that address safety needs. SMART SCALE is a state-process, but projects all have to come from locally or regionally-identified needs. The identification of project needs is largely a cooperative process between localities and the Departments. Virginia Department of Transportation and Department of Rail and Public Transportation help localities prepare applications, but cannot submit applications themselves or instruct eligible entities to submit projects on behalf of the DOT (VDOT, 2016a). Eligible project applicants that are able to submit SMART SCALE applications are shown in Table 15. Visually those locations are also shown in Figure 33. Table 15 Agencies Eligible as Project Applicants under SMART SCALE Source: VDOT SMART SCALE Policy Guide, 2016 Project Type Regional Entity (MPOs, PDCs) Locality* (Counties, Cities, and Towns) Public Transit Agencies Corridor of Statewide Significance Yes Yes, with a resolution of support from relevant regional entity Yes, with resolution of support from relevant regional entity Regional Network Yes Yes Yes, with resolution of support from relevant entity Urban Development Area No Yes No 115
.")
130 Figure 33 SMART SCALE Eligible Project Locations Source: VDOT SMART SCALE Policy Guide, 2016 Virginia s SMART SCALE is highly data-driven, but this means that data needs are significant. To reduce the complexity and monetary costs for project applicants, VDOT has assumed responsibility for some of the more burdensome data needs (VDOT, 2016b). All of the measures used to assess projects have the data available. To develop the scoring factors around the focus of mode-neutrality, measures in each factor area had to be made applicable to all modes, particularly in reference to the congestion mitigation and accessibility measures where focuses have become newly placed on DOTs to look beyond traditional congestion and mobility-based metrics. Data quality could also be an issue, given the number of evaluative measures used to assess projects. The State of Virginia remedies this challenge, though accessing data platforms that provides the agency with the ability to evaluate projects quantitatively on all measures, except for land use, and have factor scores be highly reflective of how much value a project would add. 116
131 Evaluation measures are listed in Table 16 along with whether the State of Virginia or the project applicant is responsible for providing the data. Most of the more qualitative indicators are handled by the project applicant, whereas Virginia assumes responsibility over the measures that require GIS analysis, travel demand modeling, and more technical evaluation tools. For instance, checklist requirements and local development impacts would be information that is readily known to a local project sponsor, whereas VDOT would be able to assess the amount of freight tonnage moving through the project area. At the state level, VDOT and Department of Rail and Public Transportation (DRPT) calculate the scores for all projects, using the data inputs that are the responsibility of the applicant. 117
132 Table 16 VDOT and Applicant Data Responsibilities: Calculating Measures Source: VDOT SMART SCALE Technical Guide,
133 5.4.4 Technical Description of Evaluation Measures under SMART SCALE The six factor area categories include: safety, congestion mitigation, accessibility, environmental quality, economic development and land use coordination. These factor areas were developed through legislation to encompass project impact areas that can be measured, without being excessively duplicative or complex. Each factor area has sub evaluation measures with defined criteria that are used to analyze and prioritize projects transparently and objectively. Below, each factor area and the evaluative measures used for analysis will be described in detail. Multimodal aspects of each evaluative measure area will also be described Safety Measures The SMART SCALE safety measures were developed to calculate the degree to which projects addressed injuries and deaths, through an emphasis on achieving the greatest rate of crash reductions, and to quantify these reductions for all project types, including transit. Two quantifiable metrics were developed: (1) number and rate of fatal and severe injury crashes and (2) rate of fatal and severe injury crashes, shown in Table 17 below. The measures rely on five-year crash data compiled within 1,600 feet of the project limit area (VDOT, 2016b). Crash reduction estimates are based on Crash Modification Factor (CMF) analysis. Bicycle and pedestrian safety improvements may rely on alternative data sources based on the facility classification or the separation of the facility from travel lanes. For transit, freight rail, and TDM projects, alternative analysis is used to assess safety impacts. Percent VMT change is calculated based on data inputs in the congestion mitigation measures, and the reduction in VMT is multiplied by the five-year 119

134 annual average crash frequency to assess the value of safety improvements. The value is calculated by the FHWA equivalent property damage only conversion table for fatal, severe, moderate, and minor injuries, with these rates multiplied by the rates of crash injury severities by type (VDOT, 2016b). Table 17 VDOT SMART SCALE Safety Measures Source: VDOT SMART SCALE Technical Guide, Congestion Mitigation Measures Congestion mitigation measures are aimed at enhancing the reliability for people to move people through the transportation system with fewer delays. The subarea measures include (1) person throughput and (2) person-hours of delay metrics, as shown in Table 18. These metrics are corridor-based for a project to score well in this measure, it must be in a location where congestion is an issue. A project is not scored if under a no-build scenario the volume-to-capacity ratio (V/C) is less than The segment with the highest V/C ratio is used to determine if a project corridor meets this threshold under a no-build 120
135 scenario, otherwise no score is given. Changes in peak flow rates during the peak hour are used to calculate a score for the total change in person throughput (VDOT, 2016b) is the comparison year for peak period traffic volumes. Peak period vehicle throughput is converted to person throughput through multiplying by the average vehicle occupancy rate. For other modes of travel, increased person throughput is based on the estimated reduction in vehicle demand on parallel facilities. Person hours of delay also requires a V/C ratio of 0.95 to be achieved along a segment under a no-build scenario. If congestion exists, then peak flow rates are used to calculate travel speeds. The delay is the difference between the calculated travel speed and the posted speed limit. This difference is then multiplied by the average vehicle occupancy to assess the average person-hours of delay. Both person throughput and person hours of delay are given equal weight under the congestion mitigation measures (VDOT, 2016b). Person movement data for transit projects, in estimating both daily and hourly ridership, is provided by the Virginia s Department of Rail and Public Transportation (DRPT). For managed lane projects, VDOT will provide assumed occupancy rates. Pedestrian and bicycle projects receive no points in the delay measure. Table 18 SMART SCALE Congestion Mitigation Measures Source: VDOT SMART SCALE Technical Guide,
136 Accessibility Measures As indicated by the survey results in Chapter 4, Virginia is among a select handful of DOTs in accounting for accessibility in their prioritization methods. Their accessibility score is computed solely through highly quantitative approaches. Projects are evaluated based on the access changes to jobs, access changes to jobs for disadvantaged populations, and access to multimodal choices, as shown below in Table 19. Job access is weighted based on a travel time decay function. For disadvantaged populations, the metric focuses in on what VDOT classifies as tracts with regionally-significant shares (above the 75 th percentile in the Planning Development Commission area, based on 2010 Census information) of low-income minority or limited-english speaking households in measuring their change in access to jobs. The accessibility tool calculates the change in jobs reachable over a 45-minute time window and for transit it is over 60 minutes, with the number of new jobs reached calculated based on the associated transportation improvement. The travel times are computed based on estimated project build peak congestion and for transit projects, the operational improvements are coded through GTFS data. The build and no build conditions are compared in computing accessibility change, with applicants able to provide modified land use densities for future build-out (VDOT, 2016b; McCahill, 2016). 122
137 Table 19 SMART SCALE Accessibility Measures Source: VDOT SMART SCALE Technical Guide, 2016 Through the multimodal choice measure, VDOT encourages project sponsors to enhance intermodal connections, given those projects that enhance accessibility will perform well under this measure. GIS software is used to display all the multimodal transportation options provided, including: bike facilities, park-and-ride-locations, and other options. Points in the access to multimodal choices are calculated based on the number of peak period non-sov users (VDOT, 2016b) Environmental Quality Measures The Environmental Quality factor assesses in the first objective both air quality and environmental effects for projects that offer improvements in air quality and reductions in greenhouse gas emissions (or alternative energy use). In this measure, there is no in-depth analysis of emissions rates or pollutant concentrations. This category is mostly qualitative based and the points that are derived in these categories is based on whether a project 123

138 contains non-sov facilities. A detailed description of the qualitative point allocations for measure E.1 is shown in APPENDIX D. Yes answers are totaled up and then multiplied by the number of peak period non-sov users. If truck traffic is greater than 8 percent of AADT, 10 percent of the category s points can be awarded towards projects that reduce traffic delay (with the measure scaling based on peak period truck volumes), and another 5 percent of the environmental factor category score is for those projects that involve improvements to the freight rail network or improve or create intermodal (truck to rail) facilities (VDOT, 2016b). Table 20 SMART SCALE Environmental Quality Measures Source: VDOT SMART SCALE Technical Guide, 2016 Impact to natural and cultural resources is the other half of the environmental quality project score. Land in the project area that is environmentally-sensitive is put into four categories: conservation lands, species/habitat, cultural resources, and wetlands, and analyzed through GIS. A quarter-mile buffer is considered in the impact area of the project. VDOT/DPRT environmental staff will anticipate the amount of environmental documentation needed for the project. The amount of potentially impacted area acreage that is counted towards the score is based on the anticipated type of environmental document required: an Environmental Impact Statement uses 50 percent of the acreage; 124
139 Environmental Assessment uses 30 percent; and Categorical Exclusion uses 10 percent. The acres counted based on the anticipated environmental document required is then divided by the total buffer area. Acreages are then normalized on a 100-point scale, with lower acreages impacted receiving more points (VDOT, 2016b). The score relies on the final scores for the other factor areas (safety, congestion, access, economic development, and land use, if computed) in arriving at a final score for the E.2 measure (VDOT, 2016b) Economic Development Measures In the economic development factor area projects are measured in this category based on project support for economic development, intermodal access and efficiency, and travel time reliability. Through the SMART SCALE process, not a single project can move forward solely because of economic development purposes; it must also achieve a primary transportation purpose to be eligible (VDOT, 2016b). A primary transportation purpose in this process means that the project has to also demonstrate improvement in some other factor area, whether it be safety, congestion mitigation, access, economic development, or land use. In the Economic Development Support measure area, ED.1, project consistency and support of local/county/planning District Commissions/regional economic development plans and the support of planned non-residential development within the project corridor receives higher scoring. The project assessment for measure ED.1, as shown in Table 21 below, is based on a checklist, with validation of the project being supported by economic development presented in narrative form. Non-residential development square footage within vicinity of the project is used as a multiplier. The buffer area is strictly defined based on three tiers (VDOT, 2016b). Tier I projects are smaller in 125
 Source: VDOT SMART SCALE Technical Guide, 2016 Table 22 Economic Development Support ED.1 Buffer Distance (10.")
140 scale, and thus a one-mile buffer is used. Tier III projects add significant mobility improvements, and thus a 5-mile buffer is used, as shown by Table 22 below. Table 21 SMART SCALE Economic Development Support Measure (ED.1) Source: VDOT SMART SCALE Technical Guide, 2016 Table 22 Economic Development Support ED.1 Buffer Distance (10.3) Source: VDOT SMART SCALE Technical Guide,

141 Access to freight facilities and travel time reliability comprise the remaining score, and are each valued at 20 percent of the total point value in the economic development category. Travel time reliability is focused on reducing the rate of non-recurring congestion delay, given that other scoring criteria account for capacity bottlenecks. In this measure, points are allocated for projects that improve travel time reliability and reduce the incidence of delay from weather-related events. Active traffic management is the highest scoring area, followed by other improvements that all help to reduce incidence from non-recurring delay, including electronic toll conversion, weather and incident management system improvements, traffic demand management, transit integration and improvement median, shoulder, and ramp design, and other associated improvements (VDOT, 2016b). Table 23 SMART SCALE Economic Development Measures Source: VDOT SMART SCALE Technical Guide,
142 Access to freight facilities and efficiency improvements in connections to primary truck freight routes and reduces congestion at freight ports and airports comprises the ED.2 measure in the economic development factor area (VDOT, 2016b). The scoring is mainly qualitative, as shown by Table 24 with the sum of the qualitative assessment scores multiplied by total freight tonnage within the project corridor. Table 24 Intermodal Access and Efficiency Measure (ED.2) SMART SCALE Source: VDOT SMART SCALE Technical Guide, Land Use Measures Land use coordination is a factor only considered for projects within areas of population of over 200,000. There is one measure used that is assessed in a qualitative manner, based on consistency with an area s comprehensive plan, particularly related to 128

143 transportation and land use coordination. As shown in Table 25 below, in-fill development is awarded higher point values than new development in this project category. Connectivity is assessed based on having an access management plan. Development promoting walkable, mixed-use characteristics is also granted additional points. Scores are multiplied by future employment and residential densities to scale the measure s final point allocation (VDOT, 2016b). Table 25 SMART SCALE Transportation-Efficient Land Use Measure Source: VDOT SMART SCALE Technical Guide, Integrating SMART SCALE Evaluation Measures into an Overall Score SMART SCALE offers a project evaluation scoring procedure that is highly datadriven, and relies on multiple criteria combined into one generalizable score, referenced as the value of the project. Based on the literature review, the decision science application that SMART SCALE uses is the Simple Multi-Attribute Rating Technique (SMART 2 ), where the value of different projects are computed as a total sum, based on the performance value, and weight of each criterion (Olson 1996; Barfod & Leleur, 2014). Virginia describes the project weighting methodology in four steps. The first step is to normalize the measure weights in each factor area. The project with the highest 129

144 measure value is assigned a score of 100. Other measure values are then recalculated based on this normalization ratio. If one project, for instance, produces 20-times more person throughput than the second-best project, it would get a score of 100, and the next best would get a score of 5 for that measure (VDOT, 2016b). The second step is to apply the measure weights, so if a category assigns 50% to that evaluation area, the first project would get 50 points for that measure and for the remaining factors the score would be computed, out of the total 100 possible points for each factor area. In step three, the raw factor scores are then multiplied by the overall weighting from the weighting typology described by each Virginia region. Finally, step four is where the calculated project score from all of the scores in the factor areas added up would then be divided by the total funding request. If for instance, a project has a final score of 6.4 points and the project request is for $20 million, out of for instance a total project cost of $28.3 million, then the computed cost-effectiveness used as the final point of comparison is: 6.4/2.0 = 3.2 per $10 million dollars of cost. The 3.2 final project benefit-to-cost score ratio would be used as the final point of comparison that the Virginia Commonwealth Transportation Board would use in evaluating the project against other priorities within each VDOT District and statewide, as described in Figure 34 below (VDOT, 2016a). Figure 34 SMART SCALE Project Evaluation Process Source: VDOT SMART SCALE Policy Guide,
145 5.4.6 Measuring Outcomes Is it a Bigger Bang for the Buck? To several states interested in new practices, but not in overly burdensome requirements that projects must go through to be funded, Virginia s project evaluation standards through SMART SCALE may look effective on paper, although skepticism may rise over whether anything changed. Using the same state approaches that were used in the past is always an easier course of action than adapting new approaches. For an agency to switch to an intensive data process of measuring project benefits before projects are funded, through a new performance-based project evaluation method, the benefits should be clearly indicated and able to be shown. For Virginia, capital improvement projects, costeffectiveness and project valuation through those six factors are the criteria that projects are reviewed under, and if a project does not perform to the same standards as other projects it is likely that it will not be funded and placed in Virginia s Six-Year Improvement Program (SYIP), a document that leads to obligation of federal funding in the STIP. Additionally, those projects that do not align with the long-range transportation plan are simply screened out before they are evaluated. The effectiveness of this new approach is best understood through evaluating the impacts of this prioritization process on individual projects. If the SMART SCALE process works as intended the right projects are being funded. Prior to SMART SCALE, the state project selection process for improvements and enhancement was described as political and lacking objectivity. There is not a prior performance standard to compare SMART SCALE to, in evaluating whether this process has led to outcomes where projects being funded are cost-effective, in the public interest, and align with Virginia s transportation goals. Over time there is a plan to evaluate whether SMART SCALE projects derive the 131
146 benefits anticipated, but at this point it is too early to see the overall impacts. While the process is undoubtedly more performance-based than the previous one, through the use of clear and consistent metrics used to evaluate projects before they are selected, the projects themselves may have not changed significantly. However, in analyzing this process, there are differences in the projects being funded through SMART SCALE than made prior to its development. In the first-round SMART SCALE led to CTB recommending full funding of 163 projects in the amount of $1.7 billion (five-years of project funding) across the state. Projects recommended for funding ranged in cost from $160,000 to $300 million. In the second round, project funding requests amounted to $9.25 billion for roughly $1 billion available (two years of project funding) (Donohue, 2017). The competitiveness for project funds encourages applicants to compete in terms of costs, and delivering value in multiple factor areas: safety, congestion, economic development, environment, access, land use. Two example projects are specifically referred to in how SMART SCALE largely influenced the development of these project applications, in the projects standing competitive in the overall application pool. The first project is in southwestern rural Virginia, where Interstate 81 Exit 17 needed interchange modifications to improve capacity, provide adequate storage, and also include a new park & ride facility. This $21.2 million improvement was originally estimated to cost $157 million due to a far more expensive initial design. As displayed in Figure 35, The $157 million design improved the LOS (level of service) from E to B, but the $22 million improvement would cost substantially less and would get the interchange to a LOS of C (Donohue, 2017). Ultimately, the $22 million project cost design was advanced. In its project scoring 132

147 application, the interchange improvement received a 3.2 benefit score and a 1.5 final score, based mainly on its improvements in intermodal access, as shown in the project scorecard displayed in Figure 36. Had the original design been used the project would have had little to no chance for funding. Ultimately, with cost-effectiveness being such a critical factor to the final score, the cost of the Exit 17 project decreased by 86 percent. The cost savings achieved is an example of the kind of impact that a prioritization process based on costeffectiveness can have. Figure 35 Before and After SMART SCALE I-81 Exit 17 Interchange Project 133

148 Figure 36 Example VDOT SMART SCALE Project Scorecard Source: When innovative design treatments are used to address a need, like increased safety, the SMART SCALE project scoring used raises the likelihood of these kinds of projects being funded, even if the benefits are attributed mostly to a single category. In the safety category, designs that significantly reduce crash possibilities are particularly rewarded. In 134

.")
149 the second round, a project application in the Richmond area, submitted by Prince George s County, demonstrated significant safety benefits in reducing fatal and severe injury crash rates, and came at a $5.76 million cost. Given its high safety score it became the 4 th highest ranked project in the Richmond District and the 33 rd highest statewide. At this specific location, 12 crashes were recorded in the last 5 years, 1 a fatality and 11 causing injuries. Based on the new design treatment, crash rates are predicted to drop from 24,143 to 4,838 crashes per one million VMT, an 80 percent reduction in crash risk potential (Donohue, 2017). The project location and design is shown in Figure 37 below. As well, the project scorecard can be viewed in APPENDIX E. The project scorecard for the Virginia Route 106 & 630 intersection improvement, shows an example for how a project can be advanced almost entirely on a single factor area: safety. The project also received points in the environmental factor area, because the project had less anticipated environmental impacts, relative to other project applications. Figure 37 Virginia Route 106 & 630 Intersection Safety Project The SMART SCALE process is part of a broader reform that defines a clear contrast between the present and pre-2013 in decision-making approaches. The emphasis 135
150 in reforming project evaluation is one based around it being a broad-based evaluation method, where there is value to all stakeholders; two, SMART SCALE recognizes the differing needs across the state; three, SMART SCALE has a mode-neutral basis; four, SMART SCALE does not impact already fully-funded projects. To its advantage the reform came across as apolitical; the reforms were advanced through a heavily Republican legislature and was signed by a Democratic governor (Donohue, 2017). Prior to 2013, subjective decisions were often made. The process of projects getting funded became highly political. Partial funding and uncertainty plagued many projects. Decision-making was seen as opaque (Donohue, 2017). Since then, localities have had their roles change. Today, it is much more regionally-driven, which has led to increased collaboration in addressing statewide needs. Localities have gone from previously receiving a formula distribution of funding to allocate as they saw fit to one where they can fund projects to completion. Formula funds were a highly inefficient way to allocate funds statewide, as previously many localities did not receive enough funds to fund projects completely through construction, so funding often sat unused for years. The Commonwealth Transportation Board has since became far less political and much more independent in its powers from the reforms. Additionally, the process of evaluating capital improvements is highly transparent, data-driven, based on objectives, and the projects themselves are fully-funded with certainty for project sponsors (Donohue, 2017). At the time of this research it is too early to come to a conclusion over whether capital projects funded under SMART SCALE align with agency outcomes in their totality. SMART SCALE estimates the value of projects, but the future value of these projects still needs to compare against the examination of projects at the project evaluation stage. At a 136
151 more detailed level, projects selected underscores that the evaluation process rewards costeffectiveness to a significant degree, more than other state-based processes that were reviewed. Through the structure of the scoring system based on project value to cost, a project demonstrating cost-effectiveness is central to that project advancing in its development and inclusion in the STIP. SMART SCALE encourages project sponsors to develop project applications that are aimed at addressing multiple transportation aspects, have minimal environmental impacts, and add value to Virginia s economy and to the taxpayer. In this early review, SMART SCALE is an approach that far exceeds other prioritization approaches out there in its comprehensiveness, data-focus, and its alignment with other state-based processes. 5.5 Suggesting Practices from State DOT Project Evaluation Approaches The four state approaches, provided above, give examples of capital improvement project evaluation that evidence the use of multi-objective decision analysis frameworks. The approaches referenced highlight different objective-based approaches towards project evaluation. Maine DOT has a small intermodal freight rail program that promotes state freight investments that are in the public interest, and that helps to move freight more efficiently and cost-effectively. This program shares significant similarities to the USDOT INFRA program (formerly FASTLANE grant program). Oregon DOT uses a qualitative approach in evaluating capital projects through its Enhance Program, which improve the state s multimodal transportation system. ODOT has also programmatically consolidated its review processes to examine projects in two categories Enhance and Fix-it, thus simplifying the process from the outside. Utah DOT uses a data-driven entirely quantitative based approach to capital project prioritization that emphasizes traditional factors that 137
152 aligns to their agency s three strategic goals. In the years ahead UDOT is advancing greater alignment between the state s Unified Plan and UDOT s programming approaches. Virginia s use of SMART SCALE is to promote optimal capital improvement project allocation decisions based on mode-neutral project evaluation approaches. Virginia has a mixed-approach towards evaluating projects, where the evaluation approach mixes qualitative and quantitative scoring in evaluative measure areas. Overall, the process is highly data-driven, with scores reviewed for quality analysis, quality control to guard against the potential for subjectivity in scoring projects. Scaling is used across all the factor areas to account for the magnitude of project benefits in each factor area. Weighting is applied based on geographic area, in corresponding to the differing needs and priorities across the rural and urban parts of the state. Final scores are based on cost-effectiveness. The emphasis on cost-effectiveness equips the Virginia Commonwealth Transportation Board with the ability to promote optimal programming allocations for capital improvement projects for the state s 6-year plan of projects. The case studies of Oregon, Maine, Utah, and Virginia inform the recommendations presented in CHAPTER 6. Based on federal requirements from MAP-21 legislation and the FAST Act, states are adjusting their processes to better link their planning and programming processes under a performance-based lens. Additionally, the emphasis on freight planning and more collaborative processes that include freight interests has state DOTs examining ways to improve their state s intermodal movement of goods through programming. The case studies help to guide thinking about new approaches necessary to help states link plans to investment decisions, and align their goals and objectives across these processes to achieve national performance targets. 138
153 5.6 Agency Lessons on Adaptiveness in Facing an Autonomous Vehicle Future: Responding to the Needs and Future Demands State departments of transportation are presented with new challenges and large uncertainties in the years ahead, based on rapid advances in vehicle technologies, cloudbased communication systems, transportation network company service provision, and the potential for new technologies to be highly disruptive in impacting traveler behavior and the levels of interaction between transportation modes. While limited research was undertaken to examine the full extent of roles that agencies have played thus far in this uncertain space, it is clear that few agencies have even made mention of autonomous vehicles as being a potential disruptor in their current plans. In examining project evaluation processes as part of this research, it became evident that it is still too early for agencies to find ways to prioritize investments to address an uncertain future of autonomous vehicles operating on the nation s roads. Virginia is the one state agency in this research where point allocations were found for capital improvement projects that include connected vehicle technologies (it is assigned a scoring value under Connected Vehicle System integration in their economic development score of ED.3) (VDOT SMART SCALE Technical Guide, 2016, pg. 80). The scoring point value is not significant, but over time the weighting towards this factor criteria area can increase. States will likely need to be adaptive when it comes to integrating new technologies over time. Low-hanging fruit in terms of Intelligent Transportation System (ITS) investments at intersections is a far more cost-effective way to address congestion and ensure future system reliability and performance, with lower costs involved than from 139
154 increasing capacity and purchasing additional right-of-way (Meyer & Miller, 2014). For instance, UDOT s policies set forth that capacity improvements are only considered after all other mobility options are exhausted, in terms of ITS, TDM, and other strategies considered (UDOT, 2013). For Virginia, SMART SCALE is not explicit with respect to developing new capacity versus utilizing existing capacity for projects involving congestion improvements. However, given the cost-effectiveness criteria used to calculate final project scores for capital improvements, a project that enhances mobility through improved corridor coordination of signal timing and achieves similar reductions in delay as more expensive solutions to congestion challenges will likely be ranked as a higher priority. These kinds of approaches are those that translate to being prepared for a highly uncertain future where transportation demands may change significantly. Autonomous vehicles are likely to fully operate within the bounds of existing infrastructure, and thus they can only improve roadway congestion based on their ability to interact more smoothly with other travelers and with the infrastructure itself. Investing in more operational improvements, for instance using synchronized and actuated signal timings, may significantly benefit AVs and their ability to move freely within a more connected and efficiently-operated transportation system. Vehicle-to-vehicle (V2V), vehicle-to-infrastructure (V2I), and vehicle-to-everything (V2X) communication systems will likely help to accommodate future travel demands and achieve new levels of transportation system performance. However, agencies must find pathways forward that allow them to adapt and implement some of the infrastructure-based technologies to improve performance over time. Federal Guidance on Autonomous Vehicles recommends that states work together to standardize and maintain road infrastructure including signs, 140
155 traffic signals and lights, and pavement markings. This will support the safe operation of highly autonomous vehicles and ensure that the safety of human drivers is also met (NHTSA, 2016). The 2015 FHWA Vehicle to Infrastructure Deployment Guidance and Products (2014) recommends that states begin considering V2I strategies in their long-range planning efforts. Autonomous vehicle (AV) technologies are expected to arrive to the market in parallel with CV technologies, and thus agencies need to consider both vehicle technologies together. Given that autonomous vehicle technologies will be handled mainly by the automakers and private industry, agencies have a much more active role in addressing the connections piece, and the degree that the infrastructure can communicate with vehicles using state and local roads (FHWA, 2015). CV technologies are expected to appear first in vehicles (V2V) rather than on the infrastructure side (V2I), but for agencies the value for them rests largely with their use of V2I applications on the pieces of infrastructure that they manage. Many of the touted benefits of AVs are in regards to congestion and safety impacts, which both factor in heavily towards national performance goals. The full-range of benefits associated with the automated driving capabilities is tied with V2V and V2I communication in place (Eno Center for Transportation, 2013). While V2V applications typically require high market penetration rates before the noted benefits begin to accrue, V2I applications can benefit all properly-equipped vehicles even with having lower penetration rates - as long as the supporting roadside infrastructure is in place to communicate with connected vehicles (FHWA, 2015). Expenditures for V2I roadside infrastructure will not be justifiable until there are a significant number of CV-enabled 141
156 vehicles that would benefit from those installations. However, agencies can start to prioritize V2I technology deployments in areas where they believe their use will have the largest impact. Further evaluation of technological impacts, and what it means for state transportation agencies, should be studied in future research in relation to evaluating performance and linking prioritization processes to performance goals and objective areas. Some of the strategies referred to in these case studies lays the groundwork for future evaluation to take place on how technological disruptions can be accounted for in performance-based planning and programming (PBPP) and how multi-objective decision analysis can be used as a framework in maximizing value and minimizing risk. Prioritizing the right kind of projects for the transportation system to meet future needs and demands is a value that is shared by all states. Over time, states that employ strategic approaches like those enacted recently will find that their transportation plans, programs, and operations are more able to address the uncertainties and risks that lie ahead for state transportation agencies. The Federal Highway Administration will likely need to continue the partnership with state transportation agencies to ensure the alignment of national performance goals with agency approaches. With large uncertainty in the years ahead, this complementary partnership can help smooth the transition towards a rapidly changing transportation future. New technologies and transportation demands are reshaping the way the transportation system operates, and strategic focuses and new thinking can help to smooth this transition over time. The need to balance investments in mobility with preserving and 142
157 taking care of what infrastructure is already there will remain a continued challenge. This is one area in which states can share experiences and learn from each other to advance practices that are better at simultaneously addressing meeting existing transportation demands while also responding to future needs. As states revamp their processes to become more performance-based, it will be increasingly important for the USDOT to acknowledge positive state actions and potentially reward high-performing states to encourage others to follow their examples. 143
158 CHAPTER 6. PIECING TOGETHER THE FUTURE FOR CAPITAL IMPROVEMENT PERFORMANCE EVALUATION States can promote greater alignment between planning and programming in the use of performance-based approaches that allow project funding decisions to be scored or assessed and prioritized in a manner that helps the agencies achieve their stated planning goals. States are increasingly looking towards their internal prioritization and evaluation methods to promote this alignment. Many states have grown interested in methods of decision analysis where projects are scored through more quantitative, data-driven, multiobjective measurement tools. Since the passage of the Intermodal Surface Transportation Efficiency Act (ISTEA) in 1991, federal policy has encouraged states to expand their focuses on managing the transportation system through the use of expanded collaborative processes. Since MAP-21 legislation in 2012, performance rulemakings have created requirements for state transportation agencies to align national performance requirements with state processes in planning and programming (FHWA, 2016b). Based upon the case studies of four state DOT approaches that involve the use of prioritization criteria for prioritizing capital improvements, either for specific modes or in using multimodal and/or mode-neutral emphases in approaches, it is clear that decision science applications (particularly multi-objective decision analysis) can serve as a very useful tool for developing objective-driven approaches to project selection. Decision science applications examine tradeoffs in an objective manner, and where decision makers can advise the process efficiency elements over project evaluation, and use data to justify allocation decisions over which projects to fully-fund before programming the STIP (Maggiore & Ford, 2015). Project evaluation processes 144
159 promote desired outcomes when projects are (1) evaluated consistently against scoring criteria that is reflective of their expected performance impacts and (2) scoring criteria promote alignment with an agency s goals and objectives (Radnor & Barnes, 2007; Griffin & McGuire, 2016) The results of the survey implemented for this thesis revealed that a substantial number of states lack quantitative cost-effectiveness evaluations of projects before they are programmed. That said, states have improved from 2010, where an earlier GAO (2010) report recognized the lack of quantitative-driven prioritization approaches as reason for requiring states to adopt performance-based approaches. Some states continue to only evaluate cost-effectiveness or benefit-cost analysis for specific project types, or for specific funding programs. More consistency in use of formal evaluation methods using cost-effectiveness analyses to evaluate projects would help states to better optimize investment allocations and evaluate tradeoffs more objectively and transparently. Capital improvement project evaluation is enormously important for agencies, given that new capital improvement projects will become the system preservation projects of the future. There needs to be clear understanding as to the value and tradeoffs of undertaking capital projects prior to their being funded. While many states rely on their long-range plan to prioritize their needs, in many instances their needs may not correspond to their project lists. For instance, the Commonwealth of Virginia realized that they needed a much more intentional approach towards evaluating projects, because the existing process was not working. The state needed to encourage new ways of thinking over addressing safety, congestion, access challenges, and allow for collaborative decisions to take place across each of the VDOT Districts. This new process 145
160 would improve performance in the transportation system by having project sponsors focus on the best ways to address local and regional needs through project applications (Donohue, 2017). Utah DOT has taken on a similar data-driven approach, but their capital project evaluation Decision Support System is unable to compare across asset categories, which is a problem that a majority of state DOTs face. UDOT is looking to emphasize more of a cross-modal prioritization approach, but the agency is not yet there in terms of finding a suitable approach. For the time being, UDOT subscribes to Decision Lens software, which allows UDOT to see the performance impacts of different funding allocations and projects supported. UDOT is currently evaluating the use of Decision Lens in helping them make more strategic decisions in terms of funding. Utah Transportation Commission continues to have the ultimate say over the final list of projects funded through the STIP (UDOT, 2013). Some states may see an entirely data-driven, objective approach as one that is too resource intensive to implement, and may look to other approaches. The Oregon DOT case study focused on how ODOT is able to use qualitative evaluation techniques to provide similar value as a more data involved process in aligning their investment decisions with their agency goals. ODOT uses a MODA approach with a large qualitative emphasis in the planning stage before programming capital enhancements. Through their Enhance process, ODOT requires project sponsors to complete project narratives describing their achievement of objectives, which agency staff review (ODOT, 2015). ODOT has chosen to develop their STIP in a less stove-piped way by examining new system needs, which they refer to as Enhance projects all together, and all preservation needs as Fix-It projects (ODOT, 2017). Reducing the complexity of different federal 146
161 funding sources by breaking project funding down into a more simplistic set of categories can improve outcomes by eliminating stove-piped processes. Simplifying these processes introduces increased need for transparency and peer review (through quality analysis and quality control) to prevent any significant biases from forming. Other states are legacy driven and, thus, they may be looking for ways to innovate within programs. For those agencies, programs like Maine DOT s (2017b) Industrial Rail Access Program is one that can be created in their internal divisions to further their strategic efforts in freight management without wholly reinventing their existing decision-making processes. Many states are recognizing their freight planning needs to a much greater degree because of the FAST Act s creation of the National Highway Freight Program (NHFP) and the INFRA, (formerly FASTLANE Grants) program (FHWA, 2016a; Government Publishing Office, 2017). Intermodal funding constraints continue to plague many agencies, but many of them can tap into smaller sources of general revenues when large benefits can be realized by improving intermodal freight movements, in indirect ways that may include reduced highway maintenance, vehicle and truck delay. States also may benefit from creating freight programs that generate more private-sector freight involvement, which is emphasized in the USDOT INFRA program s scoring for competitively funding nationally and regional-significant freight projects. Many states are in an interim period, a finding from the survey. MAP-21 s national performance goals were only recently translated into target areas, which were finalized in early 2017, and the survey confirms that states are currently examining their internal processes to ensure they can meet or exceed the objectives of the national 147
162 transportation performance final rules. During this interim period, agencies are assessing their data needs to ensure they can measure their own performance, and they also need to demonstrate how their state investments translate into achieving performance targets. Planning and programming-based linkages are not clearly defined in many state decisionmaking processes, and without this clear linkage it weakens the effectiveness of a performance-based emphasis. Many states have largely kept separate their planning and programming divisions; and with a lack of high-level direction in agency departments to ensure coordination between plans and programs, it has led to disjointed outcomes. Evaluative criteria for choosing transportation projects on the capital improvement and planning side are important to tie directly with state and national performance goals and state objectives. Objectives that are derived from goal areas should tie directly to the criteria used to prioritize projects, before the STIP is programmed. From this research, Multi-Objective Decision Analysis (MODA) and the Simple Multi-Attribute Rating Technique (SMART 2 ) may have significant value in helping agencies align six of the seven national performance goals with their evaluation criteria. From the state case studies in this research on Oregon, Maine, Utah, and Virginia, several criterion are suggested for use in evaluating projects prior to their funding. The illustration in Figure 38 displays how states can link national goals and objectives to the project evaluation criteria that states use in ranking or prioritizing project lists for being programmed into the STIP. The survey results confirmed that multimodal accessibility and intermodal connections were of increasing interest and use by the vast majority of the 35 state transportation agencies participating in the survey. 54 percent of state survey respondents 148
163 indicated greater interest or use in measuring multimodal accessibility, while 40 percent expressed no change in interest, and only 5 percent indicated less interest. Only two other measure areas had more net-positive expressions of interest: cost-effectiveness and economic development. Both the survey results and the case study analysis indicate there may be a need to better address access to employment and other vital destinations, while also emphasizing multimodal connections. Given the vast interest nationally by state DOTs, System Accessibility as a new national performance goal area can be considered in future transportation legislation for inclusion. Equitable access for disadvantaged populations can be part of this measure. GIS tools are available to allow project-based analyses to be undertaken to quantify the net effects that highway and transit improvements have on job access (McCahill, 2016). Access to jobs was found in the agency literature, however access to critical services and other destinations may be a further way to analyze the impacts that projects have on improving connections. To analyze project-level impacts across all national performance goal areas referred to from MAP-21 legislation, this research recommends evaluative criteria predominately from the case studies and also from the literature and additional agency practices that were reviewed. The evaluative criteria recommended address six of the seven national performance goals from MAP-21 (Reduced Project Delivery Delay relates to the later procurement stage of a project). As well, an additional performance goal area recommended by the survey findings and by the agency review of practices is included, for a total of seven categories of objective evaluative criteria to guide capital improvement project prioritization: 149
164 I. Safety: S-EV.1 Reduction in Fatal and Severe Crash Rates (using CMFs) II. Infrastructure Condition: I-EV.1 Lifespan Reached, I-EV.2 Criticality, I-EV.3 Pavement/Bridge Condition; I-EV.4 AADT III. Congestion Reduction: C-EV1 Total Person Hours of Delay IV. System Reliability: R-EV.1 Change in Person Throughput; R-EV.2 Travel Time Reliability Improvement V. System Accessibility: A-EV.1 Increased Access to Jobs/ Critical Services; A-EV.2 Improved Access to Multimodal Choices VI. Freight Movement and Economic Vitality: F-EV.1 Ton-Mile Movement; F-EV.2 Intermodal Access; F-EV.3 Economic Development Support VII. Environmental Sustainability: E-EV.1 Air Quality/GHG Emissions Impact; E-EV.2 Acres of Environmentally-Sensitive Land Impacted; E-EV.3 Transportation-Efficient Land Use The evaluative criteria above is merely suggestive, but is connected to the review of practices in place by select agencies. Portions of measures S-EV, C-EV, R-EV, A-EV, and E-EV are emphasized based on the SMART SCALE standards used by the Commonwealth of Virginia. Portions of measures I-EV and F-EV.1, 3 is recommended based on UDOT s capital improvement approaches and other asset management emphases. Additionally, portions of measures S-EV, A-EV, and E-EV are emphasized based on ODOT s Mosaic Tool and certain Enhance qualitative criteria. The use of evaluative criteria, like the ones listed, provide a way for agencies to align performance goals with project evaluation metrics. 150
165 Based on the survey, certain goal areas are not as well considered in the evaluation approaches by many agencies. Over time, project lists can better align with the full-set of performance goals emphasized through Federal legislation through use of project evaluative measures that tie to these goal areas. States largely lack multimodalbased metrics for evaluating congestion reduction and system reliability goals. Many states are also less experienced with freight planning, and particularly in linking planning with programming in addressing where intermodal access improvements may be most needed, and also in regards to supporting economic development. Environmental goals were shown by the survey developed in this research as the least evaluated area at the project evaluation stage. States are more likely to examine and address environmental impacts after projects are funded, rather than pre-examining those impacts. On air quality and greenhouse gas emissions, states have large differences in views over addressing these challenges, but overall states surveyed are more interested than disinterested in addressing air quality and greenhouse gas emissions impact at the project evaluation stage, as shown earlier in Figure
 section of the Federal Register, the final performance measure rule on system performance instructs states to measure the percentage of person miles traveled on the national highway system")
166 Figure 38 Linking National Performance Goal Areas to State-Based Project Evaluation Processes Based upon the Code of Federal Regulations part (a) section of the Federal Register, the final performance measure rule on system performance instructs states to measure the percentage of person miles traveled on the national highway system that are reliable. As well, under the CMAQ program area, states must report to FHWA excessive delay in the peak hour, in terms of total person-hours of excessive delay (GPO, 2017). 152
167 Many states will need to update their current practices to reflect performance measurement area emphases, particularly for the System Reliability and Congestion Mitigation national goal areas. The vast majority of state transportation agencies are not measuring delay and throughput based on person-based metrics, as the final rule requires states to measure. Instead, most states indicated through the survey that they do not have multimodal congestion-based indicators, and instead calculate vehicle-based throughput and delay metrics for their project-level analyses. States that develop planning goals and objectives that include multi-modal options, may need to consider developing performance evaluation standards that strive to assess project-level costs and benefits via mode-neutral evaluation approaches, as much as the data allows. As transportation demands change, performance measures that focus on person movement, rather than vehicle movement, can be employed. Virginia DOT measures both person throughput and person hours of delay through a mode-neutral lens for both roadway and transit investments in SMART SCALE s two congestion mitigation measures. Transit projects can go through the same prioritization process for capital improvements as road projects. These two types of projects are simultaneously evaluated by their effectiveness in reducing congestion, when volume over capacity ratios of 0.95 are exceeded in the project area. Projects are assessed based on the potential to increase the number of users served in the peak period and the potential of reducing peak period delay along the corridor segments improved (VDOT, 2016b). In multi-modal assessment, measurement of person throughput and person delay will become increasingly important, especially as the network transforms to include greater shares of automated vehicle activity and transportation network company services. It will 153
168 also be important to assess the impacts of zero-occupant vehicle trips as automated vehicle activity starts to occur. New vehicle technologies are also expected to change traveler behavior, but the estimates vary widely. These trends will inform congestion mitigation strategies, which will be particularly impactful in congested metropolitan regions where road space is limited. With increased integration of fully autonomous vehicles, there will be need to revisit metrics, particularly in light of the uncertainty associated with assessing the impacts of new technologies in state DOT long-range plans, programming, and traffic operations. Multimodal evaluation criteria are likely to continue to be of interest and of increasing necessity. The changing nature of the transportation system, as outlined above, also supports the development of new accessibility measures for states that wish to make their transportation systems more connected, integrated, and reliable. Agencies that assess project accessibility improvements can better prioritize those projects that establish critical links. In a network level analysis, certain road, transit, and other modal improvements will go much further in improving the connectivity at an important trip link, such as a multimodal transfer center or intermodal freight hub, in promoting ease of ingress and egress to areas of large regional impact. Such a finding could be lost in traditional analysis using mobility-based measures. Federal programs could also be realigned to better support state s progress towards developing more strategic, multimodal, and performance and outcome-based approaches. Federal programs remain largely restrictive when it comes to project types and the use of mainly formula-based funds. States wishing to be more strategic have to work within the current constraints of Federal funding programs. As indicated in the survey, more states 154
169 would like to see NHFP funding opened up, instead of the current restriction of 10-percent of funding for non-highway freight needs, without regards to states differing needs in supporting freight movement. States also identify that Federal funding support is currently insufficient to meet their multi-modal planning and assessment needs. States appear to be looking for more support in the assessment and implementation of intermodal and multimodal projects, and even more routine non-nhs road projects. The only current multimodal and multi-state jurisdictional funding source at the Federal level is the TIGER Discretionary Grants program (USDOT, 2017). Formula funds comprise a much greater amount of the funding, but lack the necessary flexibility. Hence, states are in the position of applying for very limited TIGER funding to obtain the level of funding flexibility that they need and cannot obtain through formula funds. Surface Transportation Block Grant funds is arguably the most flexible formula funding source, but the survey indicates that most funds are used for traditional types of projects. Formula funds comprise most of the transportation funding that states receive from the Federal Government (FHWA, 2016c; USDOT, 2017), but these funds offer far less incentive for states to enhance performance, ensure infrastructure quality, and address safety goals than the use of competitive funds or formula funds that are tied to states making substantial progress or evidencing long-term strategic investment decisions. One challenge of relying so heavily on formula funds may be that states tend to focus on using their traditional processes at a time when performance-based processes are the ones being sought at the Federal level. Formula funds, while flexible, are only 155
170 effective when projects comprise the highest and best use of those funds. When that is not the case, system performance can be negatively impacted. The State of Virginia learned this lesson with their own state funds. When they allocated funding to localities based on formula, projects were often delayed because of partial funding and gaps in funding (Donohue, 2017). The lack of a comprehensive prioritization emphasis did not allow the state to discern which projects were the most important and ensure that these projects were fully-funded. Through SMART SCALE, the Commonwealth of Virginia will only commit to fund projects that they have full funding. The Commonwealth of Virginia has incentivized local jurisdictions and regional counterparts to work together to reduce project costs, particularly for the state portion, to produce more cost-effective types of projects for their region and ensure more projects are funded, with having higher transportation priorities addressed. The approach that the Commonwealth of Virginia has taken in developing SMART SCALE can have larger implications at a broader scale. Federal funding through use of formula funds or other alternative means of funding can include incentive-based structures, and encourage states to discern their needs in a more objective accounting of project benefits and costs. In addition to existing Federal funding through TIGER, INFRA, and other programs, a new Federal program that similarly uses objective-based criteria, but with a more mode-neutral emphasis like SMART SCALE, could generate further interest for states to create approaches that incentivize their own states to collaborate with other DOTs and neighboring MPOs on their infrastructure priorities, in addressing many of the overlooked multi-jurisdictional transportation needs that hang in the balance simply over their geographic divide. 156
171 Based mainly on the case study analysis, but also agency review, the following overall recommendations are presented specifically for state DOTs in implementing new project evaluation processes. The findings in this research can be summarized into four overall suggestions for state DOTs to consider: 1. Enhance the planning and programming linkage by instituting a formal evaluation process, with consistent sets of criteria used that demonstrate a project s value, before projects can be included in the STIP. Encourage transparency and peer review in this process to reduce the potential for bias. 2. Utilize project scoring criteria that can be well understood, link to agency goals, and assess a project s need and potential impact; while ensuring project scoring reflects cost-effectiveness in prioritizing projects. 3. Coordinate the prioritization process with regional counterparts (MPOs, RPOs, etc.), and obtain the buy-in from local jurisdictions. 4. Ensure project scores are used to improve allocation decisions, and that the best-available, most current data is used to make decisions, to the maximum extent feasible. 157
172 APPENDIX A. NATIONWIDE SURVEY OF PERFORMANCE PRIORIZATION AND EVALUATION PROCESSES 158
173 159
174 160
175 161
176 162
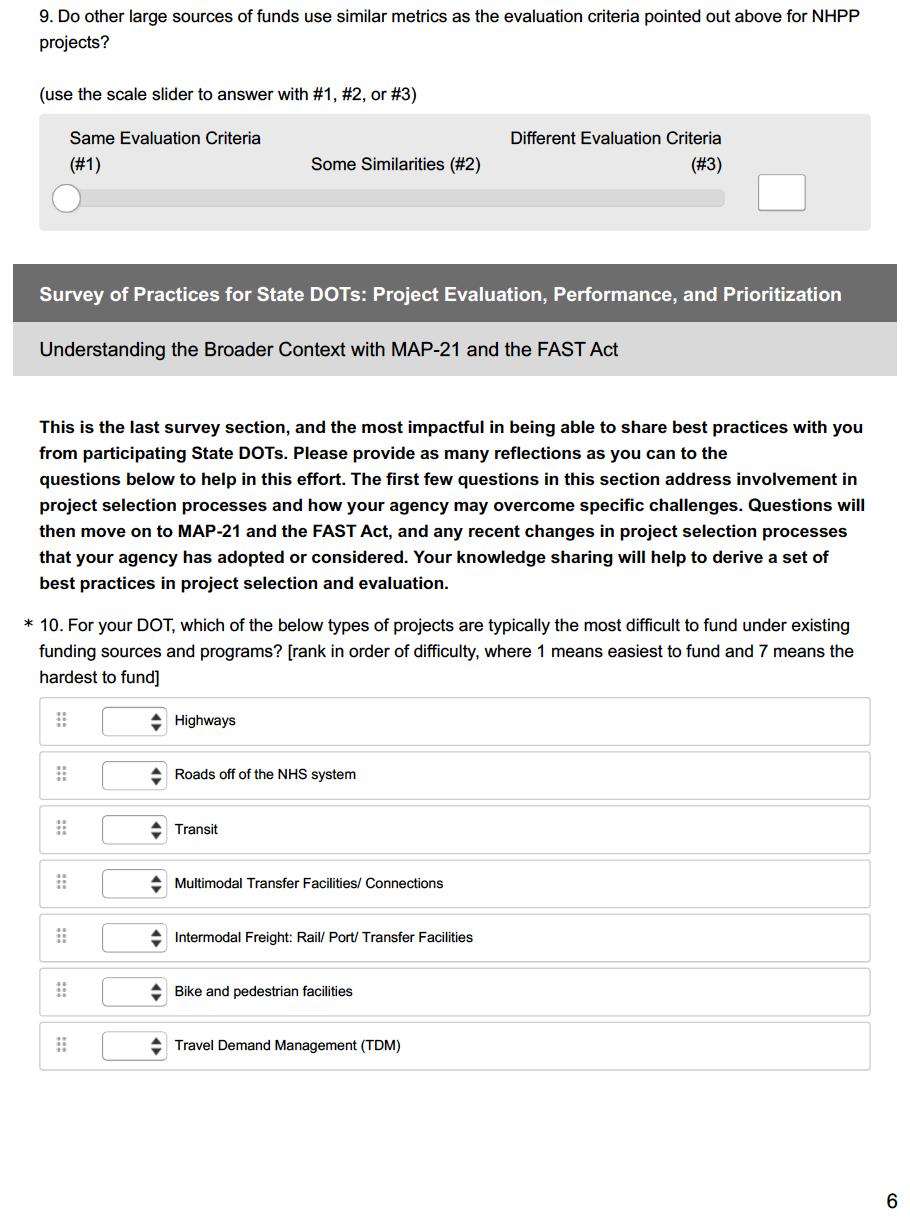
177 163
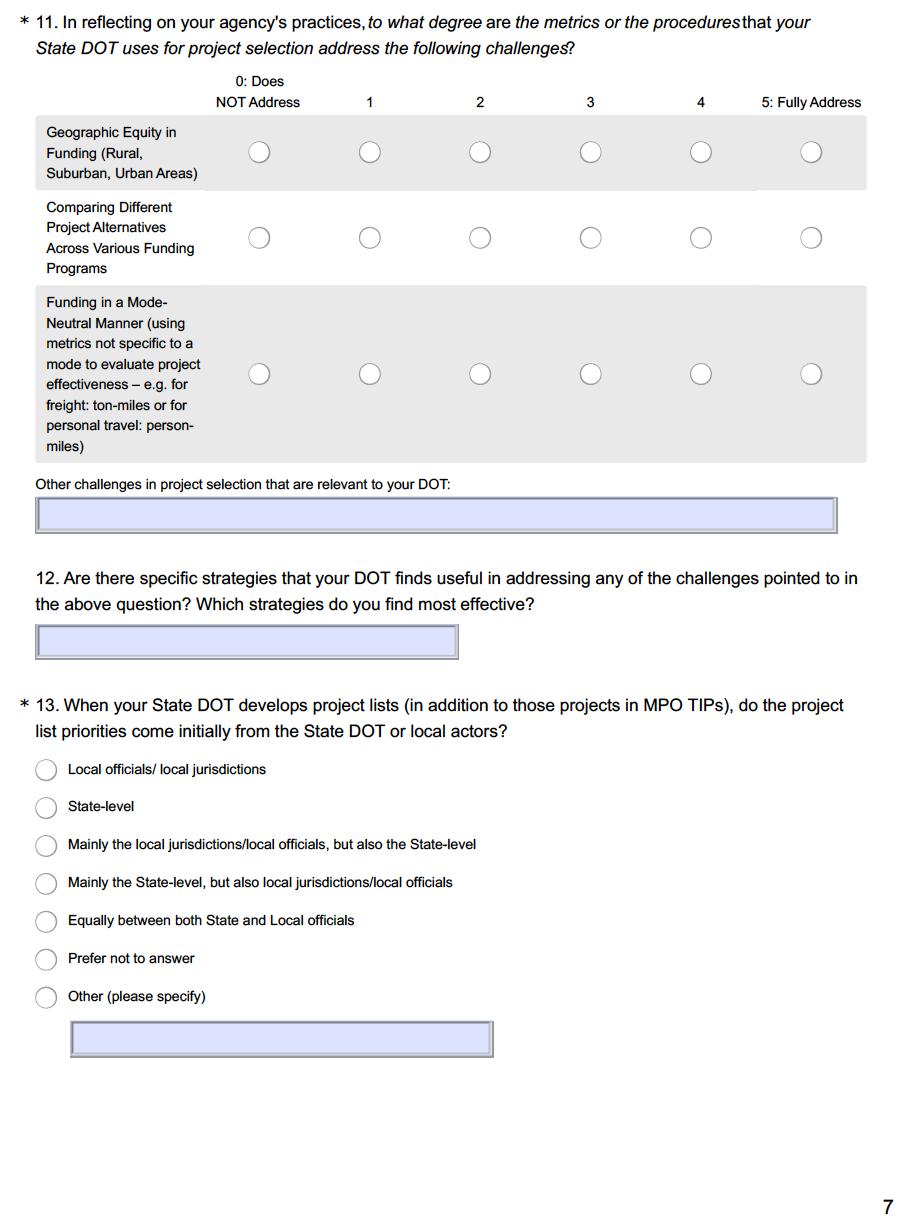
178 164
179 165
180 166
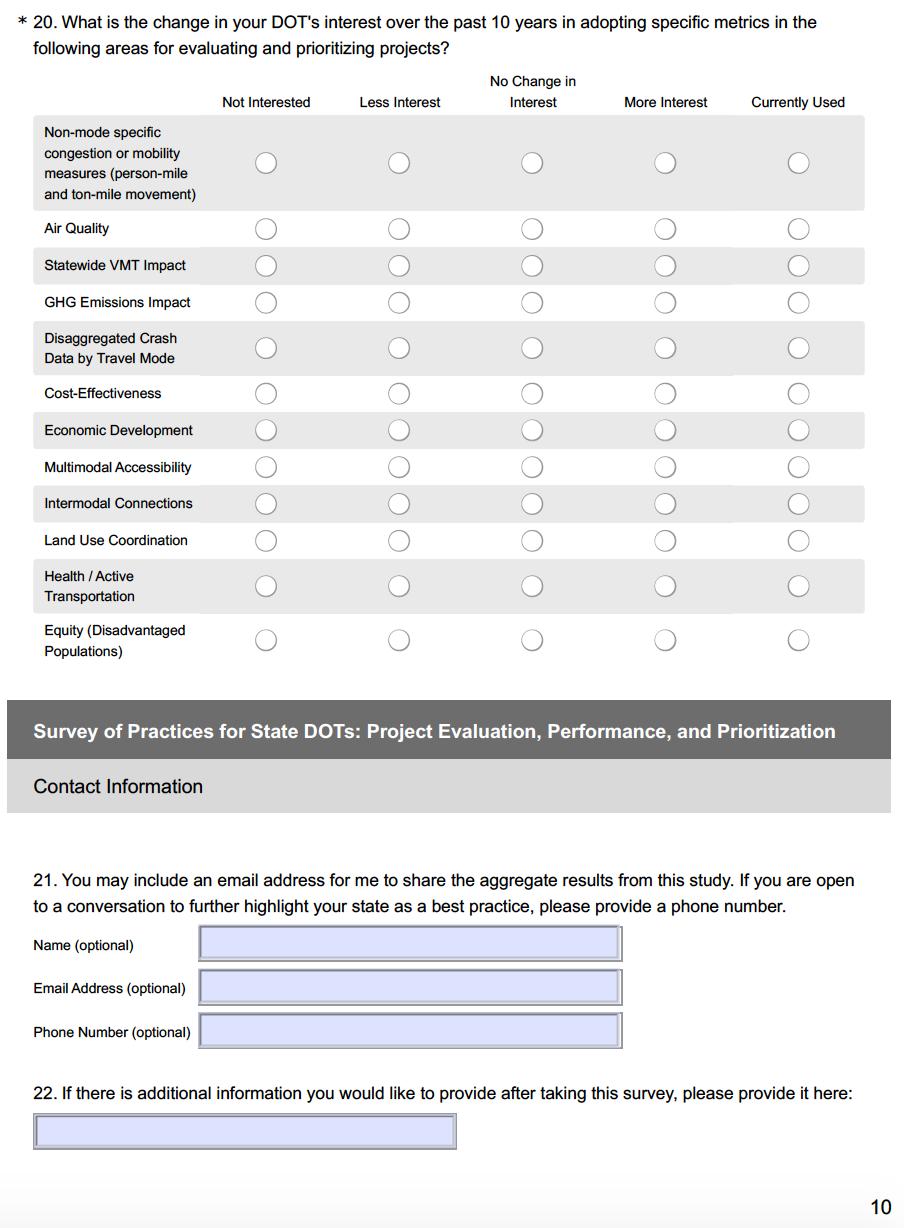
181 167
 PROJECT")
182 APPENDIX B. UTAH CODE ( ) PROJECT PRIORITIZATION PROCESS REQUIREMENTS 168

183 APPENDIX C. UDOT POLICY PROJECT PRIORITIZATION PROCESS (UDOT 07-10) 169
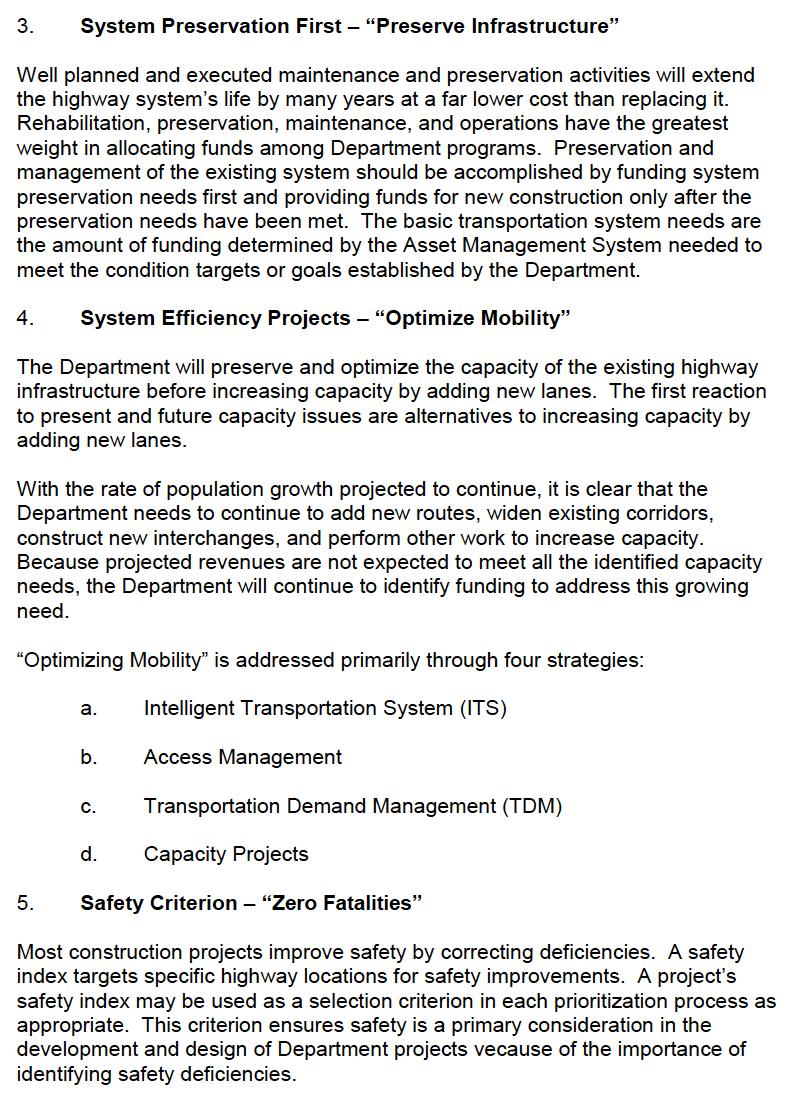
184 170
185 171
186 172
187 APPENDIX D. SMART SCALE E.1 AIR QUALITY AND ENVIRONMENTAL EFFECT MEASURE 173

188 APPENDIX E. VDOT PROJECT SCORECARD EXAMPLE SMART SCALE PROJECT EVALUATION Source: 174
PERFORMANCE-BASED PLANNING AND PROGRAMMING
 February 2017 performance-based planning and programming Boston Region MPO PERFORMANCE-BASED PLANNING AND PROGRAMMING WHAT IS PERFORMANCE-BASED PLANNING AND PROGRAMMING? Performance-based planning and
PERFORMANCE-BASED PLANNING AND PROGRAMMING
 February 2017 performance-based planning and programming Boston Region MPO PERFORMANCE-BASED PLANNING AND PROGRAMMING WHAT IS PERFORMANCE-BASED PLANNING AND PROGRAMMING? Performance-based planning and
PERFORMANCE-BASED PLANNING AND PROGRAMMING
 September 2018 performance-based planning and programming Boston Region Metropolitan Planning Organization: PERFORMANCE-BASED PLANNING AND PROGRAMMING WHAT IS PERFORMANCE-BASED PLANNING AND PROGRAMMING?
Addendum 1: Performance Measures
 Addendum 1: 2 Addendum Livability 2040 Regional Transportation Plan Table of Contents 1.0 Introduction... 3 Federal Requirements... 3 MPO Measure Targets... 4 2.0 Safety Measure Targets... 9 3.0 Transit
IDOT PERFORMANCE BASED PROJECT METRICS. February 2018
 IDOT PERFORMANCE BASED PROJECT METRICS February 2018 March 5, 2018 2 What is Performance Management? Performance Management of the Federal Highway Program is a systematic approach to making investment
FHWA TPM Framework and Capability Maturity Model (CMM)
") TPM Workshop FHWA TPM Framework and Capability Maturity Model (CMM) Philadelphia, PA November 29 & 30, 2017 Why TPM? 2 Rulemakings TPM-Related Rules Rule Effective Date Regulatory Chapter Safety Performance
TPM Workshop FHWA TPM Framework and Capability Maturity Model (CMM) Philadelphia, PA November 29 & 30, 2017 Why TPM? 2 Rulemakings TPM-Related Rules Rule Effective Date Regulatory Chapter Safety Performance
2040 Addendum Performance-Based Planning November 2018
 2040 Long Range Transportation Plan 2040 Addendum Performance-Based Planning November 2018 Adopted June 13, 2018 250 S. Orange Ave, Suite 200, Orlando, FL 32801 407-481-5672 www.metroplanorlando.org MetroPlan
MONITORING IMPLEMENTATION AND PERFORMANCE
 12 MONITORING IMPLEMENTATION AND PERFORMANCE The FAST Act continues the legislation authorized under MAP-21, which created a data-driven, performance-based multimodal program to address the many challenges
CITY OF JACKSONVILLE 2030 MOBILITY PLAN STUDY UPDATE GOALS, OBJECTIVES, AND PERFORMANCE MEASURES PREPARED FOR: CITY OF JACKSONVILLE
 CITY OF JACKSONVILLE 2030 MOBILITY PLAN STUDY UPDATE GOALS, OBJECTIVES, AND PERFORMANCE MEASURES 3.20.2017 PREPARED FOR: CITY OF JACKSONVILLE 55 Railroad Row White River Junction, VT 05001 802.295.4999
2/15/2018. Metropolitan and Statewide Transportation Planning Requirements. Austin, Texas February 15, PART 1 Background
 Overview of the FAST Act Metropolitan and Statewide Transportation Planning Requirements Austin, Texas February 15, 2018 1 PART 1 Background 2 1 Applicable Laws Title 23 United States Code (Highways) Section
Moving Ahead for Progress in the 21 st Century MAP-21
 Moving Ahead for Progress in the 21 st Century MAP-21 Mark Newland Transportation Finance Manager FHWA Indiana Division Purdue Road School March 6, 2013 Agenda Review changes between SAFETEA-LU and MAP-21.
MOBILITY 2045: A FOCUS ON TRANSPORTATION CHOICE:
 Mobility 2045: The Metropolitan Transportation Plan for North Central Texas is the defining vision for the multimodal transportation system in the Dallas- Fort Worth Metropolitan Planning Area. The plan,
Addendum #3 to the Regional Transportation Plan
 Nashville Area Metropolitan Planning Organization Addendum #3 to the Regional Transportation Plan Effective November 21, 2018 Nashville Area Metropolitan Planning Organization 138 Second Avenue North Nashville,
Freight and Rail Stakeholder Webinar. January 7, 2014
 Freight and Rail Stakeholder Webinar January 7, 2014 Agenda Modal Needs Baseline Revenue Modal Scenarios Website Statewide Freight Plan Statewide Rail Plan Jeff Carroll MULTIMODAL TRANSPORTATION NEEDS
Transportation Performance Measures Safety Target-Setting
 Safety Target-Setting RRTPO Technical Advisory Committee 7/11/2017 Presentation by: Chris Wichman, Senior Transportation Planner Introduction This presentation will focus on: Statewide safety plan and
Transportation Performance Measures Safety Target-Setting
 Safety Target-Setting Richmond Regional Transportation Planning Organization November 2, 2017 Presentation by: Chris Wichman, Senior Transportation Planner Background Moving Ahead for Progress in the 21
SBCAG STAFF REPORT. MAP-21/FAST Act Performance Measures and Targets. MEETING DATE: September 20, 2018 AGENDA ITEM: 4H
 SBCAG STAFF REPORT SUBJECT: MAP-21/FAST Act Performance Measures and Targets MEETING DATE: September 20, 2018 AGENDA ITEM: 4H STAFF CONTACT: Andrew Orfila, Jared Carvalho RECOMMENDATION: Approve and accept
Summary of transportation-related goals and objectives from existing regional plans
 SMTC 2050 Long Range Transportation Plan Appendix A: Summary of transportation-related goals and objectives from existing regional plans SMTC 2050 Long Range Transportation Plan Summary of transportation-related
USDOT PERFORMANCE BASED PLANNING AND PROGRAMMING (PBPP)
") USDOT PERFORMANCE BASED PLANNING AND PROGRAMMING (PBPP) Eric Randall TPB Transportation Engineer Jane Posey TPB Transportation Engineer MWAQC TAC February 14, 2017 Agenda Item 4 Performance Based Planning
USDOT PERFORMANCE BASED PLANNING AND PROGRAMMING (PBPP) Eric Randall TPB Transportation Engineer Jane Posey TPB Transportation Engineer MWAQC TAC February 14, 2017 Agenda Item 4 Performance Based Planning
Regional Transportation and Land Use Performance Measures. July 7, 2010 Eric Stringfield Director of Transportation and Land Use
 Regional Transportation and Land Use Performance Measures July 7, 2010 Eric Stringfield Director of Transportation and Land Use Transportation and Land Use Coordination Foundation: Traffic Impact Analysis
Introduction. Performance Measurement. Pg. 01
 Pg. 01 Introduction The Alamo Area recognizes the importance of transportation performance tracking, goal setting and measurement to provide greater accountability and transparency and to achieve a more
Appendix O Congestion Management Program REGIONAL TRANSPORTATION PLAN/SUSTAINABLE COMMUNITIES STRATEGY
 Appendix O Congestion Management Program REGIONAL TRANSPORTATION PLAN/SUSTAINABLE COMMUNITIES STRATEGY 2014 REGIONAL CONGESTION MANAGEMENT PROGRAM 2014 RTP/SCS APPENDIX O SAN JOAQUIN COUNCIL OF GOVERNMENTS
TTAC STAFF REPORT. State Targets for the MAP-21/FAST Act National Highway Performance Program. MEETING DATE: August 2, 2018 AGENDA ITEM: 5
 TTAC STAFF REPORT SUBJECT: State Targets for the MAP-21/FAST Act National Highway Performance Program MEETING DATE: August 2, 2018 AGENDA ITEM: 5 STAFF CONTACT: Andrew Orfila, Jared Carvalho RECOMMENDATION:
Performance Measures
 Performance Measures PERFORMANCE MEASURES Under the previous transportation act Moving Ahead for Progress in the 21 st Century (MAP-21) and the current transportation act Fixing America s Surface Transportation
Tri-County Regional Planning Commission 2045 Regional Metropolitan Transportation Plan Goals and Objectives Adopted March 22, 2017
 Tri-County Regional Planning Commission 2045 Regional Metropolitan Transportation Plan Goals and Objectives Adopted March 22, 2017 One of the initial steps in the development of the TCRPC 2045 Metropolitan
Performance Measures National Best Practices Spencer Stevens MI Transportation Planning Association August 8, 2014
 Performance Measures National Best Practices Spencer Stevens MI Transportation Planning Association August 8, 2014 Overview of Performance Management Broad consensus that performance management is important
Overview of Changes Made to CMAQ & System Performance Measures. Presented by: Jason Pavluchuk Association for Commuter Transportation
 Overview of Changes Made to CMAQ & System Performance Measures Presented by: Jason Pavluchuk Association for Commuter Transportation Agenda CMAQ Overview Changes Made by FAST ACT 2013 Guidance Performance
TRANSPORTATION PERFORMANCE MANAGEMENT Asset Management and Pavement Performance Measures The 30, mile view.
 TRANSPORTATION PERFORMANCE MANAGEMENT Asset Management and Pavement Performance Measures The 30,000 250 mile view. 1 Transportation Performance Management 2 2 Transportation Performance Management (TPM)
RESOLUTION NO
 RESOLUTION NO. 2018-12 RESOLUTION OF THE SOUTHEASTERN WISCONSIN REGIONAL PLANNING COMMISSION AMENDING THE TRANSPORTATION IMPROVEMENT PROGRAM FOR SOUTHEASTERN WISCONSIN: 2017-2020 WHEREAS, the Southeastern
Moving Ahead for Progress in the 21 st Century Act (MAP-21) And Beyond
 And Beyond") Moving Ahead for Progress in the 21 st Century Act (MAP-21) And Beyond Janet Oakley Director of Director of American Association of State Highway and Transportation Officials MAP-21Key highlights Funding
Moving Ahead for Progress in the 21 st Century Act (MAP-21) And Beyond Janet Oakley Director of Director of American Association of State Highway and Transportation Officials MAP-21Key highlights Funding
GUIDING PRINCIPLES MEMORANDUM
 M E T R O P O L I TAN TRA NS P O RTATI O N PLAN GUIDING PRINCIPLES MEMORANDUM El Paso Metropolitan Planning Organization INTRODUCTION The guiding principles for development of the El Paso MPO s Destino
Transportation Improvement Program (TIP) Relationship to 2040 Metropolitan Transportation Plan (MTP) - Goals and Performance Measures
 Relationship to 2040 Metropolitan Transportation Plan (MTP) - Goals and Performance Measures") Mid-Region Metropolitan Planning Organization Mid-Region Council of Governments 809 Copper Avenue NW Albuquerque, New Mexico 87102 (505) 247-1750-tel. (505) 247-1753-fax www.mrcog-nm.gov Transportation
Mid-Region Metropolitan Planning Organization Mid-Region Council of Governments 809 Copper Avenue NW Albuquerque, New Mexico 87102 (505) 247-1750-tel. (505) 247-1753-fax www.mrcog-nm.gov Transportation
APPENDIX A PLANNING PROCESS FOR RURAL AREAS OF THE STATE
 APPENDIX A PLANNING PROCESS FOR RURAL AREAS OF THE STATE Background SCDOT Statewide Transportation Planning Process Consultation Cooperation with Local Officials in Non-Metropolitan (Rural) Areas SCDOT
MAP 21 Freight Provisions and Seaports
 MAP 21 Freight Provisions and Seaports September 20, 2012 American Association of Port Authorities 703.684.5700 www.aapa-ports.org 3 New Freight Eligibility in Core Highway Formula Programs Surface Transportation
Implementation of Transportation Performance Management Title Program Subtitle
 Implementation of Transportation Performance Management Title Program Subtitle Meeting Date January 19, 2017 Office Arizona of Transportation Rural Summit The MAP 21 Charge (23 USC 150(a) Declaration of
congestion management process
 congestion management process c o r p u s c h r i s t i m e t r o p o l i t a n p l a n n i n g o r g a n i z a t i o n Corpus Christi Metropolitan Planning Organization 602 N. Staples Street, Suite 300
P.L Fixing America s Surface Transportation (FAST) Act
 Act") P.L. 114-94 Fixing America s Surface Transportation (FAST) Act Key Highway Provisions and Freight Provisions Dan Walston Transportation Planner FHWA PA Division 2 FAST Act Signed by President Obama on
P.L. 114-94 Fixing America s Surface Transportation (FAST) Act Key Highway Provisions and Freight Provisions Dan Walston Transportation Planner FHWA PA Division 2 FAST Act Signed by President Obama on
PURPOSE OF THE TRANSPORTATION IMPROVEMENT PROGRAM (TIP)
") INTRODUCTION PURPOSE OF THE TRANSPORTATION IMPROVEMENT PROGRAM (TIP) The Transportation Improvement program (TIP) is a staged, four-year program of projects proposed for funding by federal, State, and
INTRODUCTION PURPOSE OF THE TRANSPORTATION IMPROVEMENT PROGRAM (TIP) The Transportation Improvement program (TIP) is a staged, four-year program of projects proposed for funding by federal, State, and
Chapter 10 Goals, Objectives + Policies
 Chapter 10 Goals, + Policies Warehouse on Nestle Way near I-78 114 115 10.1 ESTABLISHMENT OF CONSISTENT GOALS 10.2 NATIONAL FREIGHT GOALS The Lehigh Valley s freight transportation investment decisions
CHAPTER 2. VISION, GOALS AND MTP FRAMEWORK
 CHAPTER 2. VISION, GOALS AND MTP FRAMEWORK MTP VISION In order to create a framework for the 2040 Metropolitan Transportation Plan (MTP), a vision statement was drafted by the Vision/Goals Committee and
Chapter IX Regional Performance
 Chapter IX Regional Performance In recent years, performance-based planning and project programming have increasingly been employed by the North Central Texas Council of Governments (NCTCOG) in the development
Rapid City Area Metropolitan Planning Organization OPERATIONS PLAN
 Rapid City Area Metropolitan Planning Organization OPERATIONS PLAN Prepared for the Rapid City Area Metropolitan Planning Organization Endorsed by the Executive Policy Committee of the Rapid City Area
Appendix E. Congestion Management Process. Congestion Management Process
 November 2017 Appendix E Congestion Management Process Maintenance of a Congestion Management Process (CMP) is a requirement for all Metropolitan Planning Organizations (MPOs) in Transportation Management
20-Year State Highway Investment Plan. Appendix C ACRONYMS AND GLOSSARY APPENDIX C ACRONYMS AND GLOSSARY PAGE C-1
 20-Year State Highway Investment Plan Appendix C APPENDIX C PAGE C-1 This page intentionally left blank. PAGE C-2 MINNESOTA GO 20- YEAR HIGHWAY INVESTMENT PLAN 2018-2037 Acronyms ADA APS ATM ATP BRIM CAFE
Title Subtitle. Mid-Continent Transportation Research Symposium Session 1-D, Asset Management Meeting and Performance Measures I August Date 19, 2015
 Today s Innovation, Tomorrow s Best Practice: FHWA s Notice of Proposed Rulemaking on System Performance Measures Title Subtitle Mid-Continent Transportation Research Symposium Session 1-D, Asset Management
Metropolitan Planning Organization Safety Performance Measures Fact Sheet
 Metropolitan Planning Organization Safety Fact Sheet Safety The Safety Performance Management Measures regulation supports the Highway Safety Improvement Program (HSIP) and requires State Departments of
Moving Forward 2040 Long Range Transportation Plan Bicycle Mobility Master Plan Transit Master Plan
 Moving Forward 2040 Long Range Transportation Plan Bicycle Mobility Master Plan Transit Master Plan Paul DiGiuseppe Assistant Chief, Division of Planning Department of Administration (DOA) Needed to keep
Chapter 8 - The Decision-Making Process
 Chapter 8 - The Decision-Making Process KEY POINTS One of the most important products of this Missouri State Freight Plan is a consistent process to prioritize freight investments (projects). The process
2. Guiding Principles, Objectives, and Policies
 2. Guiding Principles, Objectives, and Policies INTRODUCTION The guiding principles for the 2040 MTP Update establish the vision and key focus areas for this planning effort. They combine the guidance
HB2 Implementation Policy Guide
 report HB2 Implementation Policy Guide prepared for Commonwealth Transportation Board date August 1, 2015 Table of Contents 1.0 Introduction... 1 1.1 HB2 Legislation Requirements... 1 1.2 Roles and Responsibilities...
STATEWIDE & NONMETROPOLITAN & METROPOLITAN TRANSPORTATION PLANNING
 STATEWIDE & NONMETROPOLITAN & METROPOLITAN TRANSPORTATION PLANNING July 13, 2016 At Last a Final Rule SAFETEA-LU (Aug. 10, 2005) Previous Final Rule (Feb. 14, 2007) MAP-21 (July 6, 2012) Planning NPRM
MAP-21 themes. Strengthens America s highway and public transportation systems. Creates jobs and supports economic growth
 MAP-21 themes Strengthens America s highway and public transportation systems Creates jobs and supports economic growth Supports the Department s aggressive safety agenda Simplifies and focuses the Federal
MAP-21 National Performance Management Measures. An Overview of Notice of Proposed Rulemakings And TAM Plans
 MAP-21 National Performance Management Measures An Overview of Notice of Proposed Rulemakings And TAM Plans Transportation Performance Management Rulemaking Asset Management Transportation Performance
Federal-aid 101 A Financial Overview. Mark Newland FHWA, Financial Manager Purdue Road School, 2014
 Federal-aid 101 A Financial Overview. Mark Newland FHWA, Financial Manager Purdue Road School, 2014 Objectives for Federal-aid 101 Provide an Overview of: What federal-aid funding is and where it comes
Congestion Management Process (CMP)
") Congestion Management Process (CMP) Introduction The Congestion Management Process (CMP) is a systematic, data-driven, and regionally accepted approach that aims to improve the performance of the transportation
Congestion Management Process (CMP) Introduction The Congestion Management Process (CMP) is a systematic, data-driven, and regionally accepted approach that aims to improve the performance of the transportation
THE EVOLUTION OF MULTIMODAL TRANSPORTATION PLANNING: KEY FACTORS IN SHAPING THE APPROACHES OF STATE DOTS
 THE EVOLUTION OF MULTIMODAL TRANSPORTATION PLANNING: KEY FACTORS IN SHAPING THE APPROACHES OF STATE DOTS A Thesis Presented to The Academic Faculty by Denise A. Smith In Partial Fulfillment of the Requirements
CHAPTER 1 INTRODUCTION
 CHAPTER 1 INTRODUCTION 1.1 ABOUT THE FREDERICKSBURG AREA METROPOLITAN PLANNING ORGANIZATION Established in 1992, the Fredericksburg Area Metropolitan Planning Organization (FAMPO) is the federally designated
ISTEA Reauthorization Principles
 ISTEA Reauthorization Principles POLICY PRINCIPLES OF THE STATE AND TERRITORIAL AIR POLLUTION PROGRAM ADMINISTRATORS AND THE ASSOCIATION OF LOCAL AIR POLLUTION CONTROL OFFICIALS ON THE REAUTHORIZATION
Chapter 3 - Goals, Objectives, & Strategies
 Chapter 3 - This chapter presents goals, objectives, and strategies that have been developed as part of the Richmond Area MPO 2026 Long-Range Transportation Plan (LRTP) update. Strategies have been developed
HB2 Implementation Policy Guide
 report HB2 Implementation Policy Guide prepared for Commonwealth Transportation Board date March 18, 2015 Table of Contents 1.0 Introduction... 9 1.1 HB2 Legislation Requirements... 10 House Bill 1887...
INTEGRATED TRANSPORTATION PLAN
 INTEGRATED TRANSPORTATION PLAN Town of Jackson and Teton County transportation performance measures but, first Des Moines Area MPO July 9 10, 2013 transporta5on planners transporta5on planners engineering
MTP VISIONS, GOALS, AND OBJECTIVES
 2 MTP VISIONS, GOALS, AND OBJECTIVES El Paso MPO 2045 Metropolitan Transportation Plan 2. GUIDING PRINCIPLES This chapter describes the process by which the vision and goals of the planning process were
SAFETY TARGETS AND THE STRATEGIC HIGHWAY SAFETY PLAN (SHSP)
") SAFETY TARGETS AND THE STRATEGIC HIGHWAY SAFETY PLAN (SHSP) presented to West Virginia Partnering for the Future Conference presented by Pam Beer April 18, 2018 SHSP Overview AASHTO published Strategic
SAFETY TARGETS AND THE STRATEGIC HIGHWAY SAFETY PLAN (SHSP) presented to West Virginia Partnering for the Future Conference presented by Pam Beer April 18, 2018 SHSP Overview AASHTO published Strategic
Proposed Comprehensive Update to the State of Rhode Island s Congestion Management Process
 Proposed Comprehensive Update to the State of Rhode Island s Statewide Planning Program January 2018 Summary Outline of of Action Steps 1. Develop Objectives for Congestion Management What is the desired
Mobility and System Reliability Goal
 Mobility and System Reliability Goal Provide surface transportation infrastructure and services that will advance the efficient and reliable movement of people and goods throughout the state. Background:
FHWA Programs Supporting Freight
 FHWA Programs Supporting Freight Institute for Trade and Transportation Studies Conference Office of Operations 1200 New Jersey Avenue S.E. Washington, D.C. 20590 www.ops.fhwa.dot.gov/freight Jeff Purdy,
Who Does What. Susan Handy TTP282 October 2017
 Who Does What Susan Handy TTP282 October 2017 So who does the supplying? Who is involved in deciding what kind of transportation system we will have? Players Government Industry Citizens/ Consumers Players
MAP 21: Rulemaking and Asset Condition
 Transportation Performance Management MAP 21: Rulemaking and Asset Condition Performance Measures: Pavement Condition to Assess the National Highway Performance Program Virginia Asphalt Association Conference
LTAP News. On July 6, 2012, President Obama INSIDE. MAP-21 and California Implementation SPRING 2013
 LTAP News SPRING 2013 MAP-21 and California Implementation On July 6, 2012, President Obama signed Public Law (P.L.) 112-141, surface transportation authorizing legislation Moving Ahead for Progress in
Federal Transit Administration. Planning Information Exchange June 13, 2014
 Federal Transit Administration Planning Information Exchange June 13, 2014 OVERVIEW Statewide and Metropolitan Transportation Planning Existing Requirements Joint Planning Notice of Proposed Rulemaking
Rapid City Area Metropolitan Planning Organization OPERATIONS PLAN
 Rapid City Area Metropolitan Planning Organization OPERATIONS PLAN Prepared for the Rapid City Area Metropolitan Planning Organization Endorsed by the Executive Policy Committee of the Rapid City Area
Chapter 10 Emerging Issues & Trends in Transportation Planning
 Chapter 10 Emerging Issues & Trends in Transportation Planning NOTE: This document has been prepared using Federal funding from the United States Department of Transportation. The United States Department
MEETING SUMMARY FOR APRIL 13, 2017
 SARASOTA/MANATEE METROPOLITAN PLANNING ORGANIZATION Performance Measures/Project Prioritization Process Ad Hoc Committee 7632 15 th Street East Sarasota, Florida 34243 3:00-5:00 PM MEETING SUMMARY FOR
ODOT Asset Management Plan 0
 ODOT Asset Management Plan 0 Table of Contents Executive Summary... 1 ODOT s Experience with Asset Management... 1 A New Way of Doing Business... 2 ODOT s Investment Plans... 3 Moving Forward... 5 1.0
2017 TRANSPORTATION POLICY STATEMENT
 0 TRANSPORTATION POLICY STATEMENT 1 1 1 1 1 1 0 1 0 1 0 1 Critical investments are needed to maintain and improve Virginia s transportation network. The structural imbalance between critical needs and
FISCAL YEAR UNIFIED PLANNING WORK PROGRAM
 FISCAL YEAR 20162017 UNIFIED PLANNING WORK PROGRAM TITLE VI NONDISCRIMINATION STATEMENT THE BRISTOL METROPOLITAN PLANNING ORGANIZATION ENSURES COMPLIANCE WITH TITLE VI OF THE CIVIL RIGHTS ACT OF 1964;
APPENDIX MPO 101: HISTORY, CONTEXT AND EVOLUTION OF METROPOLITAN TRANSPORTATION PLANNING
 A GUIDEBOOK FOR METROPOLITAN TRANSPORTATION PLANNING APPENDIX MPO 101: HISTORY, CONTEXT AND EVOLUTION OF METROPOLITAN TRANSPORTATION PLANNING In order to understand the ways that metropolitan planning
VTrans2040. VTrans Multimodal Transportation Plan (VMTP) Informational Webinar. June 21, :00 2:00 pm
 Informational Webinar. June 21, :00 2:00 pm") VTrans2040 VTrans Multimodal Transportation Plan (VMTP) Informational Webinar June 21, 2016 1:00 2:00 pm Webinar Agenda VTrans2040 ( Big Picture ) Review Needs Synthesis and Recommendations Overview Objectives
VTrans2040 VTrans Multimodal Transportation Plan (VMTP) Informational Webinar June 21, 2016 1:00 2:00 pm Webinar Agenda VTrans2040 ( Big Picture ) Review Needs Synthesis and Recommendations Overview Objectives
BALTIMORE METROPOLITAN PLANNING ORGANIZATION BALTIMORE REGIONAL TRANSPORTATION BOARD
 BALTIMORE METROPOLITAN PLANNING ORGANIZATION BALTIMORE REGIONAL TRANSPORTATION BOARD RESOLUTION #18 15 ESTABLISHING AN AGREEMENT FOR SHARING DATA AND METHODOLOGIES TO EFFECTIVELY APPLY A PERFORMANCE BASED
1 I N T R O D U C T I O N
 THE 2040 OKI REGIONAL TRANSPORTATION PLAN This is the metropolitan transportation plan for the Ohio-Kentucky-Indiana Regional Council of Governments (OKI). OKI is the federally designated regional transportation
CHAPTER 2 WHAT ARE WE TRYING TO ACHIEVE?
 CHAPTER 2 WHAT ARE WE TRYING TO ACHIEVE? VISION After significant public outreach and coordination with numerous agencies, organizations, and individuals, Phase 1 established a vision for transportation
Winston-Salem Urban Area Metropolitan Planning Organization Transportation Advisory Committee Action Request
 Winston-Salem Urban Area Metropolitan Planning Organization Transportation Advisory Committee Action Request Meeting Date: November 15, 2018 Agenda Item Number: _ 4 Action Requested: Endorsement of Performance
Regional Performance Measures Annual Progress Report TPO Board - 2/4/2016 Presentation by: Chris Wichman, Senior Planner
 2015 TPO Board - 2/4/2016 Presentation by: Chris Wichman, Senior Planner Overview History and definition of performance-based planning & programming Review of 2015 TPO Board Action Requested 2 History
Framework for ADOT Asset Management System. Jean A. Nehme, PhD, PE Arizona Department of Transportation
 Framework for ADOT Asset Management System Jean A. Nehme, PhD, PE Arizona Department of Transportation November 14, 2013 Arizona Pavements/Materials Conference 1 Presentation Overview Brief Intro to Transportation
Table of Contents PERMIAN BASIN MPO TIP 2
 Table of Contents Permian Basin MPO Membership and Structure... 3 Mission Statement... 3 Vision Statement... 3 Transportation Improvement Program (TIP)... 4 Year of Expenditure (YOE) Trends... 4 Total
Title Performance Subtitle Management: Advancing a National Meeting Transportation System Date
 5 th International Transportation Systems Performance Measurement and Data Conference Driving Decisions: Aligning Performance Measures to Support Decisions Title Performance Subtitle Management: Advancing
NORTHERN VIRGINIA TRANSPORTATION AUTHORITY
 XII NORTHERN VIRGINIA TRANSPORTATION AUTHORITY M E M O R A N D U M TO: FROM: Chairman Martin E. Nohe and Members Northern Virginia Transportation Authority Mary Hynes, Chairman, Governance and Personnel
FY 2019 Unified Planning Work Program FINAL. Regional Intergovernmental Council. June 14, Kanawha Putnam Metropolitan Planning Organization
 FY 2019 Unified Planning Work Program FINAL Regional Intergovernmental Council Kanawha Putnam Metropolitan Planning Organization June 14, 2018 315 D Street. South Charleston, WV. 25303 The Unified Planning
ACTIVE TRANSPORTATION ADVISORY COMMITTEE. Memphis MPO March 30, 2015
 ACTIVE TRANSPORTATION ADVISORY COMMITTEE Memphis MPO March 30, 2015 Agenda Welcome & Introductions Announcements and Briefings Livability 2040: Regional Transportation Plan Congestion Management Process
Under recently updated FHWA guidelines, the LRTP must be updated every four (4) years. The most recent LRTP is the 2035 Plan, adopted in early 2009.
 years. The most recent LRTP is the 2035 Plan, adopted in early 2009.") PLANS, POLICIES AND PROCESSES OF THE MPO The Winston-Salem Urban Area MPO is responsible for creating and maintaining many documents essential to the on-going transportation planning effort. These documents
PLANS, POLICIES AND PROCESSES OF THE MPO The Winston-Salem Urban Area MPO is responsible for creating and maintaining many documents essential to the on-going transportation planning effort. These documents
Joint House and Senate Transportation Committee Update to the Ten Year Plan
 Joint House and Senate Transportation Committee 2019 Update to the Ten Year Plan Federal and State Funding Sources 2 AFY19 Budget Revenue Estimates 3 FY19 Federal & State Funds Federal Funds 38% State
Introduction. National Performance Requirements. Addressing Performance in Mobility 2045
 Introduction Measuring and tracking the performance of the region s transportation system is a fundamental component of the Metropolitan Transportation Plan (MTP) and the performance-based planning process.
Introduction. National Performance Requirements. Addressing Performance in Mobility 2045
 Introduction Measuring and tracking the performance of the region s transportation system is a fundamental component of the Metropolitan Transportation Plan (MTP) and the performance-based planning process.
Memorandum. FROM: Jim Ortbal Rosalynn Hughey Barry Ng TO: HONORABLE MAYOR, CITY COUNCIL. DATE: June 16, 2017
 CITY OF SANjOSE CAPITAL OF SILICON VALLEY TO: HONORABLE MAYOR, CITY COUNCIL SUBJECT: TRANSPORTATION POLICY UPDATE REQUIRED BY STATE LAW - LOS TO VMT Memorandum FROM: Jim Ortbal Rosalynn Hughey Barry Ng
GOALS AND PERFORMANCE MEASURES
 PLANNING FRAMEWORK The planning framework guides the development of the Regional Transportation Plan, articulating what the region is trying to achieve. This chapter establishes a foundation to focus data-gathering
Chapter 1: The 2035 Virginia Surface Transportation Plan 1. Challenges & Opportunities 2 VTrans2035: The Precursor 2 The VSTP and VTrans2035 2
 November 2010 Table of Contents Executive Summary See Summary Map Chapter 1: The 2035 Virginia Surface Transportation Plan 1 Challenges & Opportunities 2 VTrans2035: The Precursor 2 The VSTP and VTrans2035
WTP Phase 2 Implementation & Freight System Plan
 WTP Phase 2 Implementation & Freight System Plan Tribal Transportation Planning Organization Kathy Murray Planning Studies Group; Multimodal Planning Division Jason Beloso, Strategic Planning Manager;
Project Summary. Project Objectives
 M2D2 Multi Modal Development and Delivery A project to support Michigan s economic recovery by improving MDOT s institutional capacity to plan, design, construct, operate and maintain Michigan s transportation
SMART SCALE Technical Guide
 prepared for Commonwealth Transportation Board date REVISED November 13, 2017 Table of Contents 1.0 Introduction... 1 1.1 SMART SCALE Legislation Requirements... 2 Funding Programs... 2 1.2 Roles and Responsibilities...
MAP-21 National Highway Performance Program Asset Management Plan
 MAP-21 National Highway Performance Program Asset Management Plan Federal Highway Administration March 2015 Webcast MAP-21 FHWA Performance Rulemaking Schedule MAP-21: Asset Management 2 Risk-Based Asset